
Translating Latent Representations for Money Laundering Detection
Proceedings of the Thirty-Fifth International Joint Conference on Artificial Intelligence. AI4Tech: AI Enabling Technologies. Pages 6500-6508.
https://doi.org/10.24963/ijcai.2026/723
© 2026 International Joint Conferences on Artificial Intelligence
Keywords
- Domain-specific AI4Tech: AI4Finance
Abstract
Anti-money laundering (AML) systems are important for safe economic trade and for the fight against financial crime. Recently, a number of AML algorithms based on graph neural networks (GNNs) and graph transformers (GTs) have been proposed. Compared to traditional machine learning solutions, these methods have been shown to achieve significantly better detection results. Yet, the state-of-the-art AML algorithms have a key limitation: they fail to jointly address money laundering classification and money laundering sub-network discovery, despite their strong theoretical connection. To bridge this gap, we propose a translation-based AML system (TAML) that is capable of jointly solving both problems within the same latent space. Our extensive experimental evaluation on multiple datasets demonstrates the superiority of TAML over the state-of-the-art in both tasks.
- [Ahmed, 2021] A Ahmed. Anti-money laundering recogni- tion through the gradient boosting classifier. Academy of Accounting and Financial Studies Journal, 25(5), 2021.
- [Altman et al., 2023] Erik Altman, Jovan Blanuša, Luc Von Niederhäusern, Béni Egressy, Andreea Anghel, and Kubilay Atasu. Realistic synthetic financial transactions for anti-money laundering models. Advances in Neural Information Processing Systems, 36:29851-29874, 2023.
- [Bordes et al., 2013] Antoine Bordes, Nicolas Usunier, Alberto Garcia-Duran, Jason Weston, and Oksana Yakhnenko. Translating embeddings for modeling multi-relational data. Advances in neural information processing systems, 26, 2013.
- [Boyd et al., 2012] Kendrick Boyd, Vitor Santos Costa, Jesse Davis, and C David Page. Unachievable region in precision-recall space and its effect on empirical evalua- tion. In ICML, volume 2012, page 349. NIH Public Ac- cess, 2012.
- [Boyd et al., 2013] Kendrick Boyd, Kevin H Eng, and C David Page. Area under the precision-recall curve: point estimates and confidence intervals. In Joint European con- ference on machine learning and knowledge discovery in databases, pages 451-466. Springer, 2013.
- [Bradley, 1997] Andrew P. Bradley. The use of the area un- der the roc curve in the evaluation of machine learning al- gorithms. Pattern Recognition, 30(7):1145-1159, 1997.
- [Chai et al., 2023] Ziwei Chai, Yang Yang, Jiawang Dan, Sheng Tian, Changhua Meng, Weiqiang Wang, and Yifei Sun. Towards learning to discover money laundering sub- network in massive transaction network. In Proceedings of the AAAI conference on artificial intelligence, volume 37, pages 14153-14160, 2023.
- [Cheng et al., 2023] Dawei Cheng, Yujia Ye, Sheng Xiang, Zhenwei Ma, Ying Zhang, and Changjun Jiang. Anti- money laundering by group-aware deep graph learning. IEEE Transactions on Knowledge and Data Engineering, 2023.
- [Colladon and Remondi, 2017] Andrea Fronzetti Colladon and Elisa Remondi. Using social network analysis to pre- vent money laundering. Expert Systems with Applications, 67:49-58, 2017.
- [EC, 2025] EC. Money laundering. In EC, 2025.
- [Elmougy and Liu, 2023] Youssef Elmougy and Ling Liu. Demystifying fraudulent transactions and illicit nodes in the bitcoin network for financial forensics. In Proceed- ings of the 29th ACM SIGKDD conference on knowledge discovery and data mining, pages 3979-3990, 2023.
- [Hamilton et al., 2017] Will Hamilton, Zhitao Ying, and Jure Leskovec. Inductive representation learning on large graphs. Advances in neural information processing sys- tems, 30, 2017.
- [Jullum et al., 2020] M. Jullum, A. Løland, R. Bang Huseby, G. Ånonsen, and J. Lorentzen. Detecting money launder- ing transactions with machine learning. Journal of Money Laundering Control, 23(1):173-186, 2020.
- [Kipf and Welling, 2017] Thomas N Kipf and Max Welling. Semi-supervised classification with graph convolutional networks. In International Conference on Learning Rep- resentations, 2017.
- [Kumagai et al., 2021] Atsutoshi Kumagai, Tomoharu Iwata, and Yasuhiro Fujiwara. Semi-supervised anomaly detection on attributed graphs. In 2021 International Joint Conference on Neural Networks (IJCNN), pages 1-8. IEEE, 2021.
- [Li et al., 2023] Xujia Li, Yuan Li, Xueying Mo, Hebing Xiao, Yanyan Shen, and Lei Chen. Diga: Guided diffu- sion model for graph recovery in anti-money laundering. In SIGKDD, pages 4404-4413, 2023.
- [Lin et al., 2024a] Dan Lin, Jiajing Wu, Yunmei Yu, Qishuang Fu, Zibin Zheng, and Changlin Yang. Dense- flow: Spotting cryptocurrency money laundering in ethereum transaction graphs. In Proceedings of the ACM Web Conference 2024, pages 4429-4438, 2024.
- [Lin et al., 2024b] Junhong Lin, Xiaojie Guo, Yada Zhu, Samuel Mitchell, Erik Altman, and Julian Shun. Fraudgt: a simple, effective, and efficient graph transformer for fi- nancial fraud detection. In Proceedings of the 5th ACM In- ternational Conference on AI in Finance, pages 292-300, 2024.
- [Luo et al., 2022] Xuexiong Luo, Jia Wu, Amin Beheshti, Jian Yang, Xiankun Zhang, Yuan Wang, and Shan Xue. Comga: Community-aware attributed graph anomaly de- tection. In Proceedings of the Fifteenth ACM International Conference on Web Search and Data Mining, pages 657- 665, 2022.
- [Odeh and Taleb, 2024] Ammar Odeh and Anas Abu Taleb. Utilizing linear regression and random forest models for money laundering identification. TELKOMNIKA (Telecommunication Computing Electronics and Control), 22(6):1573-1580, 2024.
- [Oztas et al., 2023] Berkan Oztas, Deniz Cetinkaya, Festus Adedoyin, Marcin Budka, Huseyin Dogan, and Gokhan Aksu. Enhancing anti-money laundering: Development of a synthetic transaction monitoring dataset. In 2023 IEEE International Conference on e-Business Engineering (ICEBE), pages 47-54. IEEE, 2023.
- [Oztas et al., 2025] Berkan Oztas, Deniz Cetinkaya, Festus Adedoyin, Marcin Budka, Huseyin Dogan, and Gokhan Aksu. Tab-aml: A transformer based transaction monitor- ing model for anti-money laundering. In 2025 IEEE Con- ference on Artificial Intelligence (CAI), pages 161-167. IEEE, 2025.
- [UNODC, 2025] UNODC. United nations office on drugs and crime. In UNODC, 2025.
- [Veličković et al., 2018] Petar Veličković, Guillem Cucurull, Arantxa Casanova, Adriana Romero, Pietro Liò, and Yoshua Bengio. Graph attention networks. In Interna- tional Conference on Learning Representations, 2018.
- [Weber et al., 2019] Mark Weber, Giacomo Domeniconi, Jie Chen, Daniel Karl I Weidele, Claudio Bellei, Tom Robin- son, and Charles Leiserson. Anti-money laundering in bit- coin: Experimenting with graph convolutional networks for financial forensics. In ACM SIGKDD International Conference on Knowledge Discovery and Data Mining, 2019.
- [Xu et al., 2019] Keyulu Xu, Weihua Hu, Jure Leskovec, and Stefanie Jegelka. How powerful are graph neural net- works? In International Conference on Learning Rep- resentations, 2019.
References were extracted automatically from the PDF and may contain errors.
Full text extracted automatically from the PDF; figures, tables and equations may differ. The PDF is the version of record.
1 Introduction
Money laundering (ML) is the process of illegally hiding the origin of monetary benefits gained through illicit activities [EC, 2025]. Although the global scale of money laundering is unknown, the United Nations Office on Drugs and Crime estimates that between 2% and 5% of the global GDP is laundered each year [UNODC, 2025]. It is therefore crucial for financial institutions to be equipped with strong antimoney laundering (AML) systems.
There are two core problems of paramount interest in money laundering detection. First, the classification of a given account as money laundering suspicious or not, known as money laundering classification [Lin et al., 2024b]. Second, the detection of money-laundering groups, known as money laundering sub-network discovery [Chai et al., 2023]. Despite the strong theoretical connection between the two tasks, which suggests the benefit of a synergistic solution, the state-of-the-art AML algorithms fail to address them jointly. They either focus on solving a single task [Lin et al., 2024a; Lin et al., 2024b; Oztas et al., 2025] or address both using separate representation spaces [Chai et al., 2023].
Positioning our work in the realm of graph representation learning, we introduce an encoder-agnostic AML system that bridges this gap by jointly solving ML classification and ML sub-network discovery. Our approach, called Translationbased Anti-Money Laundering (TAML), integrates with any state-of-the-art graph encoder, such as graph neural networks (GNNs) or graph transformers (GTs), and represents both accounts and transactions in a unified latent space. This unified representation space allows establishing a direction-aware geometry that reveals the solutions to both ML classification and ML sub-network discovery problems.
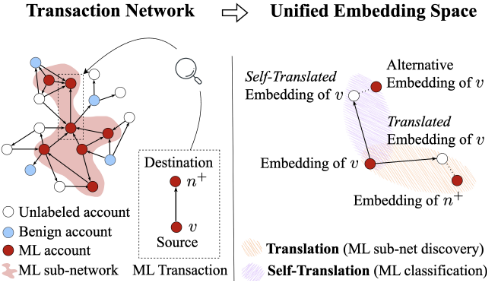
TAML is based on a novel supervised contrastive loss that establishes two geometric relations between accounts and transactions in the latent space. First, the hidden representation of a transaction between two colluding ML accounts must correspond to a translation in the embedding space between those accounts' hidden representations. That is, the embedding of the source ML account translates close to the embedding of the destination ML account via the hidden representation of their ML transaction. Second, to make the account embeddings label-informative (i.e., such that their position in the embedding space is informative about their label), we introduce the notion of self-translation. That is, we force the embedding of any ML account, to translate close to an alternative representation of itself, via the hidden representation of its own feature vector. Intuitively, this corresponds to the embedding of a self-loop/self-transaction. Figure 1 schematically depicts these relationships focusing on 2 ML accounts.
During inference, the translation process in the latent space guides a graph traversal process for accurate ML sub-network discovery, while self-translation assists with ML classification. Our main contributions can be summarized as follows:
- We provide, to the best of our knowledge, the first AML system capable of jointly solving ML classification and ML sub-network discovery within the same latent space.
- We perform an extensive experimental evaluation with supervised and semi-supervised datasets demonstrating the superiority of TAML over the state-of-the-art.
Following, we present related work (Section 2), the problem statement (Section 3), the TAML system (Section 4), the experimental evaluation including ablation, sensitivity, and scalability studies (Section 5), and a conclusion (Section 6). Our code is available at https://github.com/rricocuevas1/taml.
2 RelatedWork
Money laundering detection is often cast as a binary classification problem. Despite being highly interpretable, traditional methods used for ML classification such as Logistic Regression [Colladon and Remondi, 2017], Random Forest [Odeh and Taleb, 2024], or XGBoost [Jullum et al., 2020; Ahmed, 2021] are not graph-native, and hence, not well suited for learning from transaction data. Graph Neural Networks (GNNs) natively support graph-structured data. The most notable GNN architectures include GCN [Kipf and Welling, 2017], GraphSAGE [Hamilton et al., 2017], GAT [Veliˇckovi´c et al., 2018], and GIN [Xu et al., 2019]. However, these general architectures do not explicitly capture the group dynamics specific to money laundering (ML).
Recent GNN-based solutions to ML classification explicitly target the group behavior of accounts. For instance, ComGA [Luo et al., 2022] encodes both community-specific information via a multi-layer perceptron (MLP), and account attributes via a GNN. GAGNN [Cheng et al., 2023] incorporates group behavior by constructing an additional ML community graph that is used to enhance the hidden representation of ML accounts. Diga [Li et al., 2023] and AMAP [Chai et al., 2023] take a sequential approach by first solving ML sub-network discovery and then exploiting the ML sub-networks to better approach ML classification. Diga extracts sub-networks via personalized page rank (PPR). Then, it proposes a reconstruction-error-based anomaly detection approach, where the sub-network of the target node is reconstructed by a guided diffusion model. AMAP extracts ML sub-networks by using a GNN-based sub-network proposer. Subsequently, a dual-fusion classifier is trained to classify nodes based on the extracted ML sub-networks.
Recently, transformer-based architectures have been proposed to address ML classification. Specifically, AML graph transformers like FraudGT [Lin et al., 2024b] and AML tabular transformers such as Tab-AML [Oztas et al., 2025] have been developed. Further, shallowML sub-network discovery algorithms beyond PPR, like DenseFlow [Lin et al., 2024a] have been introduced. Denseflow detects ML sub-networks by finding dense subgraphs and applying the concept of maximum flow.
Our proposal draws inspiration from TransE [Bordes et al., 2013] and bears some resemblance to PBAD [Kumagai et al.,
2021], a graph-native anomaly detection algorithm that proposes a geometric-based supervised contrastive loss to learn node embedding positions that are indicative of their label.
3 Preliminaries and Problem Statement
A transaction network is a directed attributed graph G = {V,X, E,XE}, where V is a set of nodes, and E is a set of edges. Each node v ∈ V represents a user account. Each account has an associated feature vector xv ∈ Rd . X ∈ R|V|×d denotes the node feature matrix. A directed edge e = (v, u) ∈ E indicates that there exists at least one financial transaction from account v to account u. Each directed edge (v, u) is associated to a feature vector x(v,u) ∈ Rd′ that contains aggregated information about all transactions from account v to account u within a fixed timespan. XE ∈ R|E|×d′ denotes the edge feature matrix.
Given an account v ∈ V and a radius K ∈ N, the K-hop ego-network of v, denoted GK v , is the sub-graph of G induced by the set of nodes {u ∈ V : d(u, v) ≤ K}, where d(u, v) is the length of the undirected shortest path between u and v in G. The in-neighborhood of a node v ∈ V is the set Nin(v) = {u ∈ V | (u, v) ∈ E}, the out-neighborhood of v is the set Nout(v) = {u ∈ V | (v, u) ∈ E}, and the neighborhood of v is the set N(v) = Nin(v) ∪ Nout(v).
Problem 1 (AML). Let G = {V,X, E,XE} be a transaction network and Y ∈ {0, 1}|VL| be a vector containing the labels of the accounts in VL ⊆ V. Each component yv of Y indicates whether the account v ∈ VL is ML suspicious (yv = 1) or not (yv = 0).
The task is to train a model, such that given a new unseen transaction network G ′ = {V ′ ,X′ , E ′ ,X′E } that has no overlap with G, to achieve:
- ML Classification: predict whether a given account v ∈ V ′ is ML suspicious (yv = 1) or not (yv = 0), and
- ML Sub-network Discovery: for a given account v ∈ V ′ , with K-hop ego-network G ′K v , find the ML subnetwork of v, G ′+ v ⊆ G ′K v such that:
- (a) if v is ML suspicious then G ′+ v is connected and contains only ML suspicious accounts, including v.
- (b) if v is notML suspicious thenG ′+ v = {v}, the trivial sub-network.
The two sub-problems are equivalent under network completeness where the complete set of accounts with their respective transactions, and the complete set of labels are available. But under network incompleteness (e.g., in an institution's internal view of the global financial network), classification is generally strictly harder than sub-network discovery. In this case, ML classification can benefit from progress in ML sub-network discovery, motivating a joint approach. A longer discussion is included in the supplementary material.
4 Translation-based AML
We design a translation-based AML system that is capable of jointly solving ML classification and ML sub-network discovery within the same latent space. TAML comprises two core units: a translation and a self-translation unit. The translation unit is trained to extract ML sub-networks via translations in the embedding space. Given an account of interest v and an exploration radius K, it predicts a ML subnetwork ˆ G+ v ⊆ GK v . The self-translation unit learns how to classify nodes in such sub-networks by performing selftranslations in the embedding space. It assigns a ML risk score pu to every node u in ˆ G+ v . The sub-network informed ML classification score of the node of interest v, denoted ˆ yv , is the mean of the self-translation scores of the nodes u in ˆ G+ v .
4.1 TAML Training
Training TAML involves training the translation and selftranslation units. We introduce a joint training pipeline under a novel loss, denoted LTAML. We start by explaining the training of each unit and show how they merge into LTAML.
Translation Unit Training
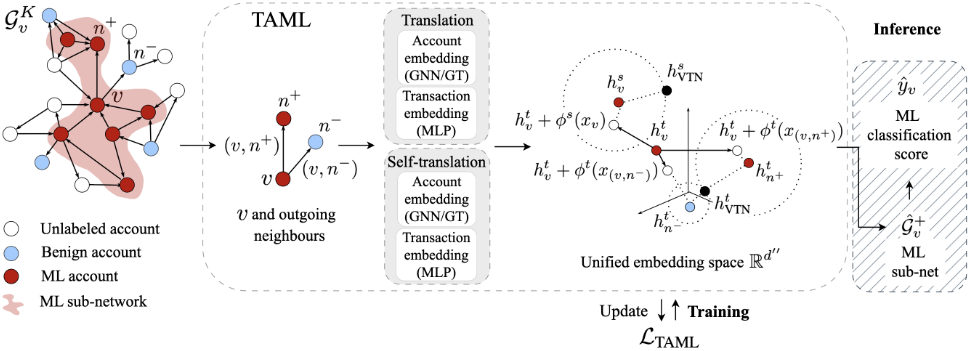
The translation unit is trained to perform ML sub-network discovery. We denote by htv ∈ Rd′′ the hidden representation of an account v when embedded by the translation unit, and refer to it as the t-embedding of v. Since TAML is encoderagnostic, any state-of-the-art graph encoder, such as a GNN or a GT, can serve as the account embedding module. Figure 2 reflects this architectural design.
In order to allow transaction-guided exploration of the latent space for ML sub-network discovery, we represent transactions in the same latent space as the accounts. To this end, fixed an account v, we embed transactions e = (v, n) ∈ E into Rd′′ via a multi-layer perceptron (MLP), denoted ϕt (·), that takes the edge features as input. That is, the latent representation of a transaction e = (v, n) with feature vector x(v,n) corresponds to a vector ϕt (x(v,n)) ∈ Rd′′ . Figure 2 visually depicts the unified embedding space Rd′′ .
With the aim of extracting sub-graph candidates ˆ G+ v as close as possible to the true ML sub-networks G+ v via latent space navigation, we enforce the following geometrical relations in the embedding space between the hidden representation of accounts and transactions at train time:
That is, the hidden representation of a directed transaction (v, n) between accounts v and n corresponds to a spatial translation ϕt (x(v,n)) in the embedding space between their corresponding hidden representations htv and htn , only if both v and n are ML accounts (if yv = yn = 1). These geometrical relations are illustrated in Figure 2.
To learn representations that comply with the geometrical relations intuitively described in equation (1), we design a translation-based supervised contrastive loss, denoted Lt . Formally, fixed v ∈ V,
where
Function σ(·) corresponds to the Sigmoid activation, || · || denotes the Euclidean distance, and ht VTN ∈ Rd′′ is a learnable parameter whose role is establishing the threshold above which the translated node htv + ϕt (x(v,n)) is close enough from the embedding of the destination account htn for the two accounts to be suspected of ML collaboration. Threshold ht VTN is formally refereed to as a virtual threshold. Virtual thresholds were recently introduced by [Chai et al., 2023] and, rather than forcing a global threshold for determining closeness in the latent space, they allow local nodedependent thresholding. Intuitively, pvn ≈ 1 in equation (3) if htv + ϕt (x(v,n)) falls inside the hypersphere of radius ||ht VTN - htn || centered around htn , and pvn ≈ 0 otherwise.
Consequently, the t-embeddings position accounts and transactions in the latent space relative to one another. This allows transaction-guided navigation of the latent space for ML sub-network extraction at inference time as described in Section 4.2. Next, we introduce the s-embeddings.
Self-translation Unit Training
The self-translation unit is trained to produce embeddings that are label-informative for an account, independent from the labels of its neighbors. We denote by hsv ∈ Rd′′ the hidden representation of an account v when embedded by the self-translation unit, and refer to it as the s-embedding of v. Just like in the translation unit, any state-of-the-art graph encoder, such as a GNN or a GT, can serve as the account encoder. Figure 2 reflects this choice.
Our aim is for the s- and t- embeddings to be jointly trained so the former benefits from the latter. To this end, we enforce the following relations between both representations in the embedding space at train time:
where ϕs (xv) (the hidden representation of the self-loop) corresponds to v's vector of features xv mapped via the ϕs MLP. In other words, any node v whose t-embedding is selftranslated via ϕs (xv) to its s-embedding is ML suspicious, and any node that does not is benign. This definition of selftranslation presents several beneficial characteristics. First, it spatially follows rather than restricts in any way the tembeddings. Second, it complements the t-embeddings by emphasizing the node features rather than the graph structure. Third, it enables individual node classification.
To learn s-embeddings that comply with the aforementioned geometrical notions of self-translation, we design a custom self-translation-based supervised contrastive loss, denoted Ls . Formally, given an account v ∈ V:
where
Again, σ(·) is the Sigmoid activation function, ||·|| denotes the Euclidean distance, and hs VTN ∈ Rd′′ is a virtual threshold.
The Unified Loss
The TAML loss is the convex combination between Lt (v), equation (2), and Ls (v), equation (5). Formally,
where, λ ∈ [0, 1] is a balancing hyperparameter, and VT is the training account set. We employ majority-class undersampling to address class imbalance. Specifically, we randomly sample the same number of 0-labeled accounts as 1-labeled accounts from the set of labeled accounts, VL, to build VT .
4.2 TAML Inference
Translation Unit Inference (ML Sub-network Discovery)
Fixed an account of interest v and an exploration hop K, the translation unit explores GK v starting from v in a breadth first search fashion. More precisely, consider exploration hop i. Each member c of the set of ML suspicious node candidates found in iteration i - 1, denoted C i-1 , is expanded forwards as follows: ∀n ∈ Nout(c), the embedding space Rd′′ is traversed in the direction of ϕt (x(c,n)), starting from the hidden t-embedding of the candidate htc . In case htc + ϕt (x(c,n)) is closer to htn than the virtual node ht VTN , n is included into C i , originally empty. Subsequently, in order to explore c's incoming neighbors, backwards expansion is performed: ∀n ∈ Nin(c), Rd′′ is traversed in the direction of ϕt (x(n,c)) , starting from htn . In case htn +ϕt (x(n,c)) is closer to htc than ht VTN , n is added to C i . The estimated ML sub-network for account v corresponds to ˆ G+ v = ⋃0≤i≤K C i .
Self-translation Unit Inference (ML Classification)
For each node u in ˆ G+ v the ML risk corresponds to pu as in equation (6). Finally, the predicted sub-network informed ML classification score of v, denoted ˆ yv, is computed as the mean of the risk scores in ˆ G+ v . Formally, ˆ yv = 1 | ˆ G+ v | ∑u∈ ˆ G+ v pu.
TAML outputs (ˆ yv, ˆ G+ v ): The classification score ˆ yv together with the sub-network ˆ G+ v that lead to the classification decision. ˆ G+ v also acts as a form of explanation of ˆ yv. Detailed pseudo-code is provided in the supplementary material.
4.3 Complexity Analysis
Let Cn(d, d′′ , η, κ) and Ce(d′ , d′′ , ηe) be the costs to embed a node v with features xv ∈ Rd and edge e with features xe ∈ Rd′ into Rd′′ . Here, η and ηe denote the graph encoder and MLP depths, respectively, and κ is the neighborhood size.
Training. Let degLout be the average number of labeled outneighbors for nodes in VT . Computing LTAML involves computing Lt (v) and Ls (v), ∀v ∈ VT . Fixed v, Lt (v) requires degLout translations, and Ls (v) requires a self-translation. Each operation takes O(Cn +Ce) time. Therefore, the training time complexity of TAML is O(|VT | · degLout · (Cn +Ce)).
Inference. Let deg be the average node degree in G, and ˆ E + the estimated maximum number of 1-to-1 connections for an account in G. The translation unit makes K exploration rounds to estimate ˆ G+ v . Each round considers at most O(| ˆ E +|) candidates, and O(deg) translations are executed for each. Finally, ˆ yv is computed via | ˆ G+ v | self-translations. Therefore, fixed v, the inference time complexity of TAML is O(K · | ˆ E +| · deg · (Cn +Ce)).
5 Experimental Evaluation
We now describe our experimental evaluation run on a GPUpowered server with Pytorch 1.4 as computing infrastructure.
5.1 Experimental Setup
Compared Methods
We selected 2 baselines and 5 state-of-the-art AML algorithms including feature-based, GNN-based, group-aware GNN-based, and transformer-based algorithms. Specifically:
- XGBoost [Jullum et al., 2020] is the feature-based ML classification baseline.
| Data | Elliptic++ | SAML-D | IBM-AML | Mean | ||||||||
|---|---|---|---|---|---|---|---|---|---|---|---|---|
| Time | 36 | 37 | 38 | 39 | 40 | 41 | 42 | 10 | 11 | 9 | 10 | |
| Random | 0.07± 0.00 | 0.13± 0.00 | 0.05± 0.00 | 0.03± 0.00 | 0.05± 0.00 | 0.03± 0.00 | 0.04± 0.00 | 0.07± 0.00 | 0.13± 0.00 | 0.01± 0.00 | 0.04± 0.00 | 0.03 |
| XGBoost | 0.32± 0.13 | 0.58± 0.04 | 0.24± 0.02 | 0.03± 0.00 | 0.09± 0.02 | 0.04± 0.01 | 0.07± 0.01 | 0.22± 0.01 | 0.20± 0.01 | 0.01± 0.00 | 0.05± 0.00 | 0.14 |
| PBAD | 0.55± 0.01 | 0.66± 0.01 | 0.04± 0.00 | 0.03± 0.00 | 0.06± 0.01 | 0.02± 0.00 | 0.03± 0.00 | 0.49± 0.03 | 0.55± 0.01 | 0.06± 0.00 | 0.15± 0.00 | 0.22 |
| AMAP | 0.61± 0.25 | 0.40± 0.28 | 0.13± 0.06 | 0.08± 0.07 | 0.10± 0.10 | 0.08± 0.04 | 0.10± 0.04 | 0.43± 0.21 | 0.38± 0.25 | 0.12± 0.02 | 0.32± 0.05 | 0.23 |
| FraudGT | 0.65± 0.19 | 0.75± 0.11 | 0.34± 0.13 | 0.16± 0.06 | 0.53± 0.04 | 0.52± 0.11 | 0.53± 0.05 | 0.92± 0.02 | 0.91± 0.02 | 0.43± 0.01 | 0.65± 0.01 | 0.57 |
| Tab-AML | 0.94± 0.00 | 0.73± 0.01 | 0.17± 0.00 | 0.10± 0.00 | 0.17± 0.00 | 0.11± 0.00 | 0.15± 0.00 | 0.26± 0.02 | 0.24± 0.02 | 0.05± 0.00 | 0.12± 0.00 | 0.26 |
| TAML-GCN | 0.78± 0.09 | 0.82± 0.04 | 0.18± 0.00 | 0.09± 0.03 | 0.36± 0.05 | 0.15± 0.01 | 0.25± 0.01 | 0.71± 0.07 | 0.73± 0.06 | 0.11± 0.01 | 0.29± 0.01 | 0.39 |
| TAML-GAT | 0.95± 0.02 | 0.81± 0.07 | 0.29± 0.11 | 0.13± 0.13 | 0.42± 0.09 | 0.23± 0.11 | 0.40± 0.15 | 0.88± 0.02 | 0.87± 0.02 | 0.09± 0.02 | 0.36± 0.02 | 0.48 |
| TAML-FraudGT | 0.95± 0.05 | 0.88± 0.02 | 0.61± 0.05 | 0.34± 0.17 | 0.61± 0.05 | 0.61± 0.08 | 0.57± 0.02 | 0.92± 0.00 | 0.91± 0.01 | 0.39± 0.02 | 0.65± 0.01 | 0.67 |
| Random | 0.50± 0.00 | 0.50± 0.00 | 0.50± 0.00 | 0.50± 0.00 | 0.50± 0.00 | 0.50± 0.00 | 0.50± 0.00 | 0.50± 0.00 | 0.50± 0.00 | 0.50± 0.00 | 0.50± 0.00 | 0.50 |
|---|---|---|---|---|---|---|---|---|---|---|---|---|
| XGBoost | 0.65± 0.07 | 0.79± 0.03 | 0.68± 0.01 | 0.51± 0.01 | 0.56± 0.03 | 0.51± 0.01 | 0.54± 0.01 | 0.91± 0.01 | 0.92± 0.01 | 0.57± 0.00 | 0.58± 0.00 | 0.66 |
| PBAD | 0.95± 0.01 | 0.80± 0.02 | 0.36± 0.05 | 0.37± 0.11 | 0.51± 0.03 | 0.35± 0.08 | 0.33± 0.02 | 0.86± 0.05 | 0.85± 0.06 | 0.72± 0.00 | 0.70± 0.00 | 0.62 |
| AMAP | 0.95± 0.03 | 0.75± 0.21 | 0.75± 0.07 | 0.65± 0.21 | 0.56± 0.15 | 0.72± 0.15 | 0.75± 0.09 | 0.97± 0.01 | 0.97± 0.00 | 0.77± 0.04 | 0.78± 0.03 | 0.78 |
| FraudGT | 0.97± 0.01 | 0.91± 0.03 | 0.83± 0.02 | 0.82± 0.02 | 0.81± 0.04 | 0.91± 0.02 | 0.83± 0.04 | 1.00± 0.00 | 1.00± 0.00 | 0.94± 0.00 | 0.95± 0.00 | 0.91 |
| Tab-AML | 0.99± 0.00 | 0.94± 0.00 | 0.85± 0.00 | 0.85± 0.00 | 0.85± 0.00 | 0.87± 0.00 | 0.87± 0.00 | 0.96± 0.01 | 0.96± 0.00 | 0.72± 0.00 | 0.63± 0.00 | 0.86 |
| TAML-GCN | 0.98± 0.01 | 0.94± 0.03 | 0.84± 0.02 | 0.79± 0.05 | 0.85± 0.02 | 0.89± 0.01 | 0.92± 0.01 | 0.99± 0.00 | 0.99± 0.00 | 0.80± 0.01 | 0.79± 0.01 | 0.89 |
| TAML-GAT | 0.99± 0.00 | 0.95± 0.01 | 0.88± 0.02 | 0.79± 0.07 | 0.83± 0.04 | 0.91± 0.04 | 0.93± 0.04 | 1.00± 0.00 | 0.99± 0.00 | 0.78± 0.02 | 0.79± 0.03 | 0.89 |
| TAML-FraudGT | 1.00± 0.00 | 0.95± 0.01 | 0.90± 0.03 | 0.87± 0.03 | 0.87± 0.02 | 0.95± 0.01 | 0.87± 0.01 | 1.00± 0.00 | 1.00± 0.00 | 0.94± 0.00 | 0.95± 0.00 | 0.94 |
Table 1: Experimental results on money laundering classification.
- PBAD [Kumagai et al., 2021] is the GNN-based geometric anomaly detection ML classification baseline.
- Diga [Li et al., 2023] 1 is the state-of-the-art shallow group-aware GNN-based AML algorithm.
- AMAP [Chai et al., 2023] is the state-of-the-art deep group-aware GNN-based AML algorithm. Like Diga it achieves both classification and sub-network discovery.
- DenseFlow [Lin et al., 2024a] is the state-of-the-art shallow ML sub-network discovery algorithm.
- FraudGT [Lin et al., 2024b] is the state-of-the-art graph-transformer-based ML classification algorithm.
- Tab-AML [Oztas et al., 2025] is the state-of-the-art tabular-transformer-based ML classification algorithm.
For a fair comparison, we include configurations of TAML sharing the same encoders as that of the baselines when applicable. We denote said configurations by TAML-[encoder]. We have considered TAML-GAT to compare against AMAP and Diga, TAML-GCN to compare against PBAD, and TAML-FraudGT to compare against FraudGT. Unless specified otherwise, TAML refers to TAML-FraudGT.
Datasets
Elliptic++ [Elmougy and Liu, 2023] contains real Bitcoin transaction data, and extends Elliptic [Weber et al., 2019] with account information. It contains transaction graphs corresponding to 49 time steps (weeks), but due to a change in the network structure, only the first 42 are usable [Weber et al., 2019]. There are 822.942 accounts, described by 55 features each, and 2.868.964 transactions with 182 features each. 14.266 accounts are labeled as 1, 251.088 are labeled as 0, and 557.588 have no label. That is, a class skew of 5, 38%.
1 We were unable to reproduce Diga's originally reported classification performance due to convergence issues during training.
SAML-D [Oztas et al., 2023] is a synthetic dataset containing 9.504.852 transactions over 11 time steps (months), described by 10 features each. Based on the raw transaction data, we built 11 directed attributed graphs, containing a total of 856.951 accounts, described by 19 features, out of which 2.470 accounts are labeled as 1 and 854.481 are labeled as 0. That is, a class skew of 0, 288%.
IBM-AML [Altman et al., 2023] is a collection of files containing synthetic financial transactions simulated in a financial ecosystem where individuals, companies, and banks interact. We selected the HI-Small Trans.csv file. The file contains 5.000.000 transactions over 10 different time steps (days), described by 10 features. Based on the raw transaction data, we built 10 directed attributed graphs, containing a total of 515.000 accounts with 26 features, out of which 5.893 are labeled as 1 and 509.107 are labeled as 0. That is, a class skew of 1, 16%.
We derived account features and account labels in SAMLD and IBM-AML by taking inspiration from how Elliptic++ extends Elliptic. As each dataset's transaction feature set allows for the computation of different aggregate and directional account features, the number of derived features differs per dataset. An account is labeled as 1 if it participates in at least one transaction labeled as 1. The supplementary material provides an extended discussion.
To prevent data leakage in all datasets, we deleted from the training and validation sets all accounts appearing in the test set along with all their transactions. Further, feature normalization parameters were computed based solely on the training and validation splits. We chose 70%-15%-15% trainvalidation-test temporal splits for all datasets.
ML Classification Evaluation Metrics
We measure the performance of the models on ML classification with AUPRC, the area under the precision recall curve [Boyd et al., 2013] and AUROC, the area under the receiver operating characteristic curve [Bradley, 1997]. Both curves allow the evaluation of binary classification performance over a range of thresholds.
| Data | Elliptic++ | SAML-D | IBM-AML | Mean | ||||||||
|---|---|---|---|---|---|---|---|---|---|---|---|---|
| Time | 36 | 37 | 38 | 39 | 40 | 41 | 42 | 10 | 11 | 9 | 10 | |
| Diga DenseFlow AMAP | 0.36± 0.00 0.83± 0.00 0.90± 0.00 | 0.31± 0.00 0.92± 0.00 0.92± 0.00 | 0.31± 0.00 0.72± 0.00 0.90± 0.01 | 0.31± 0.00 0.73± 0.00 0.86± 0.01 | 0.32± 0.00 0.44± 0.00 0.87± 0.01 | 0.32± 0.00 0.64± 0.00 0.87± 0.01 | 0.35± 0.00 0.46± 0.00 0.88± 0.01 | 0.27± 0.00 0.34± 0.00 0.91± 0.02 | 0.28± 0.00 0.35± 0.00 0.90± 0.02 | 0.39± 0.00 0.95± 0.00 0.65± 0.03 | 0.42± 0.00 0.75± 0.00 0.61± 0.02 | 0.33 0.65 0.84 |
| TAML-GAT TAML-FraudGT | 0.97± 0.00 0.98± 0.00 | 0.90± 0.02 0.94± 0.02 | 0.91± 0.01 0.92± 0.01 | 0.85± 0.03 0.88± 0.00 | 0.98± 0.00 0.98± 0.00 | 0.97± 0.00 0.98± 0.00 | 0.95± 0.03 0.98± 0.00 | 1.00± 0.00 1.00± 0.00 | 1.00± 0.00 1.00± 0.00 | 0.99± 0.01 0.98± 0.00 | 0.98± 0.02 0.97± 0.00 | 0.95 0.96 |
| (a) P0 (Mean ± Std). The last column denotes the mean P0 aggregated across all datasets and time steps. | ||||||||||||
| Diga DenseFlow AMAP | 0.76± 0.00 0.86± 0.00 0.96± 0.00 | 0.94± 0.00 0.98± 0.00 0.97± 0.00 | 0.94± 0.00 0.60± 0.00 0.93± 0.01 | 0.90± 0.01 0.72± 0.00 0.88± 0.02 | 0.92± 0.00 0.38± 0.00 0.93± 0.01 | 0.94± 0.00 0.54± 0.00 0.92± 0.02 | 0.95± 0.00 0.37± 0.00 0.92± 0.01 | 0.68± 0.00 0.35± 0.00 0.55± 0.01 | 0.68± 0.00 0.37± 0.00 0.56± 0.00 | 0.65± 0.00 0.40± 0.00 0.64± 0.01 | 0.83± 0.00 0.41± 0.00 0.84± 0.00 | 0.84 0.54 0.83 |
| TAML-GAT TAML-FraudGT | 1.00± 0.00 1.00± 0.00 | 1.00± 0.00 1.00± 0.00 | 0.99± 0.03 0.99± 0.00 | 0.99± 0.00 0.99± 0.00 | 1.00± 0.00 1.00± 0.00 | 1.00± 0.00 0.99± 0.00 | 0.99± 0.00 0.99± 0.00 | 1.00± 0.00 1.00± 0.00 | 0.99± 0.00 1.00± 0.00 | 0.97± 0.02 0.95± 0.00 | 0.98± 0.01 0.97± 0.00 | 0.99 0.99 |
| (b) P1 (Mean ± Std). The last column denotes the mean P1 aggregated across all datasets and time steps. | ||||||||||||
| Diga DenseFlow AMAP | 0.06± 0.00 0.03± 0.00 0.98± 0.00 | 0.18± 0.00 0.07± 0.00 0.82± 0.00 | 0.36± 0.00 0.15± 0.00 0.65± 0.01 | 0.52± 0.01 0.20± 0.00 0.57± 0.00 | 0.32± 0.00 0.12± 0.00 0.63± 0.01 | 0.53± 0.00 0.25± 0.00 0.80± 0.01 | 0.45± 0.00 0.17± 0.00 0.71± 0.02 | 0.62± 0.00 0.33± 0.00 0.96± 0.01 | 0.67± 0.00 0.34± 0.00 0.98± 0.01 | 0.82± 0.00 0.46± 0.00 0.86± 0.01 | 0.93± 0.00 0.43± 0.00 0.94± 0.00 | 0.50 0.23 0.81 |
| TAML-GAT TAML-FraudGT | 0.33± 0.40 0.82± 0.40 | 0.83± 0.01 0.85± 0.05 | 0.78± 0.05 0.75± 0.04 | 0.78± 0.02 0.72± 0.10 | 0.59± 0.01 0.58± 0.01 | 0.87± 0.02 0.83± 0.03 | 0.64± 0.00 0.64± 0.02 | 1.00± 0.00 0.99± 0.00 | 1.00± 0.00 1.00± 0.00 | 0.71± 0.14 0.79± 0.01 | 0.79± 0.18 0.89± 0.00 | 0.76 0.81 |
Table 2: Experimental results on money laundering sub-network discovery.
For a global score of the models' performance, we also report mean AUROC and mean AUNPRC. AUNPRC, the Normalized AUPRC [Boyd et al., 2012], accounts for class skew so it can be meaningfully averaged over multiple datasets.
ML Sub-network Discovery Metrics
To assess the performance of the methods on the ML subnetwork discovery task, we calculate precision and recall at the level of the sub-network extracted for each node. That is, precision Pv = | ˆ G+ v ∩ G+ v |/| ˆ G+ v |, and recall Rv = | ˆ G+ v ∩ G+ v |/|G + v |, where G + v and ˆ G+ v are the true and estimated ML sub-networks, respectively. Finally, we average the node-wise precision and recall scores over all nodes per class. Formally, Pi = 1/|V iL| · ∑v∈V iL Pv, Ri = 1/|V iL| · ∑v∈V iL Rv, for i ∈ {0, 1}. Since G + v = {v}, ∀v ∈ V | yv = 0, R0 ≡ 1. Hence, R0 is omitted from the result tables.
5.2 Results
The presented results are averaged over 5 training rounds with different random seeds. TAML's hyperparameter configuration is (λ = 0.5, d′′ = 16) on Elliptic++, (λ = 0.75, d′′ = 32) on SAML-D, and (λ = 0.75, d′′ = 16) on IBM-AML.
ML Classification
Table 1 presents the performance of the compared methods on the ML classification task. We make two key observations.
First, the non-transformer-based configurations of TAML, TAML-GCN and TAML-GAT, outperform every other nontransformer-based method. In particular, TAML-GCN and TAML-GAT greatly surpass PBAD and AMAP in terms of mean AUNPRC and mean AUROC, respectively.
Second, the transformer-based configuration of TAML, TAML-FraudGT, outperforms all its transformer-based competitors. It surpasses FraudGT and Tab-AML by a large margin in terms of mean AUNPRC and mean AUROC. Overall, TAML-FraudGT attains the highest performance across most datasets, time windows, and metrics, demonstrating the best performance on the ML classification task on average.
ML Sub-network Discovery
Table 2 shows the performance of the systems on the ML subnetwork discovery task. Two key observations can be made.
First, TAML-FraudGT achieves the highest overall performance on ML sub-network discovery, and TAML-GAT generally outperforms AMAP. TAML models the conditional probability distribution P(yn|yv) by enforcing the spatial relations in eq. (1) via loss Lt (v) as in eq. (2). This enables it to better distinguish between 1-to-1, 1-to-0, 0-to-1, and 0-to-0 transactions, allowing it to best balance precision and recall.
Second, we observe that shallow sub-network discovery algorithms like DenseFlow or Diga's PPR are weaker than their machine-learning based competitors, AMAP and TAML.
5.3 Ablation Study
To evaluate the significance of each unit in TAML, we conduct an ablation study. To this end, we design four ablation models, whose performance is summarized in Table 3. The reported results are averaged over time steps. First, we remove the translation unit entirely, removing TAML's ability for sub-network discovery. Second, we remove the self-translation unit entirely, removing TAML's ability for classification. We observe that the complete model outperforms these two ablation models, indicating the benefit of our joint approach to classification and sub-network discovery. Third, we replace TAML's translation unit with Diga's shallow sub-network proposer. The lower ML sub-network discovery results justify a machine learning-based approach to sub-network discovery. Further, the difference in ML classification with respect to the full model illustrate the effect that sub-network discovery performance has in classification performance. Lastly, we simplify the self-translation unit setting its backbone and virtual threshold equal to that of the translation unit. The effect of this ablation shows that the independence of components within units is justified.

| TAML units | ML classification | ML sub-net discovery | ||||
|---|---|---|---|---|---|---|
| Translation | Self-trans | AUNPRC | AUROC | P1 | P0 | R1 |
| × | ✓ | 0.57 | 0.88 | - | - | - |
| ✓ | × | - | - | 0.99 | 0.95 | 0.69 |
| SHALLOW | ✓ | 0.47 | 0.83 | 0.91 | 0.33 | 0.35 |
| ✓ | SIMPLE | 0.57 | 0.90 | 0.99 | 0.95 | 0.73 |
| ✓ | ✓ | 0.64 | 0.92 | 0.99 | 0.95 | 0.74 |
| ML classification | ML sub-net discovery | ||||
|---|---|---|---|---|---|
| Method | AUNPRC | AUROC | P1 | P0 | R1 |
| GCN | 0.25 | 0.85 | - | - | - |
| GIN | 0.28 | 0.82 | - | - | - |
| GAT | 0.35 | 0.84 | - | - | - |
| GATe | 0.40 | 0.87 | - | - | - |
| FraudGT | 0.48 | 0.87 | - | - | - |
| TAML-GCN | 0.36 (↑ 44%) | 0.89 (↑ 5%) | 0.99 | 0.93 | 0.75 |
| TAML-GIN | 0.42 (↑ 50%) | 0.89 (↑ 9%) | 0.99 | 0.94 | 0.73 |
| TAML-GAT | 0.45 (↑ 29%) | 0.90 (↑ 7%) | 0.99 | 0.93 | 0.69 |
| TAML-GATe | 0.50 (↑ 25%) | 0.91 (↑ 5%) | 0.99 | 0.94 | 0.72 |
| TAML-FraudGT | 0.64 (↑ 33%) | 0.92 (↑ 6%) | 0.99 | 0.95 | 0.74 |
Additionally, we report the performance of TAML with different graph encoders in Table 4. The results are averaged over time steps. TAML brings significant improvements in ML classification over the encoders trained with majorityclass undersampled binary cross entropy (BCE) loss. Further, edge-feature-aware encoders like GAT with edge-feature aggregation (GATe) or FraudGT lead to the best performance when trained both with BCE and in TAML, which reinforces the relevance of capturing edge feature information.
5.4 Scalability Study
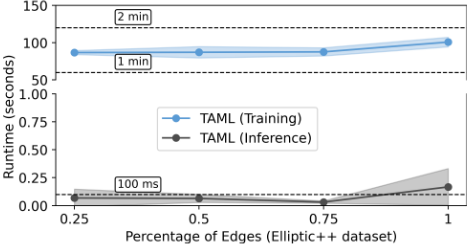
To assess the scalability of TAML in the context of a realworld financial network, we simulate increasing transaction volumes on Elliptic++. For each, we measure TAML's average training runtime per epoch for 100 epochs and its average inference runtime per test account. Figure 4 depicts the results. The slowly increasing linear trend in both training and inference runtime hint towards the practical applicability of TAML to real-world financial networks. Further, the trend is aligned with TAML's time complexity. The training and test time complexities of TAML depend linearly on degLout and ˆ E +, respectively. Both of these variables are O(E).
5.5 Sensitivity Analysis
We observe that TAML shows low sensitivity to λ on the synthetic datasets (see supplementary material). This is expected as these datasets are network-complete and hence both AML tasks are theoretically equivalent. With respect to Elliptic++, which is network-incomplete, Figure 3 shows that TAML is slightly sensitive to the choice of λ across tasks and metrics. The best classification results are achieved for λ = 0.25 whereas the best sub-network discovery results are achieved for λ ∈ {0.5, 0.75}, which is in line with λ's role in LTAML. We propose using λ = 0.5 when interested in both AML tasks under network-incompleteness. With respect to d′′ , we observe across all datasets and tasks that 8 ≤ d′′ ≤ 32 generally provides enough expressiveness while avoiding the complex geometry of high dimensional spaces.
6 Conclusion
In this work, we introduce TAML: an encoder-agnostic translation-based AML system that is first to simultaneously solve ML classification and ML sub-network discovery within the same latent space, two core tasks in the AML domain that were previously solved separately. Our extensive evaluation demonstrates TAML's practical applicability and its superiority over the state-of-the-art in both tasks.
Acknowledgments
This work has been conducted in the context of ING-UU research cooperation which is partially funded by ING Bank N.V.
@inproceedings{ijcai2026p723,
  title     = {Translating Latent Representations for Money Laundering Detection},
  author    = {Rico, Ramon and Hulpus, Ioana and Leisink, Stan and Zhao, Boyang and Velegrakis, Yannis},
  booktitle = {Proceedings of the Thirty-Fifth International Joint Conference on
               Artificial Intelligence, {IJCAI-26}},
  publisher = {International Joint Conferences on Artificial Intelligence Organization},
  editor    = {Diego Calvanese},
  pages     = {6500--6508},
  year      = {2026},
  month     = {8},
  note      = {AI4Tech: AI Enabling Technologies},
  doi       = {10.24963/ijcai.2026/723},
  url       = {https://doi.org/10.24963/ijcai.2026/723},
}
TY - CPAPER TI - Translating Latent Representations for Money Laundering Detection AU - Rico, Ramon AU - Hulpus, Ioana AU - Leisink, Stan AU - Zhao, Boyang AU - Velegrakis, Yannis T2 - Proceedings of the Thirty-Fifth International Joint Conference on Artificial Intelligence, IJCAI-26 PB - International Joint Conferences on Artificial Intelligence Organization PY - 2026 SP - 6500 EP - 6508 DO - 10.24963/ijcai.2026/723 UR - https://doi.org/10.24963/ijcai.2026/723 ER -Copied
Machine-readable versions of this paper, for tools and AI agents:





