
GDAs-OT: A Prediction Method of Gene-Disease Associations Based on Optimal Transport for Identifying Genes Related to Immune-Related Adverse Events
Proceedings of the Thirty-Fifth International Joint Conference on Artificial Intelligence. Main Track. Pages 5594-5602.
https://doi.org/10.24963/ijcai.2026/623
Keywords
- Multidisciplinary Topics and Applications: Bioinformatics
- Multidisciplinary Topics and Applications: Life sciences
- Multidisciplinary Topics and Applications: Health and medicine
Abstract
Immune Checkpoint Inhibitors (ICIs) represent a cornerstone of modern cancer immunotherapy. However, their clinical application is frequently accompanied by immune-related Adverse Events (irAEs) of diverse severity. Predicting Gene-Disease Associations (GDAs) is crucial for identifying the related genes that cause irAEs but remains experimentally expensive in the context of cancer immunotherapy. While existing graph neural network-based methods provide solutions to this problem, they often overlook disease-disease and disease-gene associations that may exist but have not yet been identified, leading to contaminated representations. To address these limitations, we propose Gene-Disease Associations based on Optimal Transport (GDAs-OT), a novel framework for GDA prediction. GDAs-OT constructs gene-gene, disease-disease and gene-disease relationships as graphs. Optimal transport was utilized to identify potential disease-disease associations to expand the disease-disease graph structure, and select high-confidence negative pairs in the gene-disease graph. By mapping nodes into a refined embedding space, the processed gene-disease graph guides node representation learning, providing robust node representations. Comprehensive experiments demonstrate that GDAs-OT outperforms state-of-the-art methods across most evaluation metrics. In addition, GDAs-OT successfully identifies potential risk genes for irAEs, providing a computational foundation for understanding the mechanisms of immunotherapy toxicity. Code is available at
https://github.com/RuhaoLiu/GDAs-OT.
- [Andreu et al., 2025] Jose L Mellina Andreu, Luis Bernal, Antonio F Skarmeta, Mina Ryten, Sara Álvarez, Alejan- dro Cisterna García, and Juan A Botía. Phenolinker: Phenotype-gene link prediction and explanation using het- erogeneous graph neural networks. Artificial Intelligence in Medicine, page 103177, 2025.
- [Ashburner et al., 2000] Michael Ashburner, Catherine A Ball, Judith A Blake, David Botstein, Heather Butler, J Michael Cherry, Allan P Davis, Kara Dolinski, Selina S Dwight, Janan T Eppig, et al. Gene ontology: tool for the unification of biology. Nature Genetics, 25(1):25-29, 2000.
- [Cuturi, 2013] Marco Cuturi. Sinkhorn distances: Light- speed computation of optimal transport. Advances in Neu- ral Information Processing Systems, 26, 2013.
- [Gu et al., 2021] Yu Gu, Robert Tinn, Hao Cheng, Michael Lucas, Naoto Usuyama, Xiaodong Liu, Tristan Naumann, Jianfeng Gao, and Hoifung Poon. Domain-specific lan- guage model pretraining for biomedical natural language processing. ACM Transactions on Computing for Health- care (HEALTH), 3(1):1-23, 2021.
- [Hadsell et al., 2006] Raia Hadsell, Sumit Chopra, and Yann LeCun. Dimensionality reduction by learning an invari- ant mapping. In 2006 IEEE Computer Society Conference on Computer Vision and Pattern Recognition (CVPR'06), volume 2, pages 1735-1742. IEEE, 2006.
- [Harary and Norman, 1960] Frank Harary and Robert Z Nor- man. Some properties of line digraphs. Rendiconti Del Circolo Matematico Di Palermo, 9(2):161-168, 1960.
- [Isakov et al., 2017] Ofer Isakov, Iris Dotan, and Shay Ben- Shachar. Machine learning-based gene prioritization iden- tifies novel candidate risk genes for inflammatory bowel disease. Inflammatory Bowel Diseases, 23(9):1516-1523, 2017.
- [Kim et al., 2022] Chan Yeong Kim, Seungbyn Baek, Junha Cha, Sunmo Yang, Eiru Kim, Edward M Marcotte, Traver Hart, and Insuk Lee. Humannet v3: an improved database of human gene networks for disease research. Nucleic Acids Research, 50(D1):D632-D639, 2022.
- [Kipf and Welling, 2016] Thomas N Kipf and Max Welling. Semi-supervised classification with graph convolutional networks. arXiv preprint arXiv:1609.02907, 2016.
- [Kishan et al., 2021] KC Kishan, Rui Li, Feng Cui, and Anne R Haake. Predicting biomedical interactions with higher-order graph convolutional networks. IEEE/ACM Transactions on Computational Biology and Bioinformat- ics, 19(2):676-687, 2021.
- [Lee et al., 2016] Lucy Lee, Manish Gupta, and Srikumar Sahasranaman. Immune checkpoint inhibitors: An intro- duction to the next-generation cancer immunotherapy. The Journal of Clinical Pharmacology, 56(2):157-169, 2016.
- [Li et al., 2023] Yang Li, Zihou Guo, Keqi Wang, Xin Gao, and Guohua Wang. End-to-end interpretable disease- gene association prediction. Briefings in Bioinformatics, 24(3):bbad118, 2023.
- [Liu et al., 2024] Jiali Liu, Luyao Ao, Wenjing Jia, Qixing Gong, Jiawen Cui, Jun Wang, Ying Yu, Chenghao Fu, Haobin Li, Jia Wei, et al. Gfpt2 controls immune evasion in egfr-mutated non-small cell lung cancer. 2024.
- [Luo et al., 2022] Renqian Luo, Liai Sun, Yingce Xia, Tao Qin, Sheng Zhang, Hoifung Poon, and Tie-Yan Liu. Biogpt: generative pre-trained transformer for biomedical text generation and mining. Briefings in Bioinformatics, 23(6):bbac409, 2022.
- [Manolio, 2010] Teri A Manolio. Genomewide association studies and assessment of the risk of disease. New England Journal of Medicine, 363(2):166-176, 2010.
- [Mastropietro et al., 2023] Andrea Mastropietro, Gianluca De Carlo, and Aris Anagnostopoulos. Xgdag: explain- able gene-disease associations via graph neural networks. Bioinformatics, 39(8):btad482, 2023.
- [Mémoli, 2011] Facundo Mémoli. Gromov-wasserstein dis- tances and the metric approach to object matching. Foun- dations of Computational Mathematics, 11(4):417-487, 2011.
- [Meng et al., 2024] Zhaohan Meng, Siwei Liu, Shangsong Liang, Bhautesh Jani, and Zaiqiao Meng. Heteroge- neous biomedical entity representation learning for gene- disease association prediction. Briefings in Bioinformatics, 25(5):bbae380, 2024.
- [Natarajan and Dhillon, 2014] Nagarajan Natarajan and In- derjit S Dhillon. Inductive matrix completion for predicting gene-disease associations. Bioinformatics, 30(12):i60-i68, 2014.
- [Ott et al., 2015] Jurg Ott, Jing Wang, and Suzanne M Leal. Genetic linkage analysis in the age of whole-genome se- quencing. Nature Reviews Genetics, 16(5):275-284, 2015.
- [Peyré et al., 2016] Gabriel Peyré, Marco Cuturi, and Justin Solomon. Gromov-wasserstein averaging of kernel and distance matrices. In International Conference on Ma- chine Learning, pages 2664-2672. PMLR, 2016.
- [Peyré et al., 2019] Gabriel Peyré, Marco Cuturi, et al. Com- putational optimal transport: With applications to data sci- ence. Foundations and Trends® in Machine Learning, 11(5-6):355-607, 2019.
- [Piñero et al., 2016] Janet Piñero, Àlex Bravo, Núria Queralt-Rosinach, Alba Gutiérrez-Sacristán, Jordi Deu- Pons, Emilio Centeno, Javier García-García, Ferran Sanz, and Laura I Furlong. Disgenet: a comprehensive plat- form integrating information on human disease-associated genes and variants. Nucleic Acids Research, page gkw943, 2016.
- [Piñero et al., 2020] Janet Piñero, Juan Manuel Ramírez- Anguita, Josep Saüch-Pitarch, Francesco Ronzano, Emilio Centeno, Ferran Sanz, and Laura I Furlong. The disgenet knowledge platform for disease genomics: 2019 update. Nucleic Acids Research, 48(D1):D845-D855, 2020.
- [Piñero et al., 2021] Janet Piñero, Josep Saüch, Ferran Sanz, and Laura I Furlong. The disgenet cytoscape app: Ex- ploring and visualizing disease genomics data. Compu- tational and Structural Biotechnology Journal, 19:2960- 2967, 2021.
- [Postow et al., 2018] Michael A Postow, Robert Sidlow, and Matthew D Hellmann. Immune-related adverse events as- sociated with immune checkpoint blockade. New England Journal of Medicine, 378(2):158-168, 2018.
- [Ramos-Casals et al., 2020] Manuel Ramos-Casals, Julie R Brahmer, Margaret K Callahan, Alejandra Flores-Chávez, Niamh Keegan, Munther A Khamashta, Olivier Lambotte, Xavier Mariette, Aleix Prat, and Maria E Suárez-Almazor. Immune-related adverse events of checkpoint inhibitors. Nature Reviews Disease Primers, 6(1):38, 2020.
- [Schriml et al., 2022] Lynn M Schriml, James B Munro, Mike Schor, Dustin Olley, Carrie McCracken, Victor Fe- lix, J Allen Baron, Rebecca Jackson, Susan M Bello, Cyn- thia Bearer, et al. The human disease ontology 2022 update. Nucleic Acids Research, 50(D1):D1255-D1261, 2022.
- [Si et al., 2024] Yuxuan Si, Zihan Huang, Zhengqing Fang, Zhouhang Yuan, Zhengxing Huang, Yingming Li, Ying Wei, Fei Wu, and Yu-Feng Yao. Global-local aware heterogeneous graph contrastive learning for multifaceted association prediction in mirna-gene-disease networks. Briefings in Bioinformatics, 25(5):bbae443, 2024.
- [Tran et al., 2020] Van Dinh Tran, Alessandro Sperduti, Rolf Backofen, and Fabrizio Costa. Heterogeneous networks integration for disease-gene prioritization with node ker- nels. Bioinformatics, 36(9):2649-2656, 2020.
- [Yasunaga et al., 2022] Michihiro Yasunaga, Jure Leskovec, and Percy Liang. Linkbert: Pretraining language models with document links. ArXiv Preprint ArXiv:2203.15827, 2022.
- [Zeng et al., 2019] Xiangxiang Zeng, Yinglai Lin, Yuying He, Linyuan Lü, Xiaoping Min, and Alfonso Rodríguez- Patón. Deep collaborative filtering for prediction of dis- ease genes. IEEE/ACM Transactions on Computational Biology and Bioinformatics, 17(5):1639-1647, 2019.
- [Zhou and Dong, 2025] Yiyi Zhou and Yuchao Dong. The prognostic value and immunotherapeutic characteristics of gfpt2 in pan-cancer. Combinatorial Chemistry & High Throughput Screening, 28(17):2989-3001, 2025.
References were extracted automatically from the PDF and may contain errors.
Full text extracted automatically from the PDF; figures, tables and equations may differ. The PDF is the version of record.
1 Introduction
Cancer remains a critical threat to global public health characterized by its substantial incidence and mortality. In recent years, the paradigm of cancer treatment has been revolutionized by immunotherapy, with Immune Checkpoint Inhibitors (ICIs) emerging as a representative modality [Lee et al., 2016]. With inhibitory pathways, most notably the PD-1/PD-L1 and CTLA-4 pathways, ICIs can restore cytotoxic T-cell activity and enable effective antitumor immune responses [Postow et al., 2018]. However, this systemic immune activation is frequently accompanied by immune dysregulation. A growing body of clinical observations indicate that ICIs administration can provoke inflammatory toxicity in diverse organ systems, collectively termed immune-related Adverse Events (irAEs), which represents a major limitation to both treatment adherence and patient prognosis [RamosCasals et al., 2020]. Identifying genes associated with irAEs can help to further explore the underlying mechanisms of irAE occurrence, which in turn facilitates the refinement of safer immunotherapy protocols. In this work, we treat irAEs as diseases, and accordingly formulate the task as a GeneDisease Associations (GDAs) prediction problem, aiming to determine whether a given gene is associated with a specific disease.
∗Corresponding author
GDAs prediction is an important yet challenging task. Conventional experimental methods, such as linkage analysis [Ott et al., 2015] and Genome-Wide Association Studies (GWAS) [Manolio, 2010], are often expensive and require time-consuming "wet-lab" validation when applied to a large scale gene sets. To address these issues, a range of computational methods have been proposed based on conventional machine learning techniques [Natarajan and Dhillon, 2014; Isakov et al., 2017; Zeng et al., 2019] and graph neural networks [Li et al., 2023; Si et al., 2024; Meng et al., 2024], among which graph neural network-based approaches have shown particularly encouraging performance. Despite these advances, most existing graph neural network-based methods overlook disease-disease and disease-gene associations that have not yet been observed but biologically plausible. In this study, we refer to such missing links as false-negative associations. Concretely, the disease-disease associations used in training are incomplete. For gene-disease associations, confirmed links are treated as positive pairs, whereas links without established evidence are typically viewed as negative pairs. We examine the number of associations reported in different public releases of the gene-disease database DisGeNet [Pi˜nero et al., 2016; Pi˜nero et al., 2020; Pi˜nero et al., 2021] (see Table 1) and found that, many "negative" pairs in earlier versions are subsequently validated as positive associations in later releases. This temporal evolution of knowledge underscores the limitation of static negative sampling and highlights the need for uncertainty-aware or noiserobust graph inference. To address these issues, we propose GDAs-OT, a novel GDAs prediction method based on optimal transport. Optimal Transport (OT) was originally formulated as the problem of transforming one probability distribution into another at minimal cost, providing a principled measure of the overall structural discrepancy between distributions [Peyr´e et al., 2019].
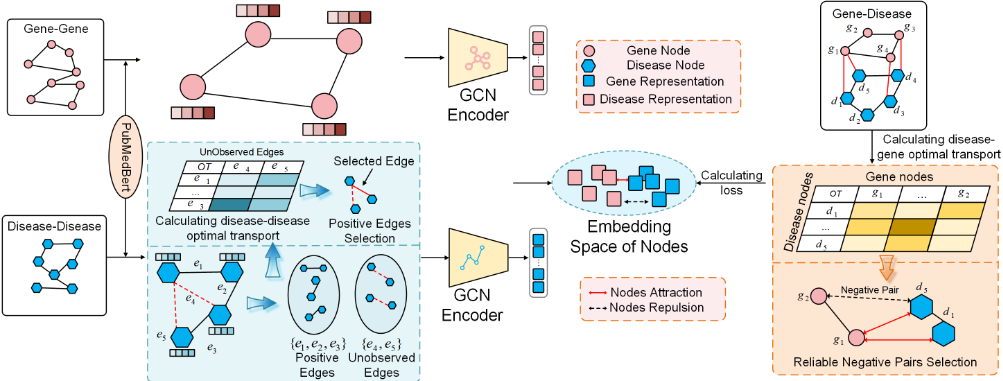
We construct a heterogeneous network comprising a disease-disease graph, a gene-gene graph, and a gene-disease graph using publicly available data, with node features initialized using pre-trained PubMedBERT [Gu et al., 2021], a domain-specific transformer-based model pre-trained on biomedical corpora. In the disease-disease graph, our goal is to identify previously unrecorded but potentially meaningful positive pairs to enrich the disease association structure. Inspired by line graph theory [Harary and Norman, 1960], we compute edge features by combining the features of the two endpoint nodes and categorize edges into positive edges (with observed links) and unobserved edges (links that are currently absent). We then formulate an OT problem, minimizing the Wasserstein distance [Peyr´e et al., 2019] between the distributions of observed and unobserved edge features. Unobserved edges that receive transport mass exceeding a predefined threshold are identified as latent positives and used to enrich the graph's topological structure.
For the gene-disease graph, the focus shifts to selecting the most reliable negative pairs from unobserved links in order to reduce data contamination. Specifically, we minimize the Gromov-Wasserstein (GW) discrepancy [Peyr´e et al., 2016] to obtain an OT matrix between disease and gene nodes, and treat node pairs with the smallest transport mass as negative samples. After refining both the disease-disease and genedisease graphs, we map nodes from the disease-disease graph and the gene-gene graph into a shared embedding space using separate Graph Convolutional Network (GCN) encoders [Kipf and Welling, 2016]. Guided by the gene-disease relations, the learned embeddings pull positive gene-disease pairs closer while pushing negative pairs farther apart. Finally, the optimized node representations are fed into a multilayer perceptron (MLP) to produce the final GDA predictions.
We benchmark GDAs-OT against six state-of-the-art (SOTA) models for Gene-Disease Association tasks. Our framework achieves superior performance across all primary evaluation metrics, including Accuracy, AUC, F1-score, and AUPR. Ablation studies further confirm the contribution of each component in the framework. In addition, we curate several common irAEs and treat them as diseases, then use the trained GDAs-OT model to identify genes most strongly associated with each irAE. Existing evidence supports the reliability of the genes prioritized by GDAs-OT, and the model also highlights several potentially relevant genes that have not yet been reported, with meaningful implications for cancer immunotherapy. Our contributions can be concluded as:
| DisGeNet version | GDAs |
|---|---|
| V 4.0 | 429,036 |
| V 6.0 | 628,685 |
| V 7.0 | 1,134,924 |
- We proposed GDAs-OT, a novel prediction method of GDAs based on optimal transport for identifying genes related to immune-related adverse events, which was benchmarked against SOTA models, achieving the best performance.
- We partitioned edges in the disease-disease graph into observed positive edges and unobserved edges, learn an optimal transport plan by minimizing the Wasserstein distance, and use the resulting transport mass to augment the graph with high-confidence potential positive edges, for better capturing disease structural relationships.
- We learned an optimal transport matrix between disease nodes and gene nodes by minimizing the GromovWasserstein discrepancy, and leveraged it to construct a high-confidence set of negative pairs. These negatives guide representation learning in the embedding space and effectively mitigate performance degradation due to label noise and data contamination.
- We curateed several common irAEs as diseases and used GDAs-OT to prioritized associated genes, including plausible candidate genes that have not yet been reported, offering new directions for downstream biological investigation and cancer immunotherapy research.
2 RelatedWork
In the early stages, exploring the relationship between genes and diseases was more regarded as a priority ranking problem of disease genes. Specifically, given a set of known disease-associated genes and a set of candidate genes for a particular genetic disease, the objective of disease gene prioritization is to rank the candidate genes according to their potential relevance to the disease [Tran et al., 2020]. For example, [Natarajan and Dhillon, 2014] used the matrix completion method to integrate the features of multiple datasets to predict GDAs. [Isakov et al., 2017] proposed a machine learning-based gene priority ranking algorithm to infer risk genes for Inflammatory Bowel Disease (IBD). And [Tran et al., 2020] constructed a heterogeneous graph to fit a regularized linear SVM, thereby solving the gene priority ranking problem. XGDAG [Mastropietro et al., 2023] utilized a Markov process with restart to assign pseudo labels to unknown disease genes, and then used the filtered data to train GraphSAGE to achieve the ranking of candidate genes.
Recently, with the development of graph neural networks and the generation of a large amount of disease and gene data, exploring the relationship between genes and diseases has gradually been regarded as a link prediction problem. Specifically, it involves inferring the relationship between disease nodes and gene nodes. HOGCN [Kishan et al., 2021] implemented a GCN method that integrates high-order neighborhood information. Compared to only considering neighbor information, HOGCN achieved better results in GDAs prediction. GlaHGCL [Si et al., 2024] integrates miRNA, disease and gene data, combines global and local contrastive learning, and optimizes node embeddings in heterogeneous graphs for GDAs prediction. FusionGDA [Meng et al., 2024] proposed to use a pre-trained model to fuse protein sequences and disease descriptions to improve prediction performance.
3 Methodology
3.1 Preliminary
Biomedical Pre-Trained Language Models
These models are pre-trained on extensive biomedical datasets, enabling them to learn rich semantic representations from gene and disease texts. Once pre-training is completed, the models can be directly applied to obtain text embeddings. We compared BioGPT [Luo et al., 2022], LinkBERT [Yasunaga et al., 2022], and PubMedBERT in our experiments, and PubMedBERT was selected due to its superior performance. See the Supplementary Material Section 1 for details.
Graph Convolutional Network
GCN is a learning model for graph-structured data that learns node representations by aggregating information from neighboring nodes. Given a graph G(V,E), where V , E denote the sets of nodes and edges, respectively, let A[Aij]n×n be the adjacency matrix. If there exists an edge between node i, j, then Aij = 1; otherwise, Aij = 0. For the l - th layer, the node feature representation Hl is updated by aggregating features from the node itself and its first-order neighbors, yielding the (l +1)-th layer representation Hl+1 as follow:
where ˜ A = A + I denotes the adjacency matrix with added self-loops, ˜D is the corresponding degree matrix, W l represents the trainable parameters of the l - th layer, and σ(·) is a nonlinear activation function.
3.2 Data Preprocessing
To construct the gene-gene graph, disease-disease graph, and gene-disease graph required by GDAs-OT, we integrated data resources from multiple authoritative biomedical databases. Specifically, the associations between diseases and their textual descriptions originated from the Disease Ontology (DO) database [Schriml et al., 2022]. The relationships between genes originated from the HumanNet database [Kim et al., 2022], the functional description information of genes came from the Gene Ontology (GO) database [Ashburner et al., 2000], and the GDAs data were taken from the DisGeNet database [Pi˜nero et al., 2021]. Considering the differences in naming conventions and data coverage among different databases, certain filtering was performed. Based on disease names and UMLS Concept Unique Identifiers (CUIs), diseases in DisGeNet that were not present in DO were excluded. According to gene names, the gene associations that did not exist in HumanNet or GO in DisGeNet were also excluded. The processed data constitute the final dataset used in this paper's experiments. See Table 2.
| Dataset | Nodes | Associations |
|---|---|---|
| DO | 11,985 | 16,873 |
| HumanNet | 17,986 | 1,088,337 |
| DisGeNet | 20,462 | 505,364 |
After completing data preprocessing, we construct genegene graph Gg = G(V g ,Eg ) and disease-disease graph Gd = G(V d ,Ed ). Here, V g = {vg 1 , . . . , vg η } and V d = {vd 1 , . . . , vd ξ } denote the sets of gene nodes and disease nodes, respectively, while Eg and Ed represent the corresponding edge sets. Node features are initialized from textual descriptions of genes and diseases, which are encoded using the medical pre-trained model PubMedBERT. For any node v ∈ V , its feature representation is denoted as xv ∈ Rl . The feature matrix of all nodes is given by X ∈ R|V |×l .
3.3 Disease-Disease Graph Structure Expansion via Optimal Transport
In the disease graph Gd , to alleviate the false negative edge issue, we formulate the problem as an OT task between positive edges and unobserved edges defined on the same metric measure space. Specifically, positive edges are treated as the source distribution, while unobserved edges serve as the target distribution. By solving the minimization problem associated with the Wasserstein distance, we obtain an edge-level OT matrix, which is then used to structure the graph structure with potential positive associations. The set of positive edges consists of known disease-disease relationships. For node pairs that are not directly connected in the graph, we regard them as unobserved edges. Since the number of unobserved edges can be extremely large, we limit their scale by keeping only the five closest neighbors for each node according to cosine similarity of node features. Following the idea of line graph, we convert edges into nodes and derive edge representations accordingly. Let U = {ui|ei ∈ E} denote the set of edge features. For an edge ei = (vdw , vd v ∈ E), its feature is obtained by concatenating the features of its two endpoint nodes, which can be written as ui = [xdw , xdv ] ∈ R2d . We then divide U into a positive edge feature set U s ⊂ U and an unobserved edge feature set U t ⊂ U. Let the edge cost ma-
trix be denoted as C = [cij]m×n, where cij = 1- ui⊤·uj ||ui ||2||uj ||2 represents the cost of transporting unit mass from the i - th positive edge to the j - th unobserved edge. Here, m and n denote the numbers of edges in U s and U t , respectively. In the absence of prior knowledge, we assume a uniform mass distribution over edges, leading to the distributions on positive edges and unobserved edges as ps = 1m 1m, pt = 1n 1n. The Wasserstein distance between U s and U t is formulated as
Algorithm 1 Expansion of disease-disease graph structure
Input: G(V d ,Ed ), U s , U t , m = |U s |, threshold hyperparameter β.
Output: ˜G(V d , ˜Ed ).
- 1: Calculate the cost matrix C.
- 2: Initialize ˜Ed ←Ed .
- 3: Obtain T ∗ by solving Eq.(3).
- 4: Calculate τw ←min(1, 1 βm ).
- 5: for each unlabeled edge ej ∈ U t do
- 6: if maxi T ∗ ij > τw then
- 7: ˜Ed ← ˜Ed ∪ {ej}.
- 8: end if
- 9: end for
- 10: return ˜Gd (V d , ˜Ed ).
graph. These negative pairs will guide the representation learning process. Since this is an OT problem for two different metric measure spaces, we consider solving the OT matrix between genes and diseases by minimizing the GW discrepancy. The GW discrepancy can be viewed as a natural extension of the GW distance and is more suitable for machine learning applications [Peyr´e et al., 2016]. The dissimilarity between each internal node within a distribution is used to characterize the respective graph structure, thereby achieving the optimal structural alignment between two different metric measure spaces without relying on the comparability of crossdomain features. For Gg and ˜Gd , the intra-graph dissimilarity matrices are denoted as C g = [cgij ]η×η and C d = [cdi′ j ′ ]ξ×ξ,
mass of both gene and disease nodes are assumed to follow uniform distributions, i.e., pg = 1 η 1η, pd = 1ξ 1ξ. Following the common practice [M´emoli, 2011], we define the metric
where T = [Tij]m×n is the transport matrix. Each Tij corresponds to the amount of mass transported from a positive edge ei ∈ U s to an unobserved edge ej ∈ U t . < ·, · > denotes the inner product between matrices. ∏(ps, pt) = {T ∈ Rm×n |T 1n = ps, T ⊤1m = pt}.
This problem can be solved using the Sinkhorn-Knopp algorithm [Cuturi, 2013]. We consider the entropy regularization form of Eq.(2):
OT matrix T ∗ is calculated as
where diag(·) converts a vector to a diagonal matrix, K = exp (- Cλ ), λ = 0.1 is the regularization coefficient. Entropy regularization term H(T) = - ∑i,j Tij logTij. a ∈ Rm, b ∈ Rn is calculated through Sinkhorn iterations:
Thus, potential positive pairs in the unobserved edges is defined as an edge that receives the maximum transported mass from positive edges in the OT solution and whose value exceeds the threshold τw =min(1, 1 βm ), where β is a threshold weight. Specifically, for any ej ∈ U t , if maxi T ∗ ij > τw, it is treated as a positive pair. The disease-disease graph after edge completion is denoted as ˜Gd = ˜G(V d , ˜Ed ), with ˜Ed being the expanded set of positive disease-disease edges. The pseudo-code is given in Algorithm 1.
3.4 Negative Pairs Selection for the Gene-Disease Graph via Optimal Transport
Before conducting node representation learning, we need to select reliable negative pairs from the existing gene-disease measure spaces of Gg and ˜Gd as (C g , pg) ∈ Rη×η × ∑η and (C d , pd) ∈ Rξ×ξ × ∑ξ . The GW discrepancy between (C g , pg) and (C d , pd) is defined as
where ∏ (pg, pd) = ¯ T ∈ Rη×ξ | ¯ T1ξ = pg, ¯ T ⊤1η = pd}. ¯ T denotes the gene-disease transport matrix, and ¯ Tij represents the transported mass from gene node vi ∈ V g to disease node vj ∈ V d . L(C g ,C d , ¯ T) = [Ljj ′ ] ∈ R|V g |×|V d | and each Ljj ′ = ∑i,i′ L(cgij , cdi′ j ′) ¯ Tii′ , L(·, ·). The GW discrepancy allows flexible choices of loss functions, such as the squared loss L(a, b) = 12 |a - b|2 or the Kullback-Leibler divergence L(a, b) = a log ab - a + b. After experimental analysis(see Supplementary Material Section 2), we adopt the squared loss in this work.
To efficiently solve Eq.(6), we introduce an entropic regularization term and reformulate it as
Following the method proposed by [Peyr´e et al., 2016], this non-convex optimization problem is solved using projected gradient descent. At the M- th outer iteration, given the current transport matrix T (M) , we compute
where Cκ = f1(C g )pg1⊤ξ + 1η(pd )⊤f2(C d )⊤. When loss function is set as the square loss, f1(k) = k2 , f2(l) = l2 , h1(k) = k and h2(l) = 2l. Accordingly, the transport matrix at the (M+ 1) - th iteration is obtained by
It is easy to see that Eq.(9) can still be efficiently solved using the Sinkhorn-Knopp algorithm. Its closed-form solution is
where ¯K(M) = exp ( -L(Cg ,Cd , ¯ T (M) ) λ ), a and b are computed according to Eq.(5). The outer iterations are repeated until convergence or until the maximum number of iterations (set to 50) is reached, yielding the OT matrix ¯ T ∗ . Based on ¯ T ∗ , gene-disease pairs with the smallest transported mass are regarded as reliable negative pairs. To alleviate class imbalance, the number of selected negative pairs is set equal to that of positive pairs. The pseudo-code is given in Algorithm 2.
3.5 Node Representation Learning
According to the computation in Eq.(1), the nodes in graphs Gg and ˜Gd are respectively passed through two GCN encoders, and their node embeddings can be expressed as
Algorithm 2 Negative gene-disease pairs selection
Input:G(V g ,Eg ), ˜G(V d , ˜Ed ), pg, pd, λ, node features Xg ,Xd , max iterationsMmax.
Output: Negative gene-disease pairs E -.
- 1: Compute matrices C g ,C d and ¯ T (0) = pgpd T .
- 2: forM= 0 toMmax -1 do
- 3: Calculate L(C g ,C d , ¯ T (M) ) via Eq.(8).
- 4: L←L(C g ,C d , ¯ T (M) ).
- 5: ¯K ← exp(-L/λ).
- 6: Update optimal transport ¯ T (M+1) via Eq.(9).
- 7: end for
- 8: ¯ T ∗ ← ¯ T (Mmax) .
- 9: E - ← gene-disease pairs with smallest transport mass, |E -| = |E +|.
10: return E -
where Z g = [zg 1 , . . . , z g η ]⊤ and Z d = [zd 1 , . . . , z d ξ ]⊤, Xg and Xd denote the node feature matrices of genes and diseases, respectively. Ag and Ad are the corresponding adjacency matrices with self-loops. W g and W d are learnable parameters. We define the set of positive gene-disease pairs as ε+ = {(vg i , vd j )|Ahij = 1} and the set of negative pairs as ε- ⊂ {(vg i , vd j )|Ahij = 0}, Ah denotes the adjacency matrix of the gene-disease graph. The negative set ε- is constructed by selecting node pairs that receive the smallest transport mass in ¯ T, with the constraint |ε+| = |ε-|. Following the strategy in [Hadsell et al., 2006], the objective of node representation learning is to optimize W g and W d so that embeddings of connected node pairs are close in the embedding space, while embeddings of unconnected pairs are well separated. The objective function can be expressed as
where zg i and zd j are the embeddings of nodes vg i and vg j , respectively. The hyperparameter α balances the attraction of positive pairs and the repulsion of negative pairs, while γ > 0 is a margin that activates a penalty only when the distance between a negative pair falls below this threshold, thereby preventing representation collapse. The overall pipeline is shown in Figure 1.
3.6 Gene-Disease Associations Prediction
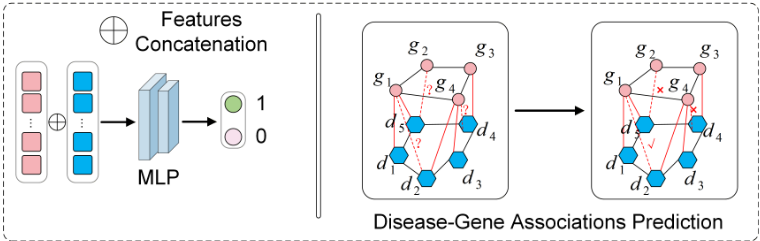
Here, the learned embeddings of gene nodes and disease nodes are denoted as ˜ Z g and ˜ Z d , respectively. For a given gene-disease node pair (vg i , vd j ), we obtain its joint representation by concatenating the corresponding node embeddings: ˜ zij = [˜ zg i , ˜ zd j ]. Each positive gene-disease pair is assigned a label y = 1, whereas each negative pair is assigned y = 0. We then employ a MLP as the classifier to distinguish between associated and non-associated gene-disease pairs (see Figure 2). Specifically, the concatenated representation ˜ zij is fed into the MLP to produce a prediction score: ˆ yij = σ(fMLP (˜ zij )). Let D denote the training set consisting of both positive and negative gene-disease pairs, with corresponding labels yij ∈ {0, 1}. The classification loss is defined as
| Method | Precision | F1-score | Recall |
|---|---|---|---|
| XGDAG | 95.60% | 95.80% | 96.20% |
| GDAs-OT(ours) | 96.45% | 97.52% | 98.87% |
4 Experiments and Results
4.1 Implementation Details
In GDAs-OT, we design two separate GCN encoders for the gene-gene graph and the disease-disease graph to learn node representations. Each encoder consists of a single GCN layer, with an input feature dimension of 768 and an output embedding dimension of 96. For GDAs prediction, we use an MLP composed of two Linear layers. The input dimension of the MLP is 96, and the output dimension is 2, corresponding to the binary classification task. The numbers of training epochs for the GCN encoders and the MLP are determined based on empirical analysis. The loss curves under different training epochs are shown in Supplementary Material Figure 3. According to the experimental results, the numbers of epochs are finally set to 20 for the GCN encoders and 15 for the MLP, respectively. All experiments were conducted on a server equipped with four NVIDIA A100 GPUs (80GB memory each) and an Intel Xeon Gold 6248R CPU.
4.2 Comparative Methods
To evaluate the effectiveness of GDAs-OT, we compare it with several recent approaches for GDAs prediction, including HOGCN, DGP-PGTN [Li et al., 2023], XGDAG, FusionGDA, GlaHGCL, and PhenoLinker [Andreu et al., 2025]. All comparative methods are implemented using the parameter settings reported in their original papers. Specifically, for comparison with XGDAG, we follow the original experimental configuration, use a subset of the DisGeNet dataset and select the same ten disease-related nodes as those used in the XGDAG experiments. This dataset contains a total of 3,208 gene and disease nodes and 4,302 association edges. In addition, since XGDAG formulates the task as a multi-class classification problem, we report Precision, Recall, and F1-score for the Positive class only to ensure a fair comparison. (see Table 3).
For the remaining comparison experiments, all methods were evaluated on the same dataset and under identical experimental settings. To maintain class balance, we randomly sampled 10,000 associated pairs and 10,000 non-associated pairs from the DisGeNet database as positive and negative samples for the binary classification task. The dataset was split into training and test sets with a ratio of 8:2, and all methods were assessed using the same evaluation metrics, including Accuracy, F1-score, Area Under the ROC Curve (AUC), and Area Under the Precision-Recall Curve (AUPR). All experiments randomly sampled samples from the DisGeNet dataset using 5 different seeds. The results are presented as the mean ± standard deviation. As shown in Table 4, GDAs-OT outperforms the competing methods across all evaluation metrics. In particular, Accuracy and F1-score are improved by more than 4%, while AUC and AUPR exhibit gains of nearly 2% and over 2%, respectively. These results indicate that GDAs-OT achieves superior overall predictive performance compared with existing approaches.
4.3 Ablation Experiment
To examine the contribution of different modules in GDAsOT, we conducted an ablation study. Specifically, we designed three model variants as follows. 1) The disease graph is used without structural expansion. 2) Based on the transport matrix ¯ T ∗ , select the gene-disease pair with the highest transport mass from the unassociated pairs as negative pairs. 3) Node representations for the gene-gene graph and diseasedisease graph are obtained directly from GCN encoders, without the subsequent node representation learning module.
These three variants are referred to as GDAs-OT(a), GDAs-OT(b), and GDAs-OT(c), respectively. The experimental results are reported in Table 5. Compared with the full model, all variants exhibit performance degradation to varying extents. Among them, GDAs-OT(b) shows a substantial drop across evaluation metrics, indicating that the proposed negative sample selection strategy based on the OT matrix plays a crucial role in model performance.
| Method | Accuracy | F1-score | AUC | AUPR |
|---|---|---|---|---|
| HOGCN | 71.53%±1.89% | 77.28%±0.43% | 86.13%±0.32% | 88.65%±0.14% |
| DGP-PGTN | 84.80%±1.36% | 83.87%±3.11% | 94.07%±1.94% | 93.54%±3.51% |
| GlaHGCL | 87.95%±0.85% | 87.94%±0.62% | 94.45%±0.40% | 94.56%±0.53% |
| FusionGDA | 90.06%±0.61% | 90.63%±0.12% | 96.32%±0.16% | 95.87%±0.09% |
| PhenoLinker | 90.39%±0.45% | 90.66%±0.79% | 96.81%±0.17% | 96.16%±0.25% |
| GDAs-OT(ours) | 95.09%±0.21% | 95.10%±0.20% | 98.47%±0.16% | 98.55%±0.17% |
| Method | Accuracy | F1-score | AUC | AUPR |
|---|---|---|---|---|
| GDAs-OT(a) | 94.15% | 94.03% | 97.84% | 97.92% |
| GDAs-OT(b) | 83.65% | 83.61% | 90.49% | 90.04% |
| GDAs-OT(c) | 93.85% | 93.62% | 97.59% | 97.88% |
| GDAs-OT | 95.09% | 95.10% | 98.47% | 98.55% |
4.4 Parameter Sensitivity Analysis
In this section, we adopted 5-fold cross-validation on the training set to identify the optimal hyperparameter configuration. The final performance was reported as the average over the five runs. For all hyperparameters in the GDAs-OT model, we predefined candidate search ranges. The learning rate was selected from {0.0001, 0.001, 0.005, 0.007, 0.01}, α ∈ {0.1, 0.5, 1, 3, 5, 10}, β ∈ {1, 5, 7, 10, 50, 100} and the margin parameter γ ∈ {1, 5, 7, 10, 50, 100}. The crossvalidation results under different hyperparameter settings are shown in Supplementary Material Figure 4. The results indicate that excessively large or small values of lr, β and γ lead to a noticeable drop in accuracy. Interestingly, the model performance shows a negative correlation with the parameter α. A possible explanation is that overly large values of α place too much emphasis on separating negative pairs, which weakens the constraint that pulls positive pairs closer in the embedding space and ultimately degrades overall performance. Based on these observations, we set the final hyperparameters to lr = 0.001, α = 0.1, β = 5 and γ = 3.
4.5 Identify Genes Related to IrAEs
We selected three common types of irAEs from the existing research data [Ramos-Casals et al., 2020] for analysis: Psoriasis, Myasthenia gravis, and Guillain-Barre syndrome. All three irAEs were treated as diseases. We used all observed gene-disease pairs and an equal number of negative pairs to train GDAs-OT. After training, the model was applied to estimate association confidence scores between genes and each of the three irAEs. For each irAE, genes with confidence scores greater than 0.99 and ranked within the top-5 were selected as potential associated genes. The identified genes are listed in Table 6, where "Reported" indicates that the corresponding GDAs has been documented in the Dis- GeNet database. The results show that most genes identified by GDAs-OT have already been reported in DisGeNet, suggesting that the proposed method is effective in identifying disease-related genes. Notably, GDAs-OT also revealed novel GDAs absent from existing databases, including potential associations between psoriasis and NHSL1 and GFPT2, as well as between myasthenia gravis and SLC22A13 and PTBP3. Furthermore, recent studies have reported that GFPT2 is closely involved in immune-related functions such as immune cell infiltration and immune regulatory processes [Liu et al., 2024; Zhou and Dong, 2025].
| Disease name | Related gene | Reported |
|---|---|---|
| Psoriasis | SPATA2 ZFYVE16 SCRN1 NHSL1 GFPT2 | True True True False False |
| Myasthenia gravis | FHDC1 SCO2 HIF3A SLC22A13 PTBP3 | True True True False False |
| Guillain-Barre syndrome | CDC42 HSPD1 ENO2 NOD2 GLO1 | True True True True True |
5 Conclusion
In this work, we propose a GDAs prediction method based on optimal transport. By leveraging optimal transport, the proposed method identifies potential associations in the diseasedisease graph and reliable negative associations in the genedisease graph, thereby addressing a key limitation of existing graph-based methods that overlook false negative associations. Comparative experiments with several recent methods demonstrate that our approach consistently achieves superior performance across all evaluation metrics. In future work, we plan to further validate the irAEs-associated genes identified by our model through biological experiments, in order to assess their biological plausibility.
Acknowledgments
This work was supported by the National Natural Science Foundation of China (Grant No. 62462022, Grant No. 62572157).
@inproceedings{ijcai2026p623,
  title     = {GDAs-OT: A Prediction Method of Gene-Disease Associations Based on Optimal Transport for Identifying Genes Related to Immune-Related Adverse Events},
  author    = {Liu, Ruhao and Wang, Suixue and Yu, Hang and Li, Peng and Zhang, Qingchen},
  booktitle = {Proceedings of the Thirty-Fifth International Joint Conference on
               Artificial Intelligence, {IJCAI-26}},
  publisher = {International Joint Conferences on Artificial Intelligence Organization},
  editor    = {Diego Calvanese},
  pages     = {5594--5602},
  year      = {2026},
  month     = {8},
  note      = {Main Track},
  doi       = {10.24963/ijcai.2026/623},
  url       = {https://doi.org/10.24963/ijcai.2026/623},
}
TY - CPAPER TI - GDAs-OT: A Prediction Method of Gene-Disease Associations Based on Optimal Transport for Identifying Genes Related to Immune-Related Adverse Events AU - Liu, Ruhao AU - Wang, Suixue AU - Yu, Hang AU - Li, Peng AU - Zhang, Qingchen T2 - Proceedings of the Thirty-Fifth International Joint Conference on Artificial Intelligence, IJCAI-26 PB - International Joint Conferences on Artificial Intelligence Organization PY - 2026 SP - 5594 EP - 5602 DO - 10.24963/ijcai.2026/623 UR - https://doi.org/10.24963/ijcai.2026/623 ER -Copied
Machine-readable versions of this paper, for tools and AI agents:





