
Local Geometry Improves Explanation Robustness for Graph Neural Networks
Proceedings of the Thirty-Fifth International Joint Conference on Artificial Intelligence. Main Track. Pages 544-552.
https://doi.org/10.24963/ijcai.2026/62
Keywords
- Data Mining: Mining graphs
- AI Ethics, Trust, Fairnes: Explainability and interpretability
Abstract
Graph Neural Networks (GNNs) are widely used in high-stakes decision-making, where explanation robustness is crucial. Yet, even minor structural perturbations can drastically change explanations without changing predictions. Existing methods primarily characterize structural perturbations by their edit distance or budget, and enforce robustness through uniform constraints or averaging mechanisms over this perturbation set, which fail to capture the inherently direction-dependent effects of structural changes.
In this paper, we propose GeoXGNN (Local Geometry Improves Explanation Robustness for Graph Neural Networks), a robust explanation framework that explicitly models the directional sensitivity of structural perturbations from a geometric perspective. GeoXGNN introduces local, direction-aware metrics in the node representation space to characterize how perturbations along different directions affect node embeddings and explanation outcomes. Based on the learned local metrics, GeoXGNN further enforces directional constraints, encouraging explanations to remain robust along high-sensitivity directions while preserving explanatory fidelity.
Extensive experiments on multiple node-level and graph-level benchmark datasets demonstrate that GeoXGNN significantly improves explanation robustness over existing methods.
- [Agarwal et al., 2023] Chirag Agarwal, Owen Queen, Himabindu Lakkaraju, and Marinka Zitnik. Evaluating explainability for graph neural networks. Scientific Data, 10(1):144, 2023.
- [Bajaj et al., 2021] Mohit Bajaj, Lingyang Chu, Zi Yu Xue, Jian Pei, Lanjun Wang, Peter Cho-Ho Lam, and Yong Zhang. Robust counterfactual explanations on graph neu- ral networks. Advances in neural information processing systems, 34:5644-5655, 2021.
- [Borgwardt et al., 2005] Karsten M Borgwardt, Cheng Soon Ong, Stefan Schönauer, SVN Vishwanathan, Alex J Smola, and Hans-Peter Kriegel. Protein function predic- tion via graph kernels. Bioinformatics, 21(suppl 1):i47- i56, 2005.
- [Chen et al., 2019] Jiefeng Chen, Xi Wu, Vaibhav Rastogi, Yingyu Liang, and Somesh Jha. Robust attribution regu- larization. In Hanna M. Wallach, Hugo Larochelle, Alina Beygelzimer, Florence d'Alché-Buc, Emily B. Fox, and Roman Garnett, editors, Advances in Neural Informa- tion Processing Systems 32: Annual Conference on Neu- ral Information Processing Systems 2019, NeurIPS 2019, December 8-14, 2019, Vancouver, BC, Canada, pages 14300-14310, 2019.
- [Dombrowski et al., 2019] Ann-Kathrin Dombrowski, Max- imilian Alber, Christopher J. Anders, Marcel Ackermann, Klaus-Robert Müller, and Pan Kessel. Explanations can be manipulated and geometry is to blame. In Hanna M. Wallach, Hugo Larochelle, Alina Beygelzimer, Florence d'Alché-Buc, Emily B. Fox, and Roman Garnett, editors, Advances in Neural Information Processing Systems 32: Annual Conference on Neural Information Processing Sys- tems 2019, NeurIPS 2019, December 8-14, 2019, Vancou- ver, BC, Canada, pages 13567-13578, 2019.
- [Giles et al., 1998] C Lee Giles, Kurt D Bollacker, and Steve Lawrence. Citeseer: An automatic citation indexing sys- tem. In Proceedings of the third ACM conference on Dig- ital libraries, pages 89-98, 1998.
- [Kipf and Welling, 2017] Thomas N. Kipf and Max Welling. Semi-supervised classification with graph convolutional networks. In 5th International Conference on Learning Representations, ICLR 2017, Toulon, France, April 24-26, 2017, Conference Track Proceedings. OpenReview.net, 2017.
- [Lakkaraju and Bastani, 2020] Himabindu Lakkaraju and Osbert Bastani. "how do I fool you?": Manipulating user trust via misleading black box explanations. In Annette N. Markham, Julia Powles, Toby Walsh, and Anne L. Wash- ington, editors, AIES '20: AAAI/ACM Conference on AI, Ethics, and Society, New York, NY, USA, February 7-8, 2020, pages 79-85. ACM, 2020.
- [Li et al., 2024] Jiate Li, Meng Pang, Yun Dong, Jinyuan Jia, and Binghui Wang. Graph neural network explanations are fragile. In Forty-first International Conference on Machine Learning, ICML 2024, Vienna, Austria, July 21-27, 2024. OpenReview.net, 2024.
- [Li et al., 2025] Jiate Li, Meng Pang, Yun Dong, Jinyuan Jia, and Binghui Wang. Provably robust explainable graph neural networks against graph perturbation attacks. In The Thirteenth International Conference on Learning Rep- resentations, ICLR 2025, Singapore, April 24-28, 2025. OpenReview.net, 2025.
- [Liu and Xie, 2025] Yazheng Liu and Sihong Xie. Expla- nations of GNN on evolving graphs via axiomatic layer edges. In The Thirteenth International Conference on Learning Representations, ICLR 2025, Singapore, April 24-28, 2025. OpenReview.net, 2025.
- [Liu et al., 2025] Yazheng Liu, Xi Zhang, Sihong Xie, and Hui Xiong. Robust explanations of graph neural networks via graph curvatures. In The Thirty-ninth Annual Confer- ence on Neural Information Processing Systems, 2025.
- [Luo et al., 2020] Dongsheng Luo, Wei Cheng, Dongkuan Xu, Wenchao Yu, Bo Zong, Haifeng Chen, and Xiang Zhang. Parameterized explainer for graph neural network. In Hugo Larochelle, Marc'Aurelio Ranzato, Raia Hadsell, Maria-Florina Balcan, and Hsuan-Tien Lin, editors, Ad- vances in Neural Information Processing Systems 33: An- nual Conference on Neural Information Processing Sys- tems 2020, NeurIPS 2020, December 6-12, 2020, virtual, 2020.
- [Magister et al., 2021] Lucie Charlotte Magister, Dmitry Kazhdan, Vikash Singh, and Pietro Liò. Gcexplainer: Human-in-the-loop concept-based explanations for graph neural networks. CoRR, abs/2107.11889, 2021.
- [McCallum et al., 2000] Andrew Kachites McCallum, Ka- mal Nigam, Jason Rennie, and Kristie Seymore. Automat- ing the construction of internet portals with machine learn- ing. Information Retrieval, 3(2):127-163, 2000.
- [Morris et al., 2020] Christopher Morris, Nils M Kriege, Franka Bause, Kristian Kersting, Petra Mutzel, and Mar- ion Neumann. Tudataset: A collection of bench- mark datasets for learning with graphs. arXiv preprint arXiv:2007.08663, 2020.
- [Schnake et al., 2022] Thomas Schnake, Oliver Eberle, Jonas Lederer, Shinichi Nakajima, Kristof T. Schutt, Klaus-Robert Muller, and Gregoire Montavon. Higher- order explanations of graph neural networks via relevant walks. IEEE Transactions on Pattern Analysis and Machine Intelligence, 44(11):7581-7596, November 2022.
- [Sen et al., 2008] Prithviraj Sen, Galileo Namata, Mustafa Bilgic, Lise Getoor, Brian Galligher, and Tina Eliassi-Rad. Collective classification in network data. AI magazine, 29(3):93-93, 2008.
- [Shin et al., 2024] Yong-Min Shin, Sun-Woo Kim, and Won- Yong Shin. PAGE: prototype-based model-level explana- tions for graph neural networks. IEEE Trans. Pattern Anal. Mach. Intell., 46(10):6559-6576, 2024.
- [Sun et al., 2026] Li Sun, Zhenhao Huang, Silei Chen, Lanxu Yang, Junda Ye, Sen Su, and Philip S. Yu. Multi- domain riemannian graph gluing for building graph foun- dation models, 2026.
- [Tan and Tian, 2023] Zeren Tan and Yang Tian. Robust ex- planation for free or at the cost of faithfulness. In An- dreas Krause, Emma Brunskill, Kyunghyun Cho, Barbara Engelhardt, Sivan Sabato, and Jonathan Scarlett, editors, International Conference on Machine Learning, ICML 2023, 23-29 July 2023, Honolulu, Hawaii, USA, volume 202 of Proceedings of Machine Learning Research, pages 33534-33562. PMLR, 2023.
- [Tron et al., 2024] Eliot Tron, Rita Fioresi, Nicolas Couel- lan, and Stéphane Puechmorel. Cartan moving frames and the data manifolds. CoRR, abs/2409.12057, 2024.
- [Wale et al., 2008] Nikil Wale, Ian A. Watson, and George Karypis. Comparison of descriptor spaces for chemical compound retrieval and classification. Knowl. Inf. Syst., 14(3):347-375, 2008.
- [Wang and Shen, 2023] Xiaoqi Wang and Han-Wei Shen. Gnninterpreter: A probabilistic generative model-level ex- planation for graph neural networks. In The Eleventh Inter- national Conference on Learning Representations, ICLR 2023, Kigali, Rwanda, May 1-5, 2023. OpenReview.net, 2023.
- [Wang et al., 2021] Xiang Wang, Ying-Xin Wu, An Zhang, Xiangnan He, and Tat-Seng Chua. Towards multi-grained explainability for graph neural networks. In Marc'Aurelio Ranzato, Alina Beygelzimer, Yann N. Dauphin, Percy Liang, and Jennifer Wortman Vaughan, editors, Advances in Neural Information Processing Systems 34: Annual Conference on Neural Information Processing Systems 2021, NeurIPS 2021, December 6-14, 2021, virtual, pages 18446-18458, 2021.
- [Wang et al., 2023a] Senzhang Wang, Jun Yin, Chaozhuo Li, Xing Xie, and Jianxin Wang. V-infor: A robust graph neu- ral networks explainer for structurally corrupted graphs. In Alice Oh, Tristan Naumann, Amir Globerson, Kate Saenko, Moritz Hardt, and Sergey Levine, editors, An- nual Conference on Neural Information Processing Sys- tems 2023, NeurIPS 2023, New Orleans, LA, USA, De- cember 10 -16, 2023, 2023.
- [Wang et al., 2023b] Xiang Wang, Yingxin Wu, An Zhang, Fuli Feng, Xiangnan He, and Tat-Seng Chua. Reinforced causal explainer for graph neural networks. IEEE Trans. Pattern Anal. Mach. Intell., 45(2):2297-2309, 2023.
- [Yanardag and Vishwanathan, 2015a] Pinar Yanardag and S. V. N. Vishwanathan. Deep graph kernels. In Long- bing Cao, Chengqi Zhang, Thorsten Joachims, Geoffrey I. Webb, Dragos D. Margineantu, and Graham Williams, ed- itors, Proceedings of the 21th ACM SIGKDD International Conference on Knowledge Discovery and Data Mining, Sydney, NSW, Australia, August 10-13, 2015, pages 1365- 1374. ACM, 2015.
- [Yanardag and Vishwanathan, 2015b] Pinar Yanardag and SVN Vishwanathan. Deep graph kernels. In Proceed- ings of the 21th ACM SIGKDD international conference on knowledge discovery and data mining, pages 1365- 1374, 2015.
- [Yang et al., 2019] Yiying Yang, Zhongyu Wei, Qin Chen, and Libo Wu. Using external knowledge for financial event prediction based on graph neural networks. In Wenwu Zhu, Dacheng Tao, Xueqi Cheng, Peng Cui, Elke A. Rundensteiner, David Carmel, Qi He, and Jef- frey Xu Yu, editors, Proceedings of the 28th ACM In- ternational Conference on Information and Knowledge Management, CIKM 2019, Beijing, China, November 3- 7, 2019, pages 2161-2164. ACM, 2019.
- [Ying et al., 2019] Zhitao Ying, Dylan Bourgeois, Jiaxuan You, Marinka Zitnik, and Jure Leskovec. Gnnexplainer: Generating explanations for graph neural networks. In
- Hanna M. Wallach, Hugo Larochelle, Alina Beygelzimer, Florence d'Alché-Buc, Emily B. Fox, and Roman Gar- nett, editors, Annual Conference on Neural Information Processing Systems 2019, NeurIPS 2019, December 8-14, 2019, Vancouver, BC, Canada, pages 9240-9251, 2019.
- [Yuan et al., 2020] Hao Yuan, Jiliang Tang, Xia Hu, and Shuiwang Ji. XGNN: towards model-level explanations of graph neural networks. In Rajesh Gupta, Yan Liu, Jil- iang Tang, and B. Aditya Prakash, editors, KDD '20: The 26th ACM SIGKDD Conference on Knowledge Discovery and Data Mining, Virtual Event, CA, USA, August 23-27, 2020, pages 430-438. ACM, 2020.
- [Yuan et al., 2023] Hao Yuan, Haiyang Yu, Shurui Gui, and Shuiwang Ji. Explainability in graph neural networks: A taxonomic survey. IEEE Trans. Pattern Anal. Mach. In- tell., 45(5):5782-5799, 2023.
- [Zhang and Chen, 2020] Yongfeng Zhang and Xu Chen. Ex- plainable recommendation: A survey and new perspec- tives. Found. Trends Inf. Retr., 14(1):1-101, 2020.
- [Zhang et al., 2024] Jiaxing Zhang, Zhuomin Chen, Hao Mei, Longchao Da, Dongsheng Luo, and Hua Wei. Reg- explainer: Generating explanations for graph neural net- works in regression tasks. In Amir Globersons, Lester Mackey, Danielle Belgrave, Angela Fan, Ulrich Paquet, Jakub M. Tomczak, and Cheng Zhang, editors, Advances in Neural Information Processing Systems 38: Annual Conference on Neural Information Processing Systems 2024, NeurIPS 2024, Vancouver, BC, Canada, December 10 -15, 2024, 2024.
- [Zhao et al., 2023] Tianxiang Zhao, Dongsheng Luo, Xiang Zhang, and Suhang Wang. Towards faithful and consis- tent explanations for graph neural networks. In Tat-Seng Chua, Hady W. Lauw, Luo Si, Evimaria Terzi, and Panayi- otis Tsaparas, editors, Proceedings of the Sixteenth ACM International Conference on Web Search and Data Min- ing, WSDM 2023, Singapore, 27 February 2023 -3 March 2023, pages 634-642. ACM, 2023.
References were extracted automatically from the PDF and may contain errors.
Full text extracted automatically from the PDF; figures, tables and equations may differ. The PDF is the version of record.
1 Introduction
Graph Neural Networks (GNNs) have been widely applied to structured data scenarios such as molecular property prediction, financial risk control, and social network analysis [Wale et al., 2008; Yang et al., 2019; Kipf and Welling, 2017; Yanardag and Vishwanathan, 2015a]. As GNNs are increasingly deployed in high-stakes decision-making tasks, a wide range of explanation methods have been developed and adopted to support understanding and trust in their predictions [Ying et al., 2019; Luo et al., 2020; Wang et al., 2023a; Wang et al., 2023b]. In this context, a central challenge lies in ensuring the robustness of explanations under structural perturbations.
∗Corresponding author.
Recent studies have shown that even when the model prediction remains unchanged, small perturbations to the input graph structure (e.g., adding or deleting a few edges) may lead to drastic changes in the produced explanations [Li et al., 2024; Dombrowski et al., 2019]. Such non-robustness not only undermines the credibility of explanations but also introduces potential risks in practical applications[Lakkaraju and Bastani, 2020]. For instance, in molecular graphs, minor modifications to non-critical chemical bonds may preserve the prediction label while significantly altering the key
networks, slight rewiring of edges may shift risk-related explanations from truly relevant entities to irrelevant ones. Prior work has explored robustness in GNN explanations from multiple perspectives. One line of work adopts smoothingbased mechanisms, either through stochastic averaging (e.g., randomized smoothing) [Dombrowski et al., 2019; Tan and Tian, 2023] or geometry-informed regularization [Liu et al., 2025], which improve stability by uniformly suppressing explanation sensitivity under admissible perturbations. Another line of work follows an ensemble-based strategy, such as partitioning the graph into multiple substructures and aggregating explanations through voting, thereby achieving robustness via uniform aggregation over perturbation outcomes [Li et al., 2025]. Despite their algorithmic differences, these approaches largely share a common characteristic: robustness is enforced by uniformly suppressing or averaging explanation sensitivity over admissible structural perturbations, without explicitly accounting for the inherently anisotropic effects induced by different structural perturbation directions. While reducing explanation variance, such uniform treatment can inadvertently dampen discriminative signals, leading to overly conservative explanations and a degradation in explanation fidelity.
However, this assumption overlooks a pervasive yet longunderestimated fact in real-world graph structures: the impact of structural perturbations on explanations is intrinsically direction-sensitive. Consider mutagenicity prediction for molecular graphs as an example. In such tasks, model decisions are often dominated by a small number of key functional groups, such as nitro groups (-NO2). Under structural modifications that preserve the overall prediction outcome (e.g., remaining classified as toxic), explanations may nevertheless exhibit different responses. For instance, without altering the prediction result, introducing a nitroso group (-NO) may lead to a pronounced shift in the explanation. Although this group is not part of the original toxic core, its close relation to the nitro group in terms of electronic structure and reactivity can cause the explanation to incorrectly transfer importance to the newly introduced substructure. By contrast, introducing a cyano group (-CN), despite involving a structural modification of comparable topological scale, typically does not induce a similar degree of explanation drift, with the explanation remaining more strongly focused on the original nitro group. Although these two modifications are comparable in scale and preserve the model prediction, they induce substantially different explanation responses. This phenomenon indicates that explanation robustness is not determined solely by the size or location of a structural perturbation, but rather depends on whether the perturbation engages directions to which the model's discriminative evidence is highly sensitive. As a result, structural perturbations of equal size can elicit highly non-uniform effects on representations and explanations, which cannot be captured by isotropic perturbation modeling and motivates explicit direction-sensitive mechanisms. This motivates the need for an explicit mechanism to model direction-sensitive responses, enabling characterization of perturbation effects along different directions.
In this paper, we propose GeoXGNN (Local Geometry Improves Explanation Robustness for Graph Neural Networks), a robust explanation framework grounded in local, directiondependent metrics. The key idea is to introduce a local metric structure in the node representation space that explicitly captures the heterogeneous sensitivity of explanations to structural perturbations across different directions, and to directly leverage this information in explanation construction and regularization.
Specifically, GeoXGNN departs from the common assumption that structural perturbations act as isotropic or uniformly scaled noise. First, it performs local perturbation response analysis to estimate a direction-aware sensitivity metric for each node, characterizing how small perturbations along different perturbation-induced directions affect node representations and explanation outcomes. Second, building on the learned local metric, GeoXGNN incorporates discriminative-aware robustness modeling, imposing direction-sensitive stabilization constraints that selectively suppress explanation instability along directions that are both highly sensitive and relevant to the model's decision-making process. Finally, these components are integrated into a single optimization objective for robust explanation learning. Importantly, GeoXGNN is designed to be both a self-contained robust explanation framework and a plug-in robustness module that can be seamlessly integrated with existing graph explanation methods to enhance their robustness. Extensive experiments demonstrate that GeoXGNN substantially improves explanation robustness across multiple node- and graph-level benchmark datasets, while consistently preserving explanation fidelity.
In summary, our main contributions are as follows:
- Direction-sensitive perspective on explanation robustness. We are the first to study the robustness of GNN explanations from a direction-sensitive perspective, revealing that explanation non-robustness under structural perturbations exhibits pronounced anisotropic behavior that cannot be captured by uniform perturbation modeling.
- Metric-aware explanation framework. We propose GeoXGNN, a metric-aware explanation framework that leverages local, direction-dependent sensitivity metrics to guide explanation construction, explicitly accounting for heterogeneous responses to structural perturbations.
- Evaluation and analysis. We conduct extensive experiments on multiple node- and graph-level benchmark datasets, demonstrating that GeoXGNN consistently improves explanation robustness while preserving explanation fidelity, and provide supporting theoretical analysis.
2 ProblemDefinition
2.1 Notations
Let G = (V,E,X) denote an attributed graph, where V = {v1, . . . , vn} is the node set, E ⊆ V ×V is the edge set, and X ∈ Rn×d denotes node features. We consider both nodelevel and graph-level prediction tasks.
Let f be a trained Graph Neural Network. Given an input graph G, the model produces a latent representation
which is used to derive the final prediction. Throughout this work, we consider a pre-trained target GNN whose parameters are fixed during explanation.
2.2 Explanation Robustness Under Structural Perturbations
An explanation method assigns importance scores to structural elements of a graph. In this work, we formalize an explanation as a scoring function:
Based on these scores, an explanation subgraph is constructed by selecting the top-K edges with the highest scores, denoted by EK(G). We denote the corresponding explanation graph as Gs = (Vs, Es), where Es = EK(G) and Vs ⊆ V is the set of nodes incident to Es.
We study explanation robustness under structural perturbations of the input graph. Let G′ = (V ′ ,E′ ) denote a perturbed graph generated by adding and/or removing edges from G, where V ′ ⊆ V and E′ ⊆ V ′ × V ′ . Given a perturbation budget k, we define the admissible perturbation set as
where dE(·, ·) denotes the edge edit distance, defined as the minimum number of edge additions or deletions required to transform G into G′ .
We focus on prediction-preserving structural perturbations. Specifically, given a perturbed graph G′ ∈ Bk(G) such that f(G′ ) = f(G), we are interested in how the explanation subgraph EK(G′ ) compares to EK(G).
Intuitively, an explanation method is considered robust if the top-K explanation subgraph remains stable under small, prediction-preserving structural perturbations.
3 Methodology
Existing robust graph explanation methods typically enforce robustness by treating structural perturbations of comparable graph-edit distance as uniformly scaled noise. As discussed in the introduction, such isotropic treatment fails to capture the highly uneven, direction-dependent effects induced by structural perturbations in graph neural networks.
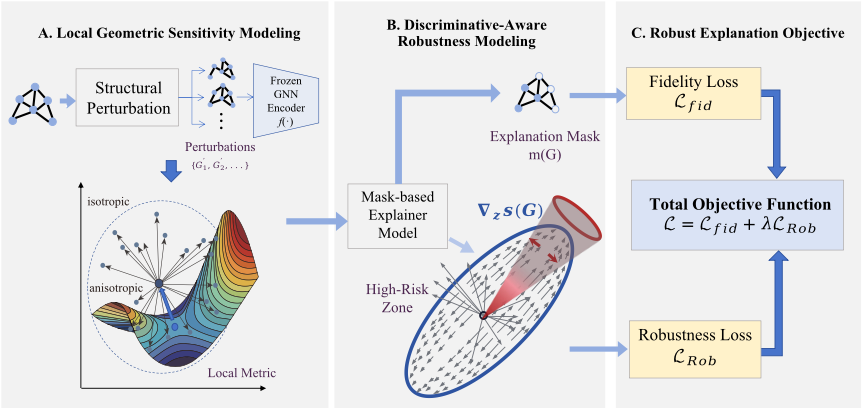
To explicitly model and control this phenomenon, we propose GeoXGNN, a metric-aware robust explanations for graph neural networks that characterizes explanation robustness from a direction-sensitive perspective. We first model local geometric sensitivity (Sec 3.1), then introduce a discriminative-aware robustness modeling framework (Sec 3.2), and finally formulate a robust explanation objective(Sec 3.3). Figure 1 shows an overview of our GeoXGNN.
3.1 Local Geometric SensitivityModeling
To explicitly characterize local geometric sensitivity, we analyze how small structural perturbations deform learned representations and model the resulting anisotropic responses through a perturbation-induced local geometric metric. This metric provides a direction-dependent characterization of representation deformation under unit-scale graph edits.
Structural Perturbations and Representation Geometry. Let f be a pre-trained and fixed GNN. For node-level tasks, we denote the node representation as zv(G) ∈ RD ; for graphlevel tasks, z(G) ∈ RD denotes the graph representation. Given an original graph G and a structurally perturbed graph G′ , we define the representation shift
Although perturbations may share the same graph-edit distance, they can induce representation shifts along different directions with highly uneven magnitudes. As a result, measuring perturbation effects using a fixed Euclidean norm ∥∆z∥2 fails to reflect direction-dependent local sensitivity.
To model direction-dependent sensitivity in the representation space, we introduce a local geometric metric that characterizes how small structural perturbations deform representations along different directions. Although graph structures are discrete, the learned representation z(G) ∈ RD lies in a continuous space, and admissible structural perturbations induce a family of local representation shifts around z(G). From a Riemannian geometry perspective, when the perturbation budget is small, the induced representation shifts are dominated by first-order effects and can be locally approximated by a linear subspace, which serves as a tangent space at z(G).
On this basis, local sensitivity around a point z(G) can be characterized by two components: (i) a local tangent space that captures admissible infinitesimal directions of variation induced by structural perturbations, and (ii) an inner product
(metric tensor) defined on this space that quantifies the relative scale of deformation along different directions [Tron et al., 2024]. Such a metric assigns different weights to different tangent directions, thereby enabling explicit characterization of anisotropic deformation behavior.
Formally, we define a local geometric metric as a symmetric positive semidefinite matrix
which induces a local norm
to measure the effective scale of representation variation.
In the following, we describe how such tangent directions and the associated local metric can be induced from perturbation-based response analysis.
Perturbation-Induced Tangent Directions. To capture direction-dependent sensitivity, we adopt the Adaptive Orthogonal Frame (AOF) [Sun et al., 2026] mechanism to construct local tangent directions in representation space. Specifically, AOF generates perturbation-induced tangent vectors by introducing structured sparse structural perturbations and observing their induced representation changes.
Following the AOF construction, we introduce M virtual perturbation nodes and connect each to k selected real nodes, producing an augmented graph ̂G. For each virtual perturbation, we obtain a tangent candidate
Applying an orthogonal decomposition with length recovery yields an orthogonal frame
where each wm represents a local tangent direction induced by structural perturbations.
Based on the AOF frame, we define the local geometric
which is symmetric positive definite on the spanned tangent subspace. The induced norm Eq. (3) measures the effective scale of representation variation under local structural perturbations. Intuitively, directions corresponding to larger ∥wm∥ encode higher structural sensitivity revealed by perturbation responses, while insensitive directions are naturally downweighted.
Why a Local Metric. Unlike raw perturbation sampling or isotropic norms, the induced metric MG provides a coordinate-free and direction-aware characterization of local geometry. It enables consistent comparison of representation shifts across different perturbation-induced directions and forms the foundation for robustness analysis used to control explanation non-robustness in subsequent sections.
Lemma 1 (Local Sensitivity Characterization). Let W = [w1, . . . ,wM] be the AOF basis constructed from perturbation-induced tangent vectors. Then the metric MG = W ⊤W characterizes the anisotropic sensitivity of representation shifts in the neighborhood of z(G), with each direction weighted according to its local structural sensitivity.
3.2 Discriminative-Aware Robustness Modeling
Local geometric sensitivity characterizes how small structural perturbations are amplified in the representation space. However, not all locally geometrically sensitive directions should be suppressed for robustness: only those directions whose variations are relevant to the model's discriminative decision constitute robustness-critical targets. This motivates a discriminative-aware robustness modeling principle, which selectively constrains explanation sensitivity along discriminative-relevant directions rather than indiscriminately penalizing all local variations.
Explainer Sensitivity in Representation Space. Let s(G) denote the output of a graph explanation method applied to G, and let z(G) be the corresponding representation produced by the frozen GNN. We write s(G) = s(z(G)) to emphasize this dependency. For sufficiently small perturbations, explanation variation admits a first-order approximation:
This expression highlights that explanation instability depends not only on the ∆z, but also on its alignment with the explainer gradient ∇zs(G).
Discriminative Subspace Projection of Local Geometry. Let f(z) denote the prediction score of the frozen GNN for the predicted class. The gradient
defines the most discriminative direction in the representation space, as it characterizes the direction of maximal first-order change in the decision score. We define the discriminative subspace as
Let {wm}Mm=1 denote locally geometrically sensitive directions identified by the local metric construction. We retain only their discriminative-relevant components by projecting them onto Sdisc:
This projection filters out geometrically sensitive but discriminative-irrelevant variations, ensuring that robustness regularization targets only directions that directly interact with the model decision.
Lemma 2 (Discriminative-Aware Local Stability Bound). Assume that the explanation function s(z) is locally Lipschitz in a neighborhood of z(G). For sufficiently small perturbations with representation shift ∆z, the explanation variation satisfies
where the local metric MG is constructed from discriminative-projected sensitivity directions { ˜wm}. Consequently, explanation instability is controlled only along discriminative-relevant, geometrically amplified directions, rather than across the entire representation space.
3.3 Robust Explanation Objective
We incorporate the geometry- and discriminative-aware direction information into a unified explanation objective, so that the explainer is trained to reduce explanation nonrobustness primarily along robustness-critical directions, while preserving discriminative evidence and explanation fidelity.
Direction-Wise Robustness Risk. Let {wm}Mm=1 denote the principal sensitivity directions induced by the local metric MG, and define um = wm/∥wm∥. We quantify the robustness risk along direction m as
which is large only when a direction is both geometrically sensitive and strongly coupled with the explainer gradient.
Robust Explanation Objective. Aggregating directionwise risks yields the robustness objective
where W = [w1, . . . , wM]. This objective penalizes explanation sensitivity only along geometrically amplified directions that interfere with discriminative stability.
Overall Objective. The final training objective is
where Lfid enforces explanation fidelity and λ controls the robustness-fidelity trade-off.
Theorem 1 (Direction-Selective Robustness Guarantee). Under the local Lipschitz assumption of s(z), the proposed objective selectively bounds explanation variation along discriminative-relevant, geometrically sensitive directions. Compared to isotropic regularization, it yields strictly tighter bounds when local sensitivity is anisotropic.
Computational Complexity. Let d denote the representation dimension and M the number of local sensitivity directions. Constructing the local metric incurs a one-time cost O(Md2 ) per graph in the offline stage. During explainer training, computing the robustness objective requires O(Md) additional operations per iteration, introducing negligible overhead compared to standard gradient-based explanation training.
4 Experiments
4.1 Experimental Setups
Tasks and Datasets. We evaluate explanation robustness on both node classification and graph classification tasks. For node classification, we use three citation networks: Cora [McCallum et al., 2000], Citeseer [Giles et al., 1998], and PubMed [Sen et al., 2008] . For graph classification, we consider three real-world datasets, namely MUTAG [Morris et al., 2020], PROTEINS [Borgwardt et al., 2005], and IMDBBINARY [Yanardag and Vishwanathan, 2015b], as well as three synthetic datasets, including SG+House, SG+Diamond, and SG+Wheel [Agarwal et al., 2023]. We use a 70/10/20 split throughout each dataset. We select GCN [Kipf and Welling, 2017] with 3-layer as the target GNN and kept fixed during explanation and robustness evaluation. For explainer, we use a mask-based explainer, which outputs edge-level importance scores me(G) ∈ [0, 1] for each edge e ∈ E. The explanation subgraph is constructed by selecting the top-K edges with the highest scores. We construct the local geometric metric using an AOF-style virtual-node augmentation.
| Dataset | GNNExpl. PGExpl. GNN-LRP Curvature GeoXGNN | ||||
|---|---|---|---|---|---|
| Cora | 0.406 | 0.522 | 0.288 | 0.312 | 0.454 |
| Citeseer | 0.602 | 0.688 | 0.512 | 0.509 | 0.483 |
| PubMed | 0.699 | 0.721 | 0.810 | 0.821 | 0.691 |
| MUTAG | 0.226 | 0.245 | 0.267 | 0.232 | 0.215 |
| PROTEINS | 0.256 | 0.112 | 0.123 | 0.156 | 0.180 |
| IMDB-BINARY | 0.302 | 0.255 | 0.233 | 0.201 | 0.187 |
| SG+House | 0.812 | 0.786 | 0.712 | 0.723 | 0.737 |
| SG+Diamond | 0.610 | 0.724 | 0.502 | 0.566 | 0.424 |
| SG+Wheel | 0.563 | 0.573 | 0.624 | 0.610 | 0.533 |
For each instance, we introduce MAOF = 16 virtual nodes, and connect each virtual node to kAOF = 16 real nodes sampled uniformly to generate local tangent directions.
Baselines. We compare against four representative explainers: GNNExplainer [Ying et al., 2019], PGExplainer [Luo et al., 2020], GNN-LRP [Schnake et al., 2022], and Curvature [Liu et al., 2025]. To assess the plug-in property, we further integrate our GeoXGNN into each baseline, forming enhanced variants (e.g., GNNExplainer+GeoXGNN), and evaluate them under the same settings.
Structural Perturbations and Evaluation. We evaluate explanation robustness under edge-edit perturbations, including both edge deletions and additions. For graph classification, we consider perturbed graphs G′ satisfying dE(G,G′ ) ≤ k, where k is set to ⌊0.1|E|⌋. For node classification, we fix k = 5 and perform perturbations within the 3-hop neighborhood of the target node. Our focus is explanation robustness when the model prediction does not change, when predictions differ, corresponding explanations are expected to change accordingly and should not be constrained to be consistent.
4.2 Metrics
Fidelity-KL. We follow prior work [Yuan et al., 2023; Liu et al., 2025] and measure fidelity by the KL divergence between the predictive distributions of the original graph and the masked explanation graph: Fidelity-KL(G) = KL(p(G) ∥ p(G ⊙ m)), where p(·) denotes the prediction of f and G⊙m is the explainer-produced masked graph. Lower values indicate that the explanation preserves the model behavior more faithfully.
Robustness Evaluation. We evaluate explanation robustness under prediction-preserving structural perturbations using two metrics: AUC and Top-K Edge Jaccard. AUC reflects whether the perturbed explanation preserves the relative ranking of important edges, Jaccard quantifies the hard set overlap of the selected top-K subgraphs. Following [Bajaj et al., 2021], we quantifying how much an explanation changes after adding noise to the input graph. We treat the top-K edges of the explanation on G as positives and use the edge scores produced on a prediction-preserving perturbed graph G′ as ranking scores. We then compute the ROC-AUC over candidate edges, and report the mean AUC.
We measure the stability of the extracted top-K explanation subgraphs by the Jaccard overlap between the top-K
| Datasets | GNNExpl. | PGExpl. | GNN-LRP | Curvature | GeoXGNN | ||||
|---|---|---|---|---|---|---|---|---|---|
| AUC↑ Jaccard↑ | AUC↑ | Jaccard↑ | AUC↑ | Jaccard↑ | AUC↑ | Jaccard↑ | AUC↑ | Jaccard↑ | |
| Cora Citeseer PubMed | 0.607±0.012 0.592±0.215 0.512±0.021 0.644±0.182 0.523±0.113 0.559±0.198 | 0.623±0.232 0.581±0.112 0.458±0.122 | 0.453±0.089 0.458±0.109 0.642±0.128 | 0.719±0.038 0.433±0.021 0.665±0.121 | 0.621±0.132 0.527±0.214 0.589±0.156 | 0.810±0.121 0.678±0.021 0.828±0.021 | 0.835±0.112 0.572±0.017 0.834±0.168 | 0.828 ± 0.168 0.814 ± 0.102 0.866 ± 0.035 | 0.854 ± 0.056 0.719 ± 0.096 0.837 ± 0.112 |
| Datasets | GNNExpl. | PGExpl. | GNN-LRP | Curvature | GeoXGNN | ||||
|---|---|---|---|---|---|---|---|---|---|
| AUC↑ Jaccard↑ | AUC↑ | Jaccard↑ | AUC↑ | Jaccard↑ | AUC↑ | Jaccard↑ | AUC↑ | Jaccard↑ | |
| MUTAG PROTEINS IMDB-BINARY SG+House SG+Diamond SG+Wheel | 0.612±0.123 0.452±0.211 0.322±0.134 0.511±0.189 0.389±0.162 0.358±0.163 0.418±0.211 0.511±0.136 0.598±0.026 0.612±0.024 0.553±0.036 0.587±0.167 | 0.633±0.065 0.623±0.115 0.431±0.158 0.512±0.173 0.542±0.145 0.612±0.029 | 0.621±0.116 0.562±0.178 0.325±0.176 0.622±0.043 0.573±0.042 0.568±0.013 | 0.723±0.078 0.712±0.157 0.345±0.021 0.601±0.123 0.623±0.072 0.528±0.065 | 0.698±0.102 0.621±0.121 0.462±0.089 0.577±0.168 0.523±0.033 0.486±0.052 | 0.821±0.154 0.700±0.112 0.612 ± 0.147 0.819±0.083 0.755±0.035 0.798±0.121 | 0.762±0.135 0.723 ± 0.104 0.487±0.021 0.832±0.074 0.623±0.046 0.652±0.047 | 0.832 ± 0.104 0.722 ± 0.085 0.532±0.126 0.837 ± 0.082 0.812 ± 0.087 0.825 ± 0.055 | 0.867 ± 0.083 0.684±0.131 0.494 ± 0.080 0.868 ± 0.023 0.707 ± 0.088 0.742 ± 0.035 |
edge sets Ek(G) and Ek(G′ ):
Higher AUC and Jaccard indicate more robust explanations.
4.3 Main Results
We report fidelity on original graphs (Fidelity-KL in Table 1) and robustness under prediction-preserving perturbations (AUC/Jaccard in Tables 2 and 3). GeoXGNN maintains competitive fidelity across datasets, achieving the best or near-best KL on several benchmarks (e.g., MUTAG, IMDBBINARY, SG+Wheel, and Citeseer) and remaining close to strong baselines on Cora and PubMed, indicating robustness gains are not obtained by sacrificing faithfulness. Meanwhile, GeoXGNN consistently improves robustness: it attains the highest AUC and Jaccard on all three node datasets, and achieves the best results on MUTAG and all synthetic graph datasets while staying competitive on PROTEINS and IMDB-BINARY. Overall, GeoXGNN yields more stable explanations under prediction-preserving edge edits without degrading fidelity on clean graphs.
4.4 Direction-Dependent Analysis
Under the same edit budget and prediction-preserving constraint, different perturbations can induce representation shifts along different local directions.
To verify this direction-dependent effect, we group perturbations by their alignment with the leading eigen-direction of MG and compare robustness across groups. For each test graph G, we first compute its local metric MG and perform eigendecomposition MG = UΛU ⊤.
We use the leading eigen-direction u1 as the most sensitive direction. We then sample N prediction-preserving perturbed graphs {G′j }Nj=1 with the same edit budget. For each perturbation, we compute ∆zj = z(G′j ) - z(G) and its normalized direction ̂ ∆zj, and define the alignment score: aj = ∣∣∣〈 ̂ ∆zj, u1〉∣∣∣ . We bucket perturbations into High-align (top
| Method | High-align ↑ | Low-align ↑ | Gap ↓ |
|---|---|---|---|
| Euclidean / no-metric | 0.523 | 0.632 | 0.109 |
| GeoXGNN | 0.839 | 0.866 | 0.027 |
30% by aj) and Low-align (bottom 30%). We report groupwise robustness by averaging Jaccard@k within each bucket. Table 4 shows that High-align perturbations cause larger explanation drift for isotropic baselines, while GeoXGNN substantially reduces the gap (Low-align-High-align), indicating direction-dependent stabilization along the most sensitive geometry direction.
4.5 Evaluation As Plug-In
Table 5 evaluates GeoXGNN as a plug-in module by integrating it into GNNExplainer, PGExplainer, and GNN-LRP. Overall, GeoXGNN improves robustness for most (dataset, explainer) pairs across both node and graph classification. Gains are more consistent for optimization-based methods (e.g., GNNExplainer) than for amortized PGExplainer. Curvature is omitted since it is itself a plug-in method and is compared as a baseline in the main tables.
4.6 Ablation and Sensitivity Analysis
We study three key components: (i) the local geometric metric, (ii) the discriminative-aware risk weighting, and (iii) the robustness weight λ.
Effect of Local Metric. As shown in Table 6, replacing the local metric with an isotropic Euclidean treatment causes a clear robustness drop (0.867 → 0.655 in Avg Jaccard@k) and a notable fidelity degradation (KL 0.235 → 0.379). This is because isotropic regularization tends to suppress changes indiscriminately, thus harming fidelity.
Effect of Discriminative-Aware Risk. Removing discriminative-aware weighting reduces robustness from 0.867 to 0.709 and increases KL from 0.235 to 0.291. While the local metric alone already improves robustness over the unregularized baseline, discriminative-aware weighting further strengthens robustness by prioritizing regulation on perturbations that are more decision-relevant.
| Dataset | Metric | GNNExplainer | PGExplainer | GNN-LRP | |||
|---|---|---|---|---|---|---|---|
| Base | +GeoXGNN | Base | +GeoXGNN | Base | +GeoXGNN | ||
| Cora | Avg Jaccard | 0.592±0.215 | 0.659±0.083 | 0.453±0.089 | 0.467±0.099 | 0.621±0.132 | 0.636±0.078 |
| Citeseer | Avg Jaccard | 0.644±0.182 | 0.642±0.058 | 0.458±0.109 | 0.543±0.067 | 0.527±0.214 | 0.533±0.084 |
| PubMed | Avg Jaccard | 0.559±0.198 | 0.589±0.048 | 0.642±0.128 | 0.640±0.037 | 0.589±0.156 | 0.611±0.084 |
| MUTAG | Avg Jaccard | 0.452±0.211 | 0.512±0.071 | 0.621±0.116 | 0.626±0.076 | 0.698±0.102 | 0.712±0.067 |
| PROTEINS | Avg Jaccard | 0.511±0.189 | 0.523±0.099 | 0.562±0.178 | 0.572±0.085 | 0.621±0.121 | 0.625±0.067 |
| IMDB-BINARY | Avg Jaccard | 0.358±0.163 | 0.375±0.066 | 0.325±0.176 | 0.345±0.056 | 0.462±0.089 | 0.482±0.077 |
| SG+House | Avg Jaccard | 0.511±0.136 | 0.523±0.056 | 0.622±0.043 | 0.632±0.041 | 0.577±0.168 | 0.612±0.054 |
| SG+Diamond | Avg Jaccard | 0.612±0.024 | 0.634±0.081 | 0.573±0.042 | 0.589±0.026 | 0.523±0.033 | 0.567±0.073 |
| SG+Wheel | Avg Jaccard | 0.587±0.167 | 0.612±0.022 | 0.568±0.013 | 0.564±0.023 | 0.486±0.052 | 0.495±0.032 |
| Variant | Local Metric | Disc. Risk | λ | Robustness↑ | Fidelity↓ |
|---|---|---|---|---|---|
| w/o Robustness | ✗ | ✗ | 0 | 0.620±0.075 | 0.219±0.019 |
| Euclidean (no metric) | ✗ | ✓ | 1.0 | 0.655±0.054 | 0.379±0.135 |
| w/o Disc. Risk (α=1) | ✓ | ✗ | 1.0 | 0.709±0.035 | 0.291±0.109 |
| Full GeoXGNN | ✓ | ✓ | 1.0 | 0.867±0.083 | 0.235±0.032 |
| λ | Robustness↑ | Fidelity↓ |
|---|---|---|
| 0 | 0.620±0.075 | 0.219±0.019 |
| 0.1 | 0.620±0.074 | 0.215±0.018 |
| 0.5 | 0.701±0.064 | 0.234±0.021 |
| 1.0 | 0.867±0.083 | 0.235±0.032 |
| 2.0 | 0.859±0.139 | 0.243±0.065 |
Effect of RobustnessWeight λ. Table 7 shows that robustness improves as λ increases up to λ = 1.0, while fidelity remains relatively stable in the moderate range (λ=0.5-1.0, KL ≈ 0.234-0.235). When λ becomes too large (2.0), robustness saturates with larger variance and fidelity slightly degrades, indicating mild over-regularization.
5 RelatedWork
Graph Explainability: To enhance the transparency of graph neural networks, many explanation techniques have been proposed in recent years. These methods can be categorized into instance-level methods and model-level methods [Yuan et al., 2023; Zhang and Chen, 2020]. For instance-level methods [Ying et al., 2019; Luo et al., 2020; Schnake et al., 2022; Wang et al., 2021; Zhang et al., 2024; Liu and Xie, 2025], Ying et al. [Ying et al., 2019] proposed GNNExplainer, which treats explanation generation as a mask optimization problem based on perturbation. PGExplainer [Luo et al., 2020] adopted a reparameterization technique to learn an approximate discrete mask that maximizes the mutual information between key structures and the prediction. GNNLRP [Schnake et al., 2022] attributes predictions to relevant graph walks via layer-wise relevance propagation, enabling fine-grained and robust higher-order explanations. For model-level methods [Shin et al., 2024; Magister et al., 2021; Yuan et al., 2020; Wang and Shen, 2023], they give highlevel explanations which reflect patterns of behavior over the whole model. However, most existing explanation methods have been shown to be vulnerable to small perturbations, leading to non-robust explanations.
Explanation Robustness: Recent works have raised growing concerns about the robustness of existing explainability methods. Some obustness-oriented explanation improve explanation robustness by enforcing consistency across perturbed inputs through smoothing-based mechanisms, such as randomized smoothing [Dombrowski et al., 2019; Tan and Tian, 2023; Zhao et al., 2023; Chen et al., 2019] or geometryinformed regularization [Liu et al., 2025]. Other approaches enhance robustness from an ensemble-based perspective, for example by partitioning the graph into multiple substructures and aggregating explanations via voting over perturbation outcomes [Li et al., 2025]. However, these methods typically assume an isotropic perturbation neighborhood and enforce robustness by smoothing, consistency regularization, or aggregation over perturbed inputs, without modeling directiondependent representation sensitivity. This may attenuate discriminative signals, yielding overly conservative explanations with reduced fidelity.
6 Conclusion
In this paper, we studied the robustness of GNN explanations under structural perturbations and highlighted the importance of direction-sensitive effects that are missed by isotropic perturbation modeling. We proposed GEOXGNN, a metricaware framework that leverages local, direction-dependent sensitivity metrics to stabilize explanations along sensitive directions. Experiments show that GEOXGNN consistently improves explanation robustness while preserving fidelity.
Acknowledgements
This work was supported by the National Natural Science Foundation of China (62072052), and the National Key Research and Development Program of China (2024YFF0907401).
@inproceedings{ijcai2026p62,
  title     = {Local Geometry Improves Explanation Robustness for Graph Neural Networks},
  author    = {Diao, Mengting and Sun, Li and Su, Sen},
  booktitle = {Proceedings of the Thirty-Fifth International Joint Conference on
               Artificial Intelligence, {IJCAI-26}},
  publisher = {International Joint Conferences on Artificial Intelligence Organization},
  editor    = {Diego Calvanese},
  pages     = {544--552},
  year      = {2026},
  month     = {8},
  note      = {Main Track},
  doi       = {10.24963/ijcai.2026/62},
  url       = {https://doi.org/10.24963/ijcai.2026/62},
}
TY - CPAPER TI - Local Geometry Improves Explanation Robustness for Graph Neural Networks AU - Diao, Mengting AU - Sun, Li AU - Su, Sen T2 - Proceedings of the Thirty-Fifth International Joint Conference on Artificial Intelligence, IJCAI-26 PB - International Joint Conferences on Artificial Intelligence Organization PY - 2026 SP - 544 EP - 552 DO - 10.24963/ijcai.2026/62 UR - https://doi.org/10.24963/ijcai.2026/62 ER -Copied
Machine-readable versions of this paper, for tools and AI agents:





