
DAHGT-CCI: Dynamic Heterogeneous Graph Transformer for Spatial Transcriptomics Cell-Cell Interaction Inference
Proceedings of the Thirty-Fifth International Joint Conference on Artificial Intelligence. Main Track. Pages 4385-4393.
https://doi.org/10.24963/ijcai.2026/488
Keywords
- Multidisciplinary Topics and Applications: Bioinformatics
- Machine Learning: Supervised Learning
- Multidisciplinary Topics and Applications: Health and medicine
Abstract
Spatial transcriptomics has significantly advanced tissue biology and makes it possible to study the spatial interactions of cells in the microenvironment of complex tissues. However, accurately inferring intercellular communication from these data remains challenging due to the need to effectively integrate spatial topology with high-dimensional gene expression information. To address this challenge, we propose DAHGT-CCI, a novel method for inferring intercellular communication from spatial transcriptomics data. By fusing multimodal heterogeneous features to construct a unified node representation and introducing a meta-relation-aware dynamic attention mechanism, DAHGT-CCI can adaptively learn the weights of edges in the graph, thereby achieving superior precision and fine-grained inference of intercellular interactions. We evaluated the performance of DAHGT-CCI on six different spatial transcriptomics datasets. In these benchmarks, DAHGT-CCI outperformed existing graph-based learning methods and cell-cell communication inference models in terms of accuracy, AUROC, recall, and F1 score. These results demonstrate that DAHGT-CCI can more accurately reconstruct cell communication networks in complex tissue microenvironments, offering an indispensable computational tool for studying developmental processes, disease mechanisms, and potential therapeutic targets from a spatially resolved perspective.
- [Armingol et al., 2024] Erick Armingol, Hratch M Baghdas- sarian, and Nathan E Lewis. The diversification of meth- ods for studying cell-cell interactions and communication. Nature Reviews Genetics, 25(6):381-400, 2024.
- [Asp et al., 2020] Michaela Asp, Joseph Bergenstråhle, and Joakim Lundeberg. Spatially resolved transcrip- tomes-next generation tools for tissue exploration. BioEssays, 42(10):1900221, 2020.
- [Blomberg et al., 2023] Olga S Blomberg, Lorenzo Spagn- uolo, Hannah Garner, Leonie Voorwerk, Olga I Isaeva, Ewald van Dyk, Noor Bakker, Myriam Chalabi, Chris Klaver, Maxime Duijst, et al. Il-5-producing cd4+ t cells and eosinophils cooperate to enhance response to im- mune checkpoint blockade in breast cancer. Cancer Cell, 41(1):106-123, 2023.
- [Cang and Nie, 2020] Zixuan Cang and Qing Nie. Infer- ring spatial and signaling relationships between cells from single cell transcriptomic data. Nature communications, 11(1):2084, 2020.
- [Cang et al., 2023] Zixuan Cang, Yanxiang Zhao, Axel A Almet, Adam Stabell, Raul Ramos, Maksim V Plikus, Scott X Atwood, and Qing Nie. Screening cell-cell com- munication in spatial transcriptomics via collective opti- mal transport. Nature methods, 20(2):218-228, 2023.
- [Chen et al., 2022] Ao Chen, Sha Liao, Mengnan Cheng, Kailong Ma, Liang Wu, Yiwei Lai, Xiaojie Qiu, Jin Yang, Jiangshan Xu, Shijie Hao, et al. Spatiotemporal transcrip- tomic atlas of mouse organogenesis using dna nanoball- patterned arrays. Cell, 185(10):1777-1792, 2022.
- [Cho et al., 2021] Chun-Seok Cho, Jingyue Xi, Yichen Si, Sung-Rye Park, Jer-En Hsu, Myungjin Kim, Goo Jun, Hyun Min Kang, and Jun Hee Lee. Microscopic exam- ination of spatial transcriptome using seq-scope. Cell, 184(13):3559-3572, 2021.
- [Colbert et al., 2023] Leiam Colbert, Nicolas Fernandez, Hao Wang, Benjamin Patterson, Justin He, and Jiang He. 212 investigating cancer and immune cell interactions in the tumour microenvironment with merfish, 2023.
- [Dimitrov et al., 2022] Daniel Dimitrov, Dénes Türei, Mar- tin Garrido-Rodriguez, Paul L Burmedi, James S Nagai, Charlotte Boys, Ricardo O Ramirez Flores, Hyojin Kim, Bence Szalai, Ivan G Costa, et al. Comparison of meth- ods and resources for cell-cell communication inference from single-cell rna-seq data. Nature communications, 13(1):3224, 2022.
- [Dries et al., 2021] Ruben Dries, Qian Zhu, Rui Dong, Chee-Huat Linus Eng, Huipeng Li, Kan Liu, Yuntian Fu, Tianxiao Zhao, Arpan Sarkar, Feng Bao, et al. Giotto: a toolbox for integrative analysis and visualization of spatial expression data. Genome biology, 22:1-31, 2021.
- [Eng et al., 2019] Chee-Huat Linus Eng, Michael Law- son, Qian Zhu, Ruben Dries, Noushin Koulena, Yodai Takei, Jina Yun, Christopher Cronin, Christoph Karp, Guo-Cheng Yuan, et al. Transcriptome-scale super- resolved imaging in tissues by rna seqfish+. Nature, 568(7751):235-239, 2019.
- [Feng et al., 2025] Xixuan Feng, Shuqin Zhang, and Limin Li. Orgaccc: Orthogonal graph autoencoders for con- structing cell-cell communication networks on spatial transcriptomics data. PLOS Computational Biology, 21(6):e1013212, 2025.
- [Fischer et al., 2023] David S Fischer, Anna C Schaar, and Fabian J Theis. Modeling intercellular communication in tissues using spatial graphs of cells. Nature Biotechnology, 41(3):332-336, 2023.
- [Garcia-Alonso et al., 2021] Luz Garcia-Alonso, Louis- Franc ¸ois Handfield, Kenny Roberts, Konstantina Niko- lakopoulou, Ridma C Fernando, Lucy Gardner, Benjamin Woodhams, Anna Arutyunyan, Krzysztof Polanski, Regina Hoo, et al. Mapping the temporal and spatial dynamics of the human endometrium in vivo and in vitro. Nature genetics, 53(12):1698-1711, 2021.
- [Hamilton et al., 2017] Will Hamilton, Zhitao Ying, and Jure Leskovec. Inductive representation learning on large graphs. Advances in neural information processing sys- tems, 30, 2017.
- [Jiang et al., 2019] Bo Jiang, Ziyan Zhang, Doudou Lin, Jin Tang, and Bin Luo. Semi-supervised learning with graph learning-convolutional networks. In Proceedings of the IEEE/CVF conference on computer vision and pattern recognition, pages 11313-11320, 2019.
- [Li and Yang, 2022] Runze Li and Xuerui Yang. De novo re- construction of cell interaction landscapes from single-cell spatial transcriptome data with deeplinc. Genome biology, 23(1):124, 2022.
- [Li et al., 2023a] Haochen Li, Tianxing Ma, Minsheng Hao, Wenbo Guo, Jin Gu, Xuegong Zhang, and Lei Wei. Decod- ing functional cell-cell communication events by multi- view graph learning on spatial transcriptomics. Briefings in Bioinformatics, 24(6):bbad359, 2023.
- [Li et al., 2023b] Zhuoxuan Li, Tianjie Wang, Pentao Liu, and Yuanhua Huang. Spatialdm for rapid identification of spatially co-expressed ligand-receptor and revealing cell- cell communication patterns. Nature communications, 14(1):3995, 2023.
- [Li et al., 2024] Ying Li, Linlin Li, Xiangyu Liu, Yijun Liu, and Qianqian Li. Influence maximization for het- erogeneous networks based on self-supervised clustered heterogeneous graph transformer. Pattern Recognition, 154:110595, 2024.
- [Lv et al., 2021] Qingsong Lv, Ming Ding, Qiang Liu, Yuxi- ang Chen, Wenzheng Feng, Siming He, Chang Zhou, Jian- guo Jiang, Yuxiao Dong, and Jie Tang. Are we really mak- ing much progress? revisiting, benchmarking and refining heterogeneous graph neural networks. In Proceedings of the 27th ACM SIGKDD conference on knowledge discov- ery & data mining, pages 1150-1160, 2021.
- [Peng et al., 2022] Lihong Peng, Feixiang Wang, Zhao Wang, Jingwei Tan, Li Huang, Xiongfei Tian, Guangyi Liu, and Liqian Zhou. Cell-cell communication in- ference and analysis in the tumour microenvironments from single-cell transcriptomics: data resources and computational strategies. Briefings in bioinformatics, 23(4):bbac234, 2022.
- [Pham et al., 2023] Duy Pham, Xiao Tan, Brad Balderson, Jun Xu, Laura F Grice, Sohye Yoon, Emily F Willis, Minh Tran, Pui Yeng Lam, Arti Raghubar, et al. Robust map- ping of spatiotemporal trajectories and cell-cell interac- tions in healthy and diseased tissues. Nature communica- tions, 14(1):7739, 2023.
- [Su et al., 2024] Jimeng Su, Ying Song, Zhipeng Zhu, Xinyue Huang, Jibiao Fan, Jie Qiao, and Fengbiao Mao. Cell-cell communication: new insights and clinical im- plications. Signal Transduction and Targeted Therapy, 9(1):196, 2024.
- [Tsuchiya et al., 2022] Takaho Tsuchiya, Hiroki Hori, and Haruka Ozaki. Ccpls reveals cell-type-specific spatial de- pendence of transcriptomes in single cells. Bioinformatics, 38(21):4868-4877, 2022.
- [Umek et al., 2025] Nejc Umek, Marija Meznarič, Žiga Šink, Kaja Blagotinšek Cokan, Uršula Prosenc Zmrzljak, and Simon Horvat. In situ spatial transcriptomic analysis of human skeletal muscle using the xenium platform. Cell and Tissue Research, pages 1-12, 2025.
- [Veličković et al., 2017] Petar Veličković, Guillem Cucurull, Arantxa Casanova, Adriana Romero, Pietro Lio, and Yoshua Bengio. Graph attention networks. arXiv preprint arXiv:1710.10903, 2017.
- [Wang et al., 2019] Xiao Wang, Houye Ji, Chuan Shi, Bai Wang, Yanfang Ye, Peng Cui, and Philip S Yu. Hetero- geneous graph attention network. In The world wide web conference, pages 2022-2032, 2019.
- [Williams et al., 2023] Claire Williams, Jason W Reeves, Patrick Danaher, Shanshan He, Sean Kim, Michael Patrick, Julian Preciado, Mark Gregory, Zach Reitz, Justin Jenkins, et al. Spatial insights into tumor immune eva- sion illuminated with 1000-plex rna profiling with cosmx spatial molecular imager. Cancer Res, 83(6765):10-1158, 2023.
- [Yang et al., 2025] Chao Yang, Xiuhao Fu, Zhenjie Luo, Leyi Wei, Jingbing Li, Feifei Cui, Quan Zou, Qingchen Zhang, and Zilong Zhang. Gcnla: Inferring cell-cell inter- actions from spatial transcriptomics with long short-term memory and graph convolutional networks. IEEE Journal of Biomedical and Health Informatics, 2025.
- [Zhang et al., 2025] Tianjiao Zhang, Xiang Zhang, Zhenao Wu, Jixiang Ren, Zhongqian Zhao, Hongfei Zhang, Guo- hua Wang, and Tao Wang. Vgae-cci: variational graph autoencoder-based construction of 3d spatial cell-cell communication network. Briefings in Bioinformatics, 26(1):bbae619, 2025.
References were extracted automatically from the PDF and may contain errors.
Full text extracted automatically from the PDF; figures, tables and equations may differ. The PDF is the version of record.
1 Introduction
Cell-cell communication (CCC) serves as a fundamental regulatory mechanism underpinning diverse biological processes, including immune coordination, organ morphogenesis, and the maintenance of stem cell niches through complex molecular signaling networks[Su et al., 2024]. Recent breakthroughs in spatial transcriptomics(ST) have revolutionized our ability to systematically dissect tissue heterogeneity and decode CCC networks[Li et al., 2023a]. By integrating high-resolution gene expression data with spatial coordinates, ST offers an exhaustive atlas of tissue architecture, enabling the identification of different cell types, states, and their interactions within tissue microenvironments[Dimitrov et al., 2022]. This technological breakthrough not only significantly improves our understanding of organizational heterogeneity and cellular spatial organization patterns but also provides unprecedented research perspectives and methodological support to uncover the molecular mechanisms regulating CCC in complex biological systems[Asp et al., 2020].
∗Corresponding authors: Shuo Yu and Qingchen Zhang.
In contemporary spatial transcriptomics research, accurately inferring the cell-cell interaction networks that underpin tissue function, development, and disease progression continues to present considerable obstacles[Peng et al., 2022]. To address this issue, researchers have proposed several calculation methods from different perspectives. For instance, CellphoneDB v3[Garcia-Alonso et al., 2021] leverages spatial information to infer interactions between distinct cells located within the same tissue microenvironment. NCEM[Fischer et al., 2023] employs a probabilistic framework to model the relationships among spatial context, and gene expression. PSTS[Pham et al., 2023] utilizes spatial information and gene expression profiles to identify regions of diverse cell co-localization within tissues, enabling the characterization of spatially resolved cellular niches. However, these studies generally overlook heterogeneity within cell types, modeling distinct cell types as functionally homogeneous populations without adequately accounting for potential functional subgroups and dynamic state variations therein. Although this homogenization-based modeling assumption substantially reduces computational complexity, it may lead to the loss of critical cell-state-specific interaction signals, thereby constraining the systematic elucidation of multicellular coordinated regulatory mechanisms.
In this work, we propose a novel method for cell-cell interaction inference in ST based on a dynamic heterogeneous graph transformer(DAHGT-CCI). This method characterizes intercellular communication relationships using a heterogeneous graph structure and employs a multi-layer messagepassing mechanism to capture nonlinear associations between cells. The main contributions of this work can be summarized as follows:
1) We present a novel paradigm for inferring cell-cell interaction in spatial transcriptomics, based on a dynamic heterogeneous graph transformer. Unlike homogeneous graph models and static heterogeneous graph methods, our approach employs a meta-relation-aware attention head dynamic allocation mechanism, greatly augments the ability to capture interaction signals within the tissue microenvironment.
- We propose a multimodal feature fusion method that generates unified node representations of gene expression and spatial features for different cell types through typespecific transformations. This innovative approach effectively addresses the challenge of co-modeling the heterogeneous modalities of gene expression and spatial topology in spatial transcriptomics.
3) Extensive experimental results demonstrate that our model outperforms state-of-the-art methods across six benchmark datasets, highlighting its superior performance and generalizability.
2 RelatedWork
The prevailing approaches for inferring CCC using ST data can be broadly categorized into two main technical pathways: probabilistic statistical methods and machine learning-based methods. SpatialDM[Li et al., 2023b] employs a bivariate Moran statistical method for hypothesis testing to detect spatially co-expressed ligand-receptor pairs and specific cell signaling pathways. CCPLS[Tsuchiya et al., 2022] utilizes partial least squares regression modeling to calculate a communication coefficient, serving as a quantitative measure of intercellular communication. Giotto[Dries et al., 2021] estimates the interactions between two cell types by incorporating known ligand-receptor information. SpaOTsc[Cang and Nie, 2020] and Commot[Cang et al., 2023] employ collective optimal transport theory to address complex molecular interactions and spatial constraints, thereby inferring intercellular interactions.
Recently, graph neural networks have been widely applied in the construction of intercellular relationships[Armingol et al., 2024]. Clarify[Blomberg et al., 2023] employs a hierarchical graph neural network to infer gene regulatory mechanisms and intercellular interactions. DeepLinc[Li and Yang, 2022] estimates missing distal and proximal interactions using a deep generative model based on a variational graph autoencoder. GCNLA[Yang et al., 2025] proposes an architecture that integrates graph convolutional networks with a long short-term memory-based attention mechanism to capture the structural relationships of cells in spatial contexts, thereby enabling the inference of cell-cell interactions. In contrast, OrgaCCC[Feng et al., 2025] employs a dual-branch orthogonally coupled variational graph autoencoder that performs feature extraction at both the cellular and gene levels. By maximizing the similarity between reconstructed features across these levels, OrgaCCC achieves cross-hierarchical information fusion, which enhances the accuracy of cell-cell communication inference. VGAE-CCI[Zhang et al., 2025] leverages a variational graph autoencoder framework to learn robust cell embeddings by inferring the distribution of latent node representations, thereby predicting the presence of interactions between cell pairs.
3 Preliminary
In this section, we provide a detailed introduction to the symbolic description and construction in this work.
As mentioned above, ST data capture information about cell types, gene expression profiles, and spatial coordinates within the tissue microenvironment using high-resolution spatial localization techniques. This fundamentally creates a multi-source knowledge system that integrates molecular characteristics, cellular attributes, and spatial topological relationships. Heterogeneous graph transformers is a special graph neural network structure that represents complex biological systems by defining various node types and heterogeneous edge relationships, thereby facilitating topological representation and joint modeling of multimodal data.
We developed a heterogeneous directed graph model focused on the tissue microenvironment, denoted as G = (V, E). It consists of a node set V and a link set ξ. Each node v ∈ V represents a cellular entity with a spatial location, categorized into different cell types based on annotation results. Each edge e ∈ E represents the interaction between cells. In this work, we define a single edge type for all edges, representing potential cell-cell interactions inferred from either ligand-receptor matching or spatial proximity (as detailed in the edge construction section). This design treats all inferred interactions uniformly, allowing the model to focus on capturing patterns across cell types without introducing additional edge semantics. Moreover, τ : V → C is the node type mapping function that map each node to the cell type. phi : E → R is the link type mapping function. Cell populations are typically composed of various heterogeneous cell types, a characteristic that aligns perfectly with the fundamental requirements for constructing heterogeneous graphs, where |C| + |R| > 2. For each edge e = (s, t), s represents the source nodes and t represents the target nodes. The metarelation is denoted as < τ (s), ϕ(e), τ (t) >.
4 The ProposedModel
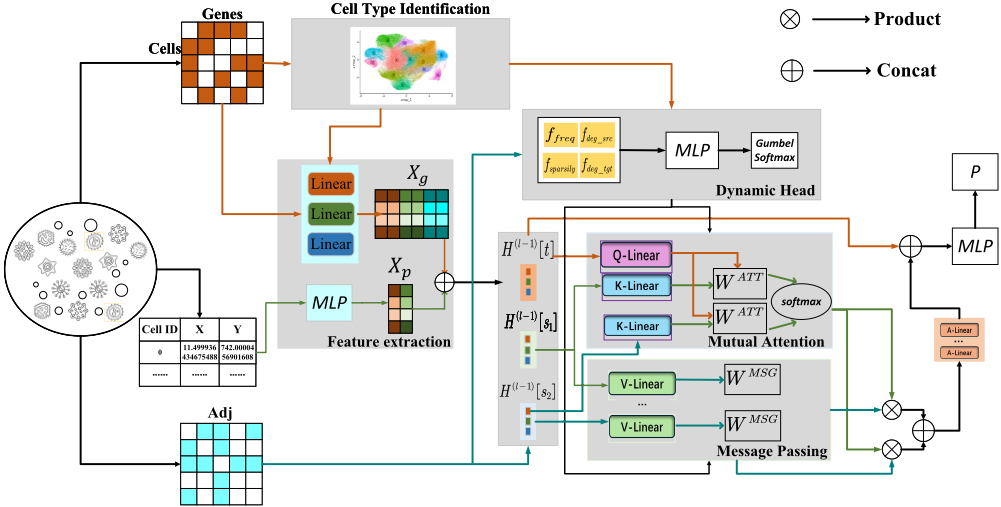
In this section, we innovatively propose a computational method DAHGT-CCI based on a heterogeneous graph transformer to systematically analyze the intercellular interaction network within complex tissue microenvironments(Fig. 1). The framework consists of four main parts: 1) construction of cell interaction edges. 2) feature extraction and fusion. 3) node embedding. 4) link prediction.
4.1 Construction of Cell Interaction Edges
In tissue microenvironments, cells typically engage in interactions through direct contact with neighboring cells, with most cells capable of establishing communication connections with multiple adjacent counterparts.(DeepLinc [Li and Yang, 2022] and VGAE-CCI [Zhang et al., 2025]). To construct the initial adjacency matrix required for cell-cell communication analysis, we propose a computational approach that integrates spatial proximity with ligand-receptor pairing relationships. We compiled ligand-receptor interaction data from seven publicly available databases, encompassing 2,734 mouse L-R pairs and 3,446 human L-R pairs. First, cell pairs with potential ligand-receptor interactions are identified using an established L-R database and ranked by spatial distance. The top k nearest candidates are selected. If fewer than k pairs satisfy the L-R matching criterion, the nearest neighboring cells are supplemented based solely on spatial proximity. The final set of interacting cells is defined as the union of these two subsets. We provide a pseudocode procedure for constructing the cell-cell interaction dataset(Algorithm 1) . Cell pairs with known interactions were designated as positive samples, while negative samples were randomly selected from pairs lacking interactions at a 1:1 ratio to ensure class balance. The entire dataset was subsequently split into training, validation, and test sets in a 70%:10%:20% ratio to facilitate model training and evaluation.
4.2 Feature Extraction and Fusion
We conducted a quality assessment of the raw gene expression matrix, identifying highly variable genes while removing low-quality cells and outlier samples to ensure data reliability. Subsequently, normalization was performed to obtain the matrix Fg ∈ RNt×Din . Furthermore, the nodes in the graph also include spatial location information Fp ∈ RNt×2 . The inherent heterogeneity among the node types requires different representations of characteristics in cellular populations. Consequently, we designed specific linear transformation matrices to map the gene expression features Fg of each node type into a d-dimensional shared latent feature space xg ∈ Rd , which can be formulated as follows:
The transformation standardizes the dimensionality of the gene expression features across distinct cell types. Xg represents the transformed gene expression feature matrix.
Next, we employ a multilayer perceptron (MLP) composed of three fully connected layers to non-linearly transform low-dimensional spatial coordinates into a highdimensional latent space which can be formulated as x(c) p = MLP (f (c) p ), ∀c ∈ C. Each layer of MLP can be represented as h(l +1) = σ(Wl · hl +bl). Wl and bl represent the weight matrix and bias term of the i-th layer respectively. The dimensionality of this latent space is aligned with that of the gene expression features xp ∈ Rd , ensuring compatibility for downstreammultimodal integration and analysis.
Finally, we integrate the processed gene expression features and spatial coordinate features through feature concatenation, resulting in a unified node representation:
4.3 Node Embedding
We employ a heterogeneous graph transformer method based on dynamic head allocation for the node embedding. HGT introduces a heterogeneous attention mechanism that dynamically adjusts feature projections and attention weight distributions for different types of nodes and edges, thereby enhancing the capture of multi-level semantic information within heterogeneous graphs. The attention mechanism is defined as follows:
Algorithm 1 Cell Interaction Construction Algorithm
Require: c ∈ C: The set of all cells. g ∈ G: The set of Gene expression. l ∈ L: Ligand gene set. r ∈ R: Receptor gene set. LR: Ligand-receptor relationship set. D: Cell distance matrix.
Ensure: Si: The set of interacting cells of cell ci.
- 1: for each ci ∈ C do
For the i-th attention head, a linear projection K-Lineariτ(s) : Rd → R dh is employed to map the features of the source node to the i-th key vector Ki (s). Similarly, the same operation is performed on the target node using Q-Lineariτ(t) . This allows each type of node to have a unique linear projection. In HGT, each edge type is associated with a distinct edge matrix, enabling the model to accurately capture the diversity of different semantic relationships. For each target node, the model collects all relevant attention vectors from its neighboring nodes and subsequently normalizes them, dynamically adjusting the contributions of different neighbors.
However, there is a significant disparity in the number of different cell types and their interactions within the tissue microenvironment. Fixed-head attention mechanisms struggle to accommodate this unbalanced interaction pattern, leading to the neglect of low-frequency critical relationships or the overfitting of high-frequency redundant relationships. To address this, we introduce a dynamic head selection strategy that adaptively allocates the number of attention heads based on meta-relations, enabling the dynamic identification of key relationships. The following parameters are calculated for each meta-relation r:
Count the occurrences of each meta-relation across the training subgraph:
Calculate the average out-degree of all source nodes, the average in-degree of all target nodes, and the sparsity of edges under each meta-relation:
The statistics ffreq, fdeg src, fdeg tgt and fsparsity are computed exclusively on the training subgraph to avoid leakage from validation or test datasets. Each feature was normalized and concatenated, followed by a MLP composed of two fully connected layers to obtain the statistical feature vector:
We utilize the Gumbel-Softmax function to approximate the allocation of discrete attention heads:
Dynamically adjust the attention head through αr, where Attentioni(s, e, t) represents the output of the i-th attention head:
The dynamic message-passing process in heterogeneous graphs is analogous to the dynamic attention mechanism. Specifically, for each edge, the model selects the corresponding projection matrix based on the type of meta-relation, mapping the features of the source node and target node into the same semantic space. The output of the message passing process is also subjected to a weighting procedure. This approach mitigates the distributional differences among various types of nodes and edges. The process can be formally expressed as follows:
The computed attention vectors serve as weighting coefficients, allowing averaging of corresponding messages from the source nodes. This process results in an updated vector ˜H(l) [t] that aggregates information from all neighboring nodes, which possess various feature distributions to the target node:
Finally, the vector of the target node is mapped back to its type distribution using a linear projection A-Linearτ(t), incorporating a residual mechanism to update vector ˜H(l) [t]:
4.4 Link Predictor
The role of the link predictor is to forecast the likelihood of interaction between two nodes based on their features. Through node representation learning, the edge feature for edge e = (s, t) is generated based on the representations of the source and target nodes:
The he is fed into a two-layer MLP, which outputs a scalar representing the probability of edge existence. After incorporating the dynamic allocation mechanism for attention heads, the overall loss function includes both the task loss and regularization terms. The regularization terms comprise both a sparsity regularization component Lsparse and a diversity regularization component Ldiv:
We employed binary cross-entropy as the task loss, which can be formulated as:
Lsparse represents the sparsity regularization component, which encourages the model to reduce the number of active attention heads:
Ldiv represents the diversity regularization component, which prevents multiple heads from focusing on the same relational entities:Ldiv = ∑
5 Experiment
In this section, we conducted extensive experiments to evaluate the effectiveness of DAHGT-CCI.
5.1 Datasets
We conducted extensive experiments on six benchmark ST datasets: seqFISH+[Eng et al., 2019], Stereo-seq[Chen et al., 2022], Seq-scope[Cho et al., 2021], MERSCOPE[Colbert et al., 2023], CosMx[Williams et al., 2023], Xenium[Umek et al., 2025]. Table 1 presents the statistics of the datasets, including the number of nodes, edges, features, and node types.
| Datasets | Nodes | Features | Node types |
|---|---|---|---|
| seqFISH+ | 913 | 10000 | 9 |
| Stereo-seq | 22817 | 17944 | 17 |
| Seq-scope | 1647 | 21738 | 7 |
| MERSCOPE | 71381 | 550 | 12 |
| CosMx | 464126 | 1000 | 18 |
| Xenium | 162628 | 17943 | 9 |
5.2 Experimental setup details
All experiments were conducted on a Dell PowerEdge R940xa server equipped with 3 NVIDIA A100 GPUs. Regarding model configuration, the neighborhood graph for cells was constructed using a fixed K value of 5 in the Knearest neighbors algorithm. The initial number of dynamic attention heads was set to 8, with adaptive allocation based on meta-relation statistical features. The hidden layer dimension was 128, and regularization coefficients were configured λ1 = 0.1 and λ2 = 0.05.
5.3 Evaluation of the model
To systematically evaluate the model's comprehensive performance on spatial transcriptomics data, this study employs four core metrics: accuracy (ACC), recall, F1-score, and area under the receiver operating characteristic curve (AUROC). These metrics have become established as standard evaluation frameworks in the field of bioinformatics, enabling a multifaceted assessment of the model's predictive capabilities.
5.4 Experimental Results
We systematically evaluated the performance of six graph neural network models(GCN[Jiang et al., 2019], GAT[Veliˇckovi´c et al., 2017], GraphSAGE[Hamilton et al., 2017], HAN[Wang et al., 2019], HGN[Lv et al., 2021], HGT[Li et al., 2024]) in predicting cell-cell communication across six ST datasets, employing accuracy (ACC), area under the receiver operating characteristic curve (AUROC), Recall, and F1-score as evaluation metrics(Table 2). Statistical significance was assessed using independent-samples t-tests, with a significance threshold of p < 0.01. The experimental results demonstrate that our proposed DAHGT-CCI method significantly outperforms existing benchmark models on all datasets, effectively capturing complex relationships and heterogeneity inherent in the data. In the seqFISH+ dataset, characterized by limited cell numbers and lower sequencing quality, most baseline models exhibited suboptimal performance (GCN achieved ACC, AUROC, recall, and F1-score of 64.27%, 67.81%, 63.14%, and 61.93%, respectively). In contrast, DAHGT-CCI, leveraging its dynamic heterogeneous graph modeling and feature enhancement mechanisms, attained relative performance improvements of 7.4%-30.2% in ACC, 4.5%-29.2% in AUROC, 8.6%-31.7% in recall, and 5.9%-28.9% in F1-score (where relative performance is defined as the performance gap divided by the baseline performance). Notably, DAHGT-CCI excelled in the remaining five high-resolution datasets, surpassing 80% in ACC, AUROC and recall, and 75% in F1-score. These outcomes underscore the model's pronounced advantages in integrating spatial features and cross-modal information. Further analysis of baseline performances revealed that heterogeneous graph models generally surpassed homogeneous counterparts, with HGT emerging as the second-best baseline in all datasets except Seq-scope. This finding further validates the critical role of explicitly modeling cell-type-specific interactions in enhancing representational capacity for cell-cell communication inference.
| Dataset | Metrics | GCN | GAT | GraphSAGE | HAN | HGN | HGT | DAHGT-CCI |
|---|---|---|---|---|---|---|---|---|
| seqFISH+ | ACC | 64.27 | 71.83 | 65.46 | 74.12 | 76.54 | 77.93 | 83.74* |
| AUROC | 67.81 | 78.94 | 68.53 | 79.06 | 80.47 | 83.84 | 87.63* | |
| Recall | 63.14 | 70.62 | 64.25 | 73.08 | 75.26 | 76.57 | 83.16* | |
| F1-score | 61.93 | 69.57 | 63.04 | 71.84 | 74.06 | 75.37 | 79.84* | |
| Stereo-seq | ACC | 76.84 | 83.72 | 79.57 | 81.26 | 85.43 | 87.56 | 90.14* |
| AUROC | 80.64 | 86.57 | 82.38 | 84.79 | 88.46 | 90.67 | 92.83* | |
| Recall | 75.46 | 82.47 | 78.18 | 79.87 | 84.17 | 86.38 | 88.64* | |
| F1-score | 74.28 | 81.26 | 76.97 | 78.69 | 83.09 | 85.18 | 87.46* | |
| Seq-scope | ACC | 68.14 | 75.94 | 73.87 | 77.08 | 78.69 | 82.76 | 86.47* |
| AUROC | 72.06 | 80.37 | 78.94 | 82.58 | 88.37 | 86.59 | 90.78* | |
| Recall | 66.83 | 74.58 | 72.47 | 75.79 | 77.48 | 81.49 | 85.07* | |
| F1-score | 65.64 | 73.28 | 71.19 | 74.59 | 76.29 | 80.28 | 83.69* | |
| MERSCOPE | ACC | 72.94 | 79.48 | 76.18 | 78.39 | 81.59 | 83.79 | 87.84* |
| AUROC | 77.79 | 83.89 | 80.49 | 82.59 | 85.79 | 88.29 | 91.37* | |
| Recall | 71.58 | 78.19 | 74.89 | 77.09 | 80.29 | 82.59 | 86.18* | |
| F1-score | 70.39 | 76.98 | 73.69 | 75.89 | 79.09 | 81.39 | 85.08* | |
| CosMx | ACC | 74.59 | 81.19 | 77.98 | 79.79 | 83.39 | 85.49 | 88.79* |
| AUROC | 79.28 | 85.19 | 82.09 | 83.69 | 87.09 | 89.59 | 93.49* | |
| Recall | 73.29 | 79.89 | 76.69 | 78.49 | 82.09 | 84.29 | 87.79* | |
| F1-score | 72.09 | 78.69 | 75.39 | 77.19 | 80.79 | 82.98 | 86.39* | |
| Xenium | ACC | 75.49 | 82.98 | 79.99 | 81.49 | 85.09 | 87.49 | 91.09* |
| AUROC | 80.39 | 86.49 | 83.59 | 85.29 | 88.69 | 91.39 | 94.59* | |
| Recall | 74.19 | 81.59 | 78.69 | 80.09 | 83.79 | 86.19 | 89.79* | |
| F1-score | 72.98 | 80.39 | 77.39 | 78.89 | 82.59 | 84.98 | 87.29* |
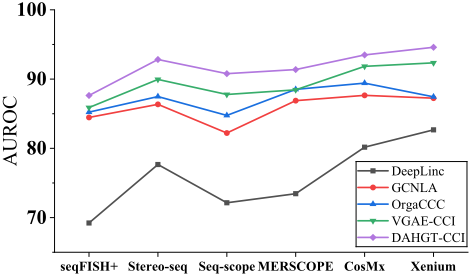
We conducted a systematic comparison of DAHGTCCI with the current mainstream cell-cell interaction inference methods, DeepLinc, GCNLA, OrgaCCC and VGAECCI(Fig. 2). All four methods construct cellular neighborhood graphs based solely on spatially adjacent spots, without incorporating ligand-receptor interaction information. To ensure a fair comparison, we adhered to the same underlying assumptions and likewise employed the K-nearest neighbors algorithm to build the neighborhood graph. Spatially adjacent cell pairs were designated as positive samples, while negative samples were randomly selected at a 1:1 ratio, thereby generating the dataset for subsequent analyses. All methods were implemented using their default parameter settings, and performance was evaluated based on four metrics: ACC, AUROC, recall, and F1-score. Across six large-scale spatial transcriptomics datasets generated by diverse technologies, DAHGT-CCI consistently and significantly outperformed all existing methods in inferring spatial cell-cell interactions. It achieved an average AUROC of 91.78%, representing relative improvements ranging from 1.65% to 3%, with particularly pronounced gains on the Stereo-seq, Seq-scope, and MER- SCOPE datasets. These results underscore the effectiveness and robustness of DAHGT-CCI in complex cell-cell communication inference tasks.
| Description | seqFISH+ | Stereo-seq | Seq-scope | MERSCOPE | CosMx | Xenium |
|---|---|---|---|---|---|---|
| LAH | 84.34±0.67 | 91.37±0.49 | 87.62±0.54 | 89.02±0.61 | 89.86±0.33 | 91.73±0.27 |
| SPM | 72.12±0.83 | 84.35±0.65 | 79.86±0.72 | 81.28±0.68 | 83.15±0.79 | 83.82±0.88 |
| SLM | 85.91±0.58 | 91.68±0.38 | 88.61±0.47 | 90.35±0.42 | 91.06±0.29 | 92.31±0.19 |
| DAHGT-CCI | 87.63±0.42 | 92.83±0.54 | 90.78±0.38 | 91.37±0.44 | 93.49±0.40 | 94.59±0.37 |
Ablation Study
To systematically validate the theoretical contributions of key components in the model architecture, this study designed three sets of control experiments to assess functionality across the following dimensions: (1) LAH: fixing the activation attention heads to limit their dynamic adjustment capabilities. (2) SPM: enforcing a shared projection matrix for all node types to eliminate parameter variability specific to heterogeneous graph structures. (3) SLM: reducing the MLP in the link prediction module to a single-layer linear mapping. All comparative experiments maintained consistent hyperparameter settings and were evaluated using the AUROC metric. Ablation experiments indicate that each core component significantly impacts model performance(Table 3). Enforcing a shared projection matrix resulted in the most substantial performance decline, with an average AUROC decrease of 4.97%. This effect was particularly pronounced in the heterogeneous Seq-scope and Xenium datasets, where the AUROC decreased by 5.47% and 5.62%, respectively, underscoring the importance of type-specific projections for handling heterogeneous graphs. Ablation experiments employing fixed attention heads resulted in a performance decline of 2.17% to 3.08%, underscoring the critical role of the dynamic attention mechanism in maintaining accuracy. Simplifying the MLP classifier resulted in a performance loss of 1.34% to 2.38%, indicating the necessity of deep nonlinear transformations for capturing complex cellular communication patterns.
Parameter Analysis
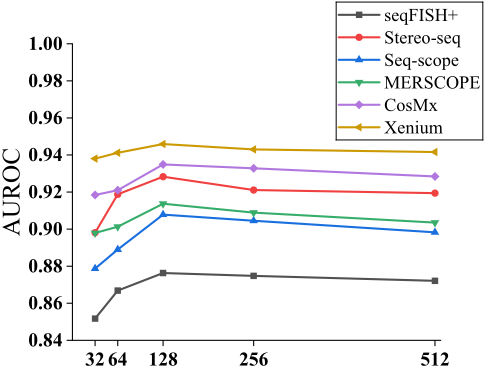
Fig. 3 illustrates the impact of varying the dimensions of the hidden layer on the performance of the DAHGT-CCI. The experimental results indicate that as the embedding dimension of the hidden layers gradually increases from its initial value, the AUROC metric on the test set initially increases before subsequently decreasing. At a dimension of 32, the AUROC for the seqFISH+ and Stereo-seq datasets were 85.17% and 89.83% with the highest values achieved at a dimension of 128. As the dimensionality continues to increase, the AUROC in the test set decrease, which may be attributed to overfitting. When the dimensionality is further increased to 512, the performance were 87.20% and 91.94%, respectively. As the dimensionality increases from 32 to 512, the AUROC exhibits fluctuations. Similarly, we obtained comparable results across the other four datasets.
6 Conclusion
In this paper, we proposed a dynamic heterogeneous graph transformer method tailored for inferring CCC networks from ST data(DAHGT-CCI). By modeling cellular interactions as heterogeneous graphs with multimodal features, our method effectively integrates gene expression profiles, spatial coordinates, and cell-type annotations to capture cell-cell interactions. Extensive experiments across six benchmark ST datasets demonstrated the superiority of DAHGT-CCI over state-of-the-art methods. By bridging computational innovation with biological discovery, DAHGT-CCI paves the way for deeper exploration of cellular ecosystems in health and disease.
While the proposed method has demonstrated the effectiveness of cell communication inference across various datasets, the increasing size of large-scale datasets presents significant memory and processing demands, which may hinder its application in resource-limited environments. In future work, we plan to extend the method to incorporate temporal dynamics and multi-omics integration, while developing lightweight or distributed training strategies to improve scalability on massive datasets.
Acknowledgements
This work is supported by the National Natural Science Foundation of China (No. 62572157 and 62576075).
@inproceedings{ijcai2026p488,
  title     = {DAHGT-CCI: Dynamic Heterogeneous Graph Transformer for Spatial Transcriptomics Cell-Cell Interaction Inference},
  author    = {Huo, Weiliang and Yu, Shuo and Zhang, Qingchen},
  booktitle = {Proceedings of the Thirty-Fifth International Joint Conference on
               Artificial Intelligence, {IJCAI-26}},
  publisher = {International Joint Conferences on Artificial Intelligence Organization},
  editor    = {Diego Calvanese},
  pages     = {4385--4393},
  year      = {2026},
  month     = {8},
  note      = {Main Track},
  doi       = {10.24963/ijcai.2026/488},
  url       = {https://doi.org/10.24963/ijcai.2026/488},
}
TY - CPAPER TI - DAHGT-CCI: Dynamic Heterogeneous Graph Transformer for Spatial Transcriptomics Cell-Cell Interaction Inference AU - Huo, Weiliang AU - Yu, Shuo AU - Zhang, Qingchen T2 - Proceedings of the Thirty-Fifth International Joint Conference on Artificial Intelligence, IJCAI-26 PB - International Joint Conferences on Artificial Intelligence Organization PY - 2026 SP - 4385 EP - 4393 DO - 10.24963/ijcai.2026/488 UR - https://doi.org/10.24963/ijcai.2026/488 ER -Copied
Machine-readable versions of this paper, for tools and AI agents:





