
scGTN: Deep Siamese Graph Transformer Network for Single-cell RNA Sequencing Clustering
Proceedings of the Thirty-Fifth International Joint Conference on Artificial Intelligence. Main Track. Pages 3115-3123.
https://doi.org/10.24963/ijcai.2026/346
© 2026 International Joint Conferences on Artificial Intelligence
Keywords
- Multidisciplinary Topics and Applications: Bioinformatics
- Data Mining: Mining graphs
Abstract
Single-cell RNA sequencing (scRNA-seq) serves a pivotal role in characterizing gene expression at the cellular level, enabling the identification of cell types and advancing the understanding of cellular heterogeneity. Despite the significant progress in scRNA-seq data clustering, we argue that current methods always ignore the sparsity and noise, as well as the complex intercellular structural information inherent in scRNA-seq data. Toward this end, in this paper, we propose a novel single-cell RNA-seq clustering framework via deep Siamese Graph Transformer Network (termed scGTN), which explicitly integrates gene expression profile and intercellular structural dependencies for cell clustering. In particular, we formulate scRNA-seq data as a graph and construct two augmented graph views that serve as dual views to capture complementary intercellular information. Then, a Siamese graph transformer network is employed to explicitly incorporate shortest-path information and node-wise distances for capturing richer structural relationships between cells. Finally, we employ an optimal transport strategy to guide the cell clustering in a self-supervised manner. Extensive experiments on multiple benchmark scRNA-seq datasets demonstrate that our scGTN consistently outperforms existing methods. Our code is available at https://github.com/W-RMSL/scGTN.
- [Benesty et al., 2009] Jacob Benesty, Jingdong Chen, Yiteng Huang, and Israel Cohen. Pearson correlation coeffi- cient. In Noise reduction in speech processing, pages 1-4. Springer, 2009.
- [Bo et al., 2020] Deyu Bo, Xiao Wang, Chuan Shi, Meiqi Zhu, Emiao Lu, and Peng Cui. Structural deep cluster- ing network. In Proceedings of the Web Conference, pages 1400-1410, 2020.
- [Butler et al., 2018] Andrew Butler, Paul Hoffman, Peter Smibert, Efthymia Papalexi, and Rahul Satija. Integrat- ing single-cell transcriptomic data across different condi- tions, technologies, and species. Nature Biotechnology, 36(5):411-420, 2018.
- [Ciortan and Defrance, 2021] Madalina Ciortan and Matthieu Defrance. Contrastive self-supervised clus- tering of scrna-seq data. BMC bioinformatics, 22(1):280, 2021.
- [Dai et al., 2022] Min Dai, Xiaobing Pei, and Xiu-Jie Wang. Accurate and fast cell marker gene identification with cosg. Briefings in bioinformatics, 23(2):bbab579, 2022.
- [Eraslan et al., 2019] Gökcen Eraslan, Lukas M Simon, Maria Mircea, Nikola S Mueller, and Fabian J Theis. Single-cell rna-seq denoising using a deep count autoen- coder. Nature communications, 10(1):390, 2019.
- [Fan et al., 2026] Boyang Fan, Hengchuang Yin, Siyu Yi, Yifan Wang, Zhicheng Li, Leijiyu Zhou, Jiancheng Lv, and Wei Ju. Cmgl: Confidence-guided multi-omics graph learning for cancer subtype classification. arXiv preprint arXiv:2604.24201, 2026.
- [Gan et al., 2022] Yanglan Gan, Xingyu Huang, Guobing Zou, Shuigeng Zhou, and Jihong Guan. Deep structural clustering for single-cell rna-seq data jointly through au- toencoder and graph neural network. Briefings in Bioin- formatics, 23(2), 2022.
- [Hicks et al., 2021] Stephanie C Hicks, Ruoxi Liu, Yuwei Ni, Elizabeth Purdom, and Davide Risso. mbkmeans: Fast clustering for single cell data using mini-batch k-means. PLoS computational biology, 17(1):e1008625, 2021.
- [Hu et al., 2020] Jian Hu, Xiangjie Li, Gang Hu, Yafei Lyu, Katalin Susztak, and Mingyao Li. Iterative transfer learn- ing with neural network for clustering and cell type clas- sification in single-cell rna-seq analysis. Nature machine intelligence, 2(10):607-618, 2020.
- [Johnson, 1967] Stephen C Johnson. Hierarchical clustering schemes. Psychometrika, 32(3):241-254, 1967.
- [Ju et al., 2023] Wei Ju, Yiyang Gu, Binqi Chen, Gongbo Sun, Yifang Qin, Xingyuming Liu, Xiao Luo, and Ming Zhang. Glcc: A general framework for graph-level clus- tering. In Proceedings of the AAAI Conference on Artificial Intelligence, volume 37, pages 4391-4399, 2023.
- [Ju et al., 2025] Wei Ju, Siyu Yi, Yifan Wang, Zhiping Xiao, Zhengyang Mao, Hourun Li, Yiyang Gu, Yifang Qin, Nan Yin, Senzhang Wang, et al. A survey of graph neural net- works in real world: Imbalance, noise, privacy and ood challenges. IEEE Transactions on Pattern Analysis and Machine Intelligence, 2025.
- [Ju et al., 2026] Wei Ju, Siyu Yi, Kangjie Zheng, Yifan Wang, Ziyue Qiao, Li Shen, Yongdao Zhou, Xiaochun Cao, and Jiancheng Lv. Compactness and consistency: A conjoint framework for deep graph clustering. In The Fourteenth International Conference on Learning Repre- sentations, 2026.
- [Kingma, 2014] Diederik P Kingma. Adam: A method for stochastic optimization. arXiv preprint arXiv:1412.6980, 2014.
- [Kiselev et al., 2019] Vladimir Yu Kiselev, Tallulah S An- drews, and Martin Hemberg. Challenges in unsupervised clustering of single-cell rna-seq data. Nature Reviews Ge- netics, 20(5):273-282, 2019.
- [Li et al., 2018] Qimai Li, Zhichao Han, and Xiao-Ming Wu. Deeper insights into graph convolutional networks for semi-supervised learning. In Proceedings of the AAAI con- ference on artificial intelligence, volume 32, 2018.
- [Li et al., 2023] Shenghao Li, Hui Guo, Simai Zhang, Yizhou Li, and Menglong Li. Attention-based deep clustering method for scRNA-seq cell type identification. PLOS Computational Biology, 19(11):e1011641, 2023.
- [Lin et al., 2017] Peijie Lin, Michael Troup, and Joshua WK Ho. Cidr: Ultrafast and accurate clustering through im- putation for single-cell rna-seq data. Genome biology, 18(1):59, 2017.
- [Luo et al., 2021] Zixiang Luo, Chenyu Xu, Zhen Zhang, and Wenfei Jin. A topology-preserving dimensionality re- duction method for single-cell rna-seq data using graph au- toencoder. Scientific reports, 11(1):20028, 2021.
- [Maaten and Hinton, 2008] Laurens van der Maaten and Ge- offrey Hinton. Visualizing data using t-sne. Journal of machine learning research, 9(Nov):2579-2605, 2008.
- [McInnes et al., 2020] Leland McInnes, John Healy, and James Melville. UMAP: Uniform manifold approximation and projection for dimension reduction. arXiv preprint arXiv:1802.03426, 2020.
- [Ou-Yang et al., 2022] Le Ou-Yang, Fan Lu, Zi-Chao Zhang, and Min Wu. Matrix factorization for biomedical link prediction and scrna-seq data imputation: an empir- ical survey. Briefings in Bioinformatics, 23(1):bbab479, 2022.
- [Peng et al., 2020] Lihong Peng, Xiongfei Tian, Geng Tian, Junlin Xu, Xin Huang, Yanbin Weng, Jialiang Yang, and Liqian Zhou. Single-cell rna-seq clustering: datasets, models, and algorithms. RNA biology, 17(6):765-783, 2020.
- [Petegrosso et al., 2020] Raphael Petegrosso, Zhuliu Li, and Rui Kuang. Machine learning and statistical methods for clustering single-cell rna-sequencing data. Briefings in bioinformatics, 21(4):1209-1223, 2020.
- [Ren et al., 2025] Tao Ren, Haodong Zhang, Yifan Wang, Wei Ju, Chengwu Liu, Fanchun Meng, Siyu Yi, and Xiao Luo. Mhgc: Multi-scale hard sample mining for con- trastive deep graph clustering. Information Processing & Management, 62(4):104084, 2025.
- [Sinkhorn, 1967] Richard Sinkhorn. Diagonal equivalence to matrices with prescribed row and column sums. The American Mathematical Monthly, 74(4):402-405, 1967.
- [Stegle et al., 2015] Oliver Stegle, Sarah A Teichmann, and John C Marioni. Computational and analytical challenges in single-cell transcriptomics. Nature Reviews Genetics, 16(3):133-145, 2015.
- [Street et al., 2018] Kelly Street, Davide Risso, Russell B Fletcher, Diya Das, John Ngai, Nir Yosef, Elizabeth Pur- dom, and Sandrine Dudoit. Slingshot: cell lineage and pseudotime inference for single-cell transcriptomics. BMC genomics, 19(1):477, 2018.
- [Strehl and Ghosh, 2002] Alexander Strehl and Joydeep Ghosh. Cluster ensembles-a knowledge reuse framework for combining multiple partitions. Journal of Machine Learning Research, 3:583-617, 2002.
- [Tian et al., 2019] Tian Tian, Ji Wan, Qi Song, and Zhi Wei. Clustering single-cell RNA-seq data with a model-based deep learning approach. Nature Machine Intelligence, 1(4):191-198, 2019.
- [Tian et al., 2021] Tian Tian, Jie Zhang, Xiang Lin, Zhi Wei, and Hakon Hakonarson. Model-based deep embedding for constrained clustering analysis of single cell RNA-seq data. Nature Communications, 12(1):1873, 2021.
- [Vinh et al., 2009] Nguyen Xuan Vinh, Julien Epps, and James Bailey. Information theoretic measures for cluster- ings comparison: Is a correction for chance necessary? In Proceedings of the 26th Annual International Conference on Machine Learning, pages 1073-1080, 2009.
- [Wan et al., 2022] Hui Wan, Liang Chen, and Minghua Deng. scNAME: Neighborhood contrastive clustering with ancillary mask estimation for scRNA-seq data. Bioin- formatics, 38(6):1575-1583, 2022.
- [Wang et al., 2021] Juexin Wang, Anjun Ma, Yuzhou Chang, Jianting Gong, Yuexu Jiang, Ren Qi, Cankun Wang, Hongjun Fu, Qin Ma, and Dong Xu. scgnn is a novel graph neural network framework for single-cell rna-seq analyses. Nature communications, 12(1):1882, 2021.
- [Wang et al., 2025] Qianqian Wang, Haiming Xu, Zihao Zhang, Wei Feng, and Quanxue Gao. Deep multi-modal graph clustering via graph transformer network. In Pro- ceedings of the AAAI Conference on Artificial Intelligence, volume 39, pages 7835-7843, 2025.
- [Wolf et al., 2019] F Alexander Wolf, Fiona K Hamey, Mireya Plass, Jordi Solana, Joakim S Dahlin, Berthold Göttgens, Nikolaus Rajewsky, Lukas Simon, and Fabian J Theis. Paga: graph abstraction reconciles clustering with trajectory inference through a topology preserving map of single cells. Genome biology, 20(1):59, 2019.
- [Wu and Ma, 2022] Wenming Wu and Xiaoke Ma. Network- based structural learning nonnegative matrix factorization algorithm for clustering of scrna-seq data. IEEE/ACM transactions on computational biology and bioinformat- ics, 20(1):566-575, 2022.
- [Xie et al., 2016] Junyuan Xie, Ross Girshick, and Ali Farhadi. Unsupervised deep embedding for clustering analysis. In Proceedings of the 33rd International Con- ference on Machine Learning, pages 478-487, 2016.
- [Xu et al., 2024] Ping Xu, Zhiyuan Ning, Meng Xiao, Gui- hai Feng, Xin Li, Yuanchun Zhou, and Pengfei Wang. sccdcg: efficient deep structural clustering for single-cell rna-seq via deep cut-informed graph embedding. In Inter- national Conference on Database Systems for Advanced Applications, pages 172-187. Springer, 2024.
- [Xu et al., 2025] Ping Xu, Zhiyuan Ning, Pengjiang Li, Wenhao Liu, Pengyang Wang, Jiaxu Cui, Yuanchun Zhou, and Pengfei Wang. scsiameseclu: A siamese clustering framework for interpreting single-cell rna sequencing data. In Proceedings of the International Joint Conference on Artificial Intelligence, pages 7867-7875, 2025. IJCAI
- [Yu et al., 2022] Zhuohan Yu, Yifu Lu, Yunhe Wang, Fan Tang, Ka-Chun Wong, and Xiangtao Li. Zinb-based graph embedding autoencoder for single-cell rna-seq interpreta- tions. In Proceedings of the AAAI conference on artificial intelligence, volume 36, pages 4671-4679, 2022.
- [Zhang et al., 2026a] Haodong Zhang, Xinyue Wang, Tao Ren, Yifan Wang, Siyu Yi, Fanchun Meng, Zeyu Ma, Qingqing Long, and Wei Ju. Fairgc: Fostering individ- ual and group fairness for deep graph clustering. In Pro- ceedings of the AAAI Conference on Artificial Intelligence, volume 40, pages 28194-28202, 2026.
- [Zhang et al., 2026b] Wei Zhang, Siyu Yi, Lezhi Chen, Yi- fan Wang, Ziyue Qiao, Yongdao Zhou, and Wei Ju. Evidence-aware integration and domain identification of spatial transcriptomics data. In Proceedings of the AAAI Conference on Artificial Intelligence, volume 40, pages 16352-16360, 2026.
- [Žurauskienė and Yau, 2016] Justina Žurauskienė and Christopher Yau. pcareduce: hierarchical clustering of single cell transcriptional profiles. BMC bioinformatics, 17(1):140, 2016.
References were extracted automatically from the PDF and may contain errors.
Full text extracted automatically from the PDF; figures, tables and equations may differ. The PDF is the version of record.
1 Introduction
Single-cell RNA sequencing (scRNA-seq) has emerged as a fundamental technology for profiling gene expression in bioinformatics, enabling high-resolution profiling of gene expression across individual cells. Based on the scRNA-seq data, cell clustering plays a central role by organizing cells into biologically meaningful groups based on their gene expression patterns, thereby revealing the intrinsic heterogeneity of cell populations and facilitating biological interpretation of their functions and interactions [Kiselev et al., 2019; Peng et al., 2020]. Accordingly, clustering scRNA-seq data is particularly valuable for a range of downstream tasks, including marker gene annotation [Dai et al., 2022] and cell type identification [Hu et al., 2020].
† Corresponding authors.
For effectively scRNA-seq cell clustering, numerous methods have been proposed to achieve this goal. Early approaches primarily relied on classical clustering algorithms, such as k-means [Hicks et al., 2021], hierarchical clustering [Johnson, 1967], and density-based methods [Petegrosso et al., 2020], which are computationally efficient but are inherently limited in modeling the complex nonlinear characteristics of scRNA-seq data. With the rapid advances in deep learning, recent studies have shifted toward learning-based clustering frameworks that leverage graph neural networks (GNNs) [Ju et al., 2025; Fan et al., 2026] to extract informative representations from scRNA-seq data. By representing cells as nodes and their interactions as edges in a graph, GNN-based approaches jointly exploit gene expression features and structure characteristics to learn context-aware cell embeddings, enabling a more comprehensive cell clustering [Wang et al., 2021; Gan et al., 2022; Xu et al., 2024; Xu et al., 2025; Zhang et al., 2026b].
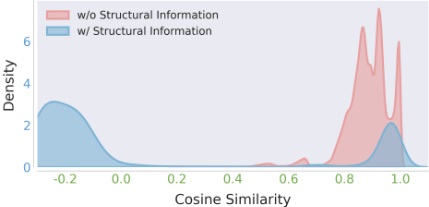
Despite the effectiveness of these methods, we argue that two major challenges remain insufficiently addressed: ∂ Ignoring the Sparsity and Noise inherent within the scRNAseq Data. Arising from extensive dropout effects and measurement noise, scRNA-seq data present a high-dimensional expression matrix [Ou-Yang et al., 2022; Wu and Ma, 2022], which substantially complicates the reliable construction of cell relationships and frequently leads to graphs that are highly sparse and noisy. ∑ Limited Exploitation of Complex Intercellular Structural Information. While existing GNN-based approaches primarily focus on local neighborhood aggregation, they often overlook richer structural cues embedded within the cell graph. Features such as shortest paths and node distances are rarely leveraged, resulting in an insufficient utilization of the graph's inherent information. As shown in Figure 1, cell similarities derived solely from gene expression features tend to be highly homogeneous and difficult to distinguish, whereas incorporating structural information such as positional relationships and shortest-path distances enables a more discriminative characterization of intercellular relationships for cell clustering.
Having realized the above challenges with existing methods, in this paper, we propose a novel deep Siamese Graph Transformer Network for single-cell RNA sequencing (scGTN), which effectively exploits complementary graph information derived from gene expression data to learn discriminative and robust cell embeddings. Specifically, given the scRNA-seq data, we formulate it into a graph and construct two augmented graph views to serve as dual branches to capture and refine the intercellular information. Then, for each branch, we introduce a graph transformer network that incorporates shortest-path information and node-wise distances to capture the complementary graph structural dependencies, enabling a more expressive modeling of complex intercellular relationships. Based on the encoded information, we utilize an optimal transport-guided self-supervised clustering method to align cluster distributions for the clustering learning process.
To summarize, the contributions of this paper are:
- ∂ New Perspective: We study scRNA-seq data clustering by jointly considering gene expression profiles and cell graph structures, which effectively exploits complementary intercellular information beyond feature-level similarities.
- ∑ Novel Methodology: We propose a novel framework termed scGTN, which introduces a Siamese graph transformer network to incorporate richer graph structural information, including shortest paths and node-wise distances for the cell clustering task.
- ∏ Extensive Experiment: We conduct extensive experiments on multiple benchmark scRNA-seq datasets to evaluate the effectiveness of our scGTN. The results further show the superior clustering performance of our framework.
2 Methodology
2.1 ProblemDefinition
Let X = (xij) 2 RN⇥D denote the single-cell gene expression matrix, where each row xi 2 RD denotes the gene expression of the i-th cell, N and D denote the number of cells and gene respectively. Based on X, we construct an undirected cell graph G = (V↪ E), where each node represents an individual cell and edges are established via a k-nearest neighbor (kNN) strategy to capture intercellular similarities quantified by the Pearson correlation coefficient [Benesty et al., 2009]. The adjacency matrix of the constructed graph can be A = (aij) 2 RN⇥N , where entry aij = 1 if (vi↪ vj) 2 E for cell vi and vj , otherwise aij = 0. We associate the degree matrix of the graph as D = diag(d1↪ d2↪ ▷ ▷ ▷ ↪ dN) 2 RN⇥N , where di = PNj=1 aij is the degree of node vi. The goal of scRNA-seq clustering is to partition the cells within the graph G into C disjoint clusters, with each node vi belonging to a unique cluster according to its gene expression features and intercellular connectivity.
2.2 Framework Overview
In this work, we focus on scRNA-seq data clustering and propose a Siamese graph transformer network for the task. As shown in Figure 2, our scGTN consists of three modules: (1) Dual Augmentation Module for scRNA-seq Data, which jointly perturbs the gene expression features and the underlying cell graph structure to generate two complementary views, thereby facilitating robust representation learning; (2) Siamese Graph Transformer Network Fusion Module, which employs two weight-sharing Siamese encoders to process the augmented views while explicitly incorporating structural information of the cell graph; (3) Optimal Transport Clustering Module, which formulates clustering as a distribution alignment problem and employs optimal transport to guide the learning of cluster-consistent representations.
2.3 Dual Augmentation for scRNA-seq Data
To mitigate the effects of inherent sparsity and noise in scRNA-seq data, we introduce biologically reasonable augmentations by adding controlled noise to the gene expression profiles, generating two complementary views that improve the robustness of the learned representations.
Gene Expression Perturbation. Given the single-cell gene expression matrix X, we employ Gaussian noise to perturb the gene expression profiles, which can simulate the natural variability of the gene expression profile as augmentation for the clustering task. The perturbation can be formulated as:
where m denotes the random mask drawn from a Gaussian distribution. In practice, we set the distribution as N(1↪ 0▷1) following the previous work [Xu et al., 2025]. The two augmented gene matrices can be generated as ˜X1 and ˜X2 .
Intercellular Graph Structure Augmentation. In addition to perturbing the gene expression profiles, enhancing the intercellular structure is essential for improving the model's ability to capture the relationships between cells. Specifically, given the constructed cell graph, we remove spurious edges to refine the graph structure and preserve the most biologically relevant connections between cells as one view:
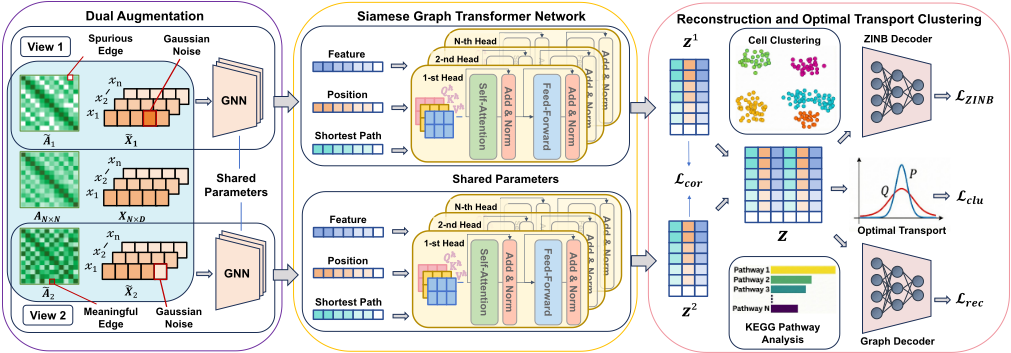
where M denotes the mask matrix based on pairwise cosine similarity. In practice, we identify and remove 10% of edges with the lowest similarity values using this mask. For another view, we enhance the intercellular structure by considering graph diffusion, which propagates information across the graph to strengthen meaningful cell connections:
where ⌘ denotes the diffusion coefficient to control the information propagation within the cell graph.
2.4 Siamese Graph Transformer Network Fusion
To further utilize the richer structural information from the intercellular graph, we introduce a Siamese graph transformer network [Wang et al., 2025] for the two augmented views and adaptively fuse the encoded feature to learn discriminative cell representations.
Gene Expression Embedding. Since cells with similar gene expression profiles are assumed to be connected in the graph, we leverage the gene expression profiles of connected cells to enhance the learning of discriminative gene expression embeddings. In particular, we employ two Siamese graph encoders to produce the cell embedding as:
where G(·↪ ·) denotes the Siamese graph encoder, which is shared across the two augmented views. The resulting encoded gene expression matrix Z⇤ 2 RN⇥d represents the learned feature embeddings for each cell, where d indicates the dimensionality of the feature space. Then, for each cell node with feature z⇤ i , we select the top-t neighbors with the most similar features and concatenate them into a sequence S⇤ i 2 R(t+1)⇥D . The sequence is then encoded as:
where Fge(·) denotes the gene expression encoding function.
Explicit Intercellular Structure Embedding. To explicitly capture the intercellular structure within scRNA-seq data, we incorporate both the position embedding and shortest path embedding of the central node and its neighbors. Specifically, we define the relative positions of the central node as Pos(z⇤ i ) = 0 and assign position values to its neighbors based on their intimacy to the central node, with nodes that are more similar to the central node receiving position values closer to 0. The position embedding is formulated as:
where Fpos(·) denotes the position mapping function. In addition to the intimacy between two nodes, the shortest path characterizes the connection structure between them and explicitly the crucial intercellular structure. Specifically, the shortest path between two nodes within the constructed cell graph can be defined as Sp(z⇤ i ↪ z⇤ j ). Based on this, we formulate the shortest path embedding as:
where Fsp(·) denote the shortest path mapping function.
Siamese Graph Transformer Refinement. We integrate the gene expression and intercellular structure embedding as:
Then we leverage the attention mechanism to encode the integrated embedding, which can be formulated as:
where WQ↪WK↪WV 2 Rd⇥d denote the query, key and value matrices respectively. We employ the multi-attention mechanism with feed-forward networks (FFN) and residual connections as a transformer layer. Through stacking Llayers, the output feature can be Y L↪⇤ i 2 R(t+1)⇥d . The final cell node embedding can be refined as:
We further introduce the correlation loss to prevent feature collapse and redundancy between two views, defined as:
The final cell embedding ˆZ can be fused from two views as:
2.5 Clustering with Optimal Transport
Given the refined cell embedding, we adopt a self-supervised strategy for the scRNA-seq data clustering. Specifically, we measure the similarity between cell embedding ˆ zi and the clustering center θc as the Student's t-distribution [Maaten and Hinton, 2008], formulated as:
where Q = [qic] 2 RN⇥C + denotes the cluster assignment of the cell and ✓ is the degrees of freedom in the Student's t-distribution. Following the previous work [Bo et al., 2020], we sharpen the cluster assignment as the target distribution P = [pic] 2 RN⇥C + , which can be calculated as:
where fc = Pi qic denotes the soft cluster frequency. We further introduce the optimal transport strategy to align the cluster distribution with the mixing proportions, which ensures the robust clustering and prevents the degenerate solution that all cells allocate to a single label:
where P and - logQ denote the transport plan and cost matrix, respectively. Here ⇡ in the constraints represents the proportion of cells assigned to each cluster, which can be derived from the intermediate clustering results. In practice, we utilize the Sinkhorn distance method [Sinkhorn, 1967] for the optimization by introducing entropy constraint H(·) with a Lagrange multiplier λ as:
Therefore, we can iteratively optimize the P as:
where we iteratively update u(t) and v as 1N◁(Qλv(t-1) ) and N⇡◁(Qλu(t) ) at iteration t with N⇡ representing the the total mass of the target distribution and the initial value setting as v(0) = 1N. During the training process, we fixed ˆ P and align Qwith the ˆ P as the clustering loss:
2.6 Overall Optimization
To preserve the intercellular structure information for cell clustering, we reconstruct the cell graph with the learned cell embedding and the Mean Squared Error (MSE) loss can be:
Since scRNA-seq data exhibits sparsity and overdispersion, we further incorporate the Zero-Inflated Negative Binomial (ZINB) loss [Eraslan et al., 2019; Xu et al., 2025] to model the excess zeros and variability. Finally, the overall objective of our scGTN can be defined as:
where ↵↪ β and γ denote the trade-off parameter to balance the contribution of each component.
3 Experiments
3.1 Experimental Setup
Benchmark Datasets. To evaluate the robustness of our model for clustering across species and diverse biological contexts, we conduct experiments on seven public single-cell benchmark datasets, covering both human and mouse samples and including pancreas, liver, and peripheral immune cell populations. In terms of data scale, the number of cells ranges from 1,064 to 8,617, the number of genes ranges from 2,000 to 20,125, and the expression matrices exhibit sparsity rates of approximately 73.02%-93.26%. To standardize the input dimensionality and focus on more informative features, we select either 1,500 or 2,000 highly variable genes (HVGs) for each dataset as the model input. Detailed statistics are summarized in the Table 5 of Appendix B.
Baselines. To highlight the advantages of scGTN, we compare it with ten representative clustering approaches. Specifically, pcaReduce [Žurauskien˙e and Yau, 2016] is included as a representative traditional clustering method. DEC [Xie et al., 2016], contrastive-sc [Ciortan and Defrance, 2021], scNAME [Wan et al., 2022], scDeepCluster [Tian et al., 2019] and AttentionAE-sc [Li et al., 2023] are deep learning-based clustering methods, which mainly learn representations via autoencoders or contrastive learning and then perform clustering. In addition, scGNN [Wang et al., 2021], scDSC [Gan et al., 2022], scCDCG [Xu et al., 2024] and scSiamese [Xu et al., 2025] are deep graph clustering methods that incorporate GNNs and structural information for representation learning and clustering. Detailed experimental settings and implementation details are provided in the Appendix B.
| Datasets | Metric pcaReduce | DEC | contrastive-sc | scNAME | scDeepCluster | scDSC | AttentionAE-sc scGNN | scCDCG | scSiameseClu | Ours | ||
|---|---|---|---|---|---|---|---|---|---|---|---|---|
| Muraro Human Pancreas cells | ACC NMI ARI | 50.56◦3.4 54.83◦1.7 36.61◦2.3 | 72.22◦5.5 76.29◦2.7 61.76◦5.6 | 81.85◦4.6 77.73◦3.3 75.22◦10.1 | 80.36◦7.9 79.12◦2.7 76.64◦10.4 | 74.70◦2.7 79.32◦0.3 64.59◦2.5 | 79.42◦1.4 75.89◦0.6 75.42◦1.2 | 93.84◦2.7 87.80◦2.3 90.74◦4.1 | 79.32◦4.0 78.76◦5.6 78.87◦3.2 | 92.65◦1.9 86.81◦1.0 91.37◦1.2 | 94.95◦0.1 86.19◦0.3 91.59◦0.3 | 96.02◦0.5 89.15◦1.1 93.10◦0.9 |
| Human Pancreas cells 1 | ACC NMI ARI | 23.63◦0.2 42.58◦0.4 1.98◦0.5 | 40.64◦1.9 62.35◦0.6 26.07◦1.3 | 69.67◦7.8 69.21◦3.3 52.00◦8.7 | 84.20◦6.0 65.74◦4.0 63.31◦7.4 | 66.39◦3.8 69.42◦12.5 47.92◦3.0 | 73.10◦2.3 60.50◦4.2 69.81◦1.6 | 81.56◦1.8 82.62◦3.0 71.84◦8.5 | 55.10◦2.1 64.03◦0.9 38.32◦0.8 | 92.15◦0.8 86.35◦0.9 92.83◦0.6 | 95.12◦0.4 89.50◦0.6 93.40◦0.5 | 97.21◦0.3 93.23◦0.2 96.61◦1.5 |
| Human Pancreas cells 2 | ACC NMI ARI | 37.56◦0.4 50.81◦0.3 19.23◦0.5 | 45.26◦1.8 66.32◦2.1 39.14◦1.8 | 60.01◦5.7 62.25◦2.3 47.10◦5.3 | 63.33◦2.0 58.05◦1.6 32.12◦1.5 | 62.88◦5.5 73.97◦2.2 64.56◦7.5 | 80.40◦4.0 79.44◦1.7 82.85◦6.5 | 80.40◦4.0 82.16◦10.9 73.20◦10.5 | 57.62◦2.3 79.32◦2.3 79.96◦1.7 | 84.66◦1.1 83.44◦2.6 85.30◦1.6 | 89.45◦0.9 86.80◦1.2 89.20◦1.1 | 91.13◦0.9 90.63◦1.2 92.38◦1.4 |
| Human Pancreas cells 3 | ACC NMI ARI | 35.92◦0.4 51.22◦0.3 26.40◦4.5 | 43.56◦1.5 64.51◦0.8 42.73◦1.0 | 57.47◦5.0 66.84◦2.3 47.90◦3.4 | 83.20◦8.7 80.56◦5.6 81.08◦5.7 | 73.65◦3.1 75.02◦1.2 63.31◦2.3 | 80.12◦10.0 75.87◦8.4 82.85◦8.5 | 90.96◦2.4 87.00◦1.8 89.78◦2.5 | 67.94◦4.6 62.60◦1.8 58.41◦1.9 | 88.04◦0.3 82.21◦1.1 90.78◦0.6 | 89.45◦0.5 86.20◦0.6 92.34◦0.8 | 95.31◦1.4 91.37◦0.3 95.25◦0.5 |
| Mouse Pancreas cells 2 | ACC NMI ARI | 28.97◦0.3 48.93◦0.1 12.80◦0.1 | 34.19◦2.3 54.08◦0.9 18.54◦1.1 | 59.55◦5.7 62.34◦2.4 49.75◦8.5 | 82.36◦8.0 78.00◦3.9 76.56◦11.4 | 69.91◦2.9 59.58◦2.6 60.14◦3.6 | 77.35◦2.3 62.50◦0.4 65.81◦1.4 | 81.92◦6.5 81.88◦5.1 82.14◦7.8 | 43.03◦3.0 55.87◦1.9 26.40◦2.5 | 93.97◦0.2 88.02◦0.2 92.61◦0.3 | 92.45◦0.4 86.50◦0.5 90.80◦0.6 | 95.11◦1.2 88.59◦0.6 93.43◦0.8 |
| CITE-CMBC | ACC NMI ARI | 28.19◦0.1 28.36◦0.2 5.10◦0.1 | 41.88◦5.4 46.87◦9.2 23.55◦10.3 | 52.70◦5.0 64.83◦0.8 47.88◦3.7 | 68.06◦13.3 63.23◦13.2 58.99◦21.3 | 70.80◦2.5 72.53◦0.7 56.23◦4.1 | 68.79◦0.9 64.21◦3.3 52.51◦2.2 | 61.18◦7.9 62.02◦9.6 44.20◦11.6 | 66.71◦4.0 61.70◦3.1 61.20◦3.1 | 71.45◦1.8 74.77◦1.7 61.46◦1.4 | 74.70◦0.5 68.71◦0.7 67.56◦1.1 | 79.20◦0.5 76.50◦0.4 69.80◦0.5 |
| Human Liver cells | ACC NMI ARI | 34.92◦0.2 32.07◦0.6 6.34◦14.4 | 46.32◦5.5 52.24◦5.0 31.04◦4.7 | 79.31◦2.1 85.11◦0.1 89.96◦0.1 | 74.55◦5.3 77.42◦12.0 79.91◦2.9 | 63.44◦0.7 74.60◦2.5 58.58◦10.1 | 70.90◦2.2 71.63◦2.8 75.34◦3.6 | 79.46◦6.7 82.86◦4.5 79.16◦11.8 | 68.65◦3.2 62.33◦2.1 65.41◦1.3 | 75.34◦1.7 79.34◦2.6 81.26◦2.7 | 88.33◦1.7 88.82◦1.2 91.90◦0.5 | 94.50◦0.9 90.15◦1.1 94.10◦0.5 |

Evaluation Metrics. To evaluate the effectiveness of the proposed method, we assess clustering performance using three widely adopted metrics: clustering accuracy (ACC), normalized mutual information (NMI) [Strehl and Ghosh, 2002], and adjusted Rand index (ARI) [Vinh et al., 2009].
3.2 Overall Performance
Quantitative Analysis. Table 1 compares the clustering performance of scGTN with ten competitive baselines on seven benchmark datasets. From the results, we make the following observations. (1) scGTN achieves the best performance across all three metrics on all datasets, demonstrating its strong capability in handling high-dimensional and highly sparse scRNA-seq data. On average, compared with the second-best method, scGTN yields significant improvements of 3.00%, 2.42%, and 2.30% in terms of ACC, NMI, and ARI, respectively, validating the effectiveness and generalizability of our approach. (2) Compared with deep clustering methods that rely solely on gene expression features, our scGTN consistently delivers substantial gains, highlighting the benefit of jointly leveraging expression features and cell-cell structural information. (3) Although GNN-based methods like scGNN incorporate cell graphs, they predominantly rely on local neighborhood aggregation, which renders them vulnerable to over-smoothing and limits their ability to capture global dependencies. scGTN overcomes this by encoding complex structural information via the Siamese Graph Transformer, yielding more discriminative representations. Analysis of runtime is provided in Appendix F.
Visualization. To further investigate the model's ability to capture the underlying structure of cells in the embedding space, we apply UMAP [McInnes et al., 2020] to project the learned representations of the Human Liver dataset into two dimensions, as shown in Figure 3. We observe that our scGTN produces highly compact clusters with clear intercluster boundaries, faithfully reflecting the complex underlying tissue structure and effectively preserving the intrinsic heterogeneity among different cell types. In contrast, methods such as scDSC often yield projections with noticeable subtype mixing or diffuse distributions, making it difficult to separate rare cell populations from major groups.
3.3 Biological Analysis
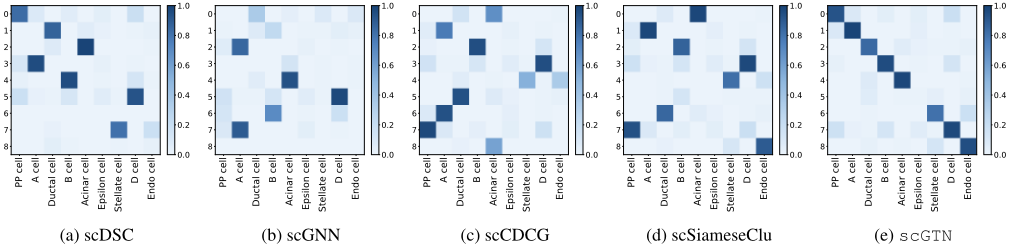
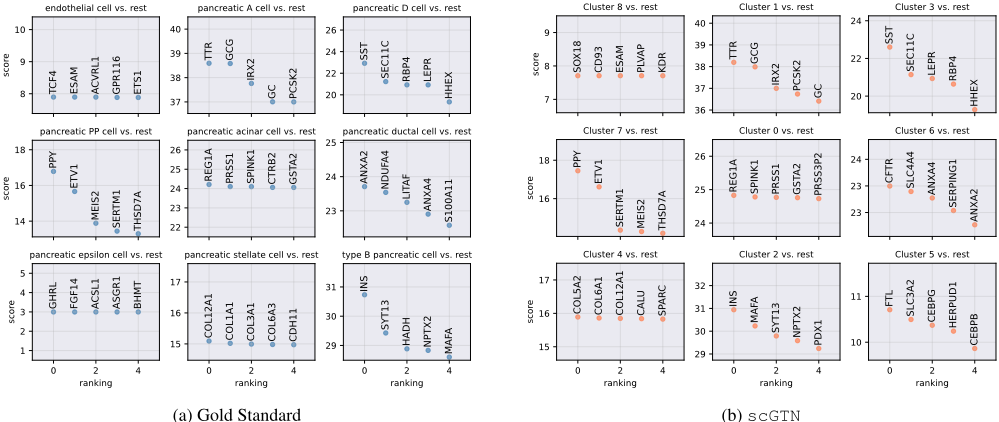
Differential Gene Expression Analysis. Differentially expressed genes (DEGs) serve as a critical metric to validate the biological identity of learned clusters. Using Seurat's "FindAllMarkers" [Butler et al., 2018], we extract the top-100 DEGs for each cluster on the Muraro Human Pancreas dataset and quantitatively compute the overlap ratio with the corresponding ground-truth cell types. As shown in Figure 4, the high-overlap regions of scGTN are predominantly concentrated along the diagonal, consistently surpassing 90% overlap in most clusters. This indicates that our clusters can be stably mapped to specific cell types with minimal confusion. In stark contrast, baseline methods frequently exhibit lower overlap ratios due to ambiguity and inter-cluster confusion. To further investigate the biological fidelity, we compare the rankings of the top 5 DEGs between scGTN and the Gold Standard as illustrated in Figure 5. Beyond mere overlap, we observe remarkable consistency in the dominant markers. For instance, in the cluster corresponding to Pancreatic PP cells (Cluster 7), our scGTN identifies PPY and ETV1 as the toptwo markers, perfectly matching the Gold Standard. This precise alignment in both gene identity and ranking confidence demonstrates that our scGTN does not merely capture global similarities but accurately prioritizes the key marker genes essential for distinct cell identification.
KEGG Pathway Enrichment Analysis. To validate the biological interpretability of the clustering results, we perform KEGG pathway enrichment analysis on representative clusters. As shown in Figure 6, our scGTN successfully resolves distinct functional subpopulations in pancreatic tissue. Cluster 3 is significantly enriched in "Insulin secretion" and critical diabetes-related pathways including MODY, while also exhibiting neuroendocrine signatures such as the "Synaptic vesicle cycle", confirming its biological identity as pancreatic β cells. Cluster 4 shows strong enrichment in "Ribosome" and protein synthesis-related pathways, highlighting the high protein synthesis activity characteristic of acinar cells. Finally, Cluster 5 is enriched in pathways such as "Phagosome" and "Lysosome", indicating the presence of tissue-resident immune cells such as macrophages. These results demonstrate that our scGTN can accurately identify KEGG pathways and distinct functional phenotypes.
Furthermore, we provide trajectory inference analysis in Appendix D to validate preserved developmental manifolds.
3.4 Ablation Study
Effectiveness of Major Components. We evaluate the contribution of each loss term on the Muraro dataset. Table 2 indicates that the exclusion of any component leads to a sharp performance degradation of over 10% in ACC, highlighting the non-redundancy of each module. Specifically, the absence of the optimal transport clustering loss Lclu results in the most severe drop, underscoring its critical role in guiding partition assignments. Similarly, removing the correlation term Lcor or the reconstruction objectives LZINB and Lrec significantly impairs the capability of the model to align views and preserve topology. Ultimately, the full scGTN achieves superior performance, validating the synergy of jointly optimizing for structural, feature, and distribution constraints. Dualcomponent ablation analysis is provided in Appendix G.

| Lclu | Lcor | LZINB | Lrec | ACC | NMI | ARI |
|---|---|---|---|---|---|---|
| X | X | X | ⇥ | 84.57 | 78.93 | 76.08 |
| X | X | ⇥ | X | 84.18 | 78.36 | 75.62 |
| X | ⇥ | X | X | 83.47 | 77.58 | 74.36 |
| ⇥ | X | X | X | 81.24 | 74.79 | 70.68 |
| X | X | X | X | 96.02 | 89.15 | 93.10 |
Impact of Embedding Components. We further dissect the embedding module to assess the contributions of Gene Expression (GE), Position (Pos), and Shortest-Path (SP) embeddings in Table 3. Results indicate that while GE provides the foundational semantics, integrating it with structural priors yields massive gains. Notably, adding Pos alone boosts ACC by over 12% compared to the GE baseline, and the full combination achieves peak performance, confirming that structural information is essential for distinguishing subtle cell states.
| Model Variants | ACC | NMI | ARI |
|---|---|---|---|
| scGTN | 96.02 | 89.15 | 93.10 |
| GE + Pos | 92.12 | 86.33 | 88.55 |
| GE + SP | 80.09 | 71.08 | 67.76 |
| Pos + SP | 27.52 | 12.13 | 5.06 |
| Gene Expression (GE) | 79.24 | 70.69 | 67.61 |
| Position (Pos) | 16.68 | 0.73 | 0.23 |
| Shortest Path (SP) | 26.53 | 12.14 | 6.80 |
3.5 Sensitivity Analysis
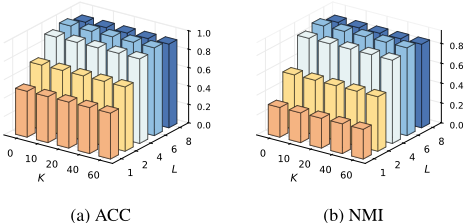
To evaluate the robustness of scGTN against hyperparameter variations, we conduct a sensitivity analysis on the Muraro Human Pancreas dataset. We examine neighborhood size K (5-60) and Transformer layers L (1-8). As illustrated in Figure 7, the model demonstrates high stability with respect to K, showing only marginal fluctuations across all metrics, indicating that our scGTN is robust to variations in the underlying graph construction. Conversely, performance depends more significantly on network depth L. Shallow networks where L = 1 yield suboptimal scores due to insufficient feature propagation and limited semantic capture. Increasing depth improves results until peaking at L = 6, where the model effectively balances local and global information. Further extending depth to 8 leads to a slight performance drop, likely due to over-smoothing. Further sensitivity analyses regarding other hyperparameters are detailed in Appendix E.
4 Conclusion
In this paper, we propose a novel deep Siamese Graph Transformer Network (scGTN), which effectively integrates gene expression profiles and intercellular structural information for scRNA-seq data clustering. Specifically, we formulate the scRNA-seq data as a graph and construct two augmented graphs as dual views to capture complementary intercellular relationships. Then, we introduce a Siamese graph transformer network which integrates richer graph structural information, i.e., shortest-path and node-wise distance, to explicitly capture intercellular relationships. To further refine the cell clustering, we incorporate an optimal transport mechanism in a self-supervised manner, enhancing representation learning while preserving biological relevance. Extensive experiments on scRNA-seq benchmark datasets verify the effectiveness and superiority of our proposed scGTN.
Contribution Statement
Jinke Wu and Yifan Wang contributed equally to this work.
Acknowledgments
This work is supported in part by the National Natural Science Foundation of China under Grant 62306014 and 12501344, Postdoctoral Fellowship Program (Grade A) of CPSF under Grant BX20250376 and BX20240239, China Postdoctoral Science Foundation under Grant 2024M762201, Sichuan Science and Technology Program under Grant 2025ZNSFSC1506 and 2025ZNSFSC0808, Sichuan University Interdisciplinary Innovation Fund.
@inproceedings{ijcai2026p346,
  title     = {scGTN: Deep Siamese Graph Transformer Network for Single-cell RNA Sequencing Clustering},
  author    = {Wu, Jinke and Wang, Yifan and Yi, Siyu and Yu, Caiyang and Qiao, Ziyue and Yin, Nan and Lv, Jiancheng and Ju, Wei},
  booktitle = {Proceedings of the Thirty-Fifth International Joint Conference on
               Artificial Intelligence, {IJCAI-26}},
  publisher = {International Joint Conferences on Artificial Intelligence Organization},
  editor    = {Diego Calvanese},
  pages     = {3115--3123},
  year      = {2026},
  month     = {8},
  note      = {Main Track},
  doi       = {10.24963/ijcai.2026/346},
  url       = {https://doi.org/10.24963/ijcai.2026/346},
}
TY - CPAPER TI - scGTN: Deep Siamese Graph Transformer Network for Single-cell RNA Sequencing Clustering AU - Wu, Jinke AU - Wang, Yifan AU - Yi, Siyu AU - Yu, Caiyang AU - Qiao, Ziyue AU - Yin, Nan AU - Lv, Jiancheng AU - Ju, Wei T2 - Proceedings of the Thirty-Fifth International Joint Conference on Artificial Intelligence, IJCAI-26 PB - International Joint Conferences on Artificial Intelligence Organization PY - 2026 SP - 3115 EP - 3123 DO - 10.24963/ijcai.2026/346 UR - https://doi.org/10.24963/ijcai.2026/346 ER -Copied
Machine-readable versions of this paper, for tools and AI agents:





