
Dual-Adversarial Dynamic Variational Asset Pricing with Adaptive Spatio-Temporal Feature Clustering for Portfolio Recommendation
Proceedings of the Thirty-Fifth International Joint Conference on Artificial Intelligence. Main Track. Pages 2590-2598.
https://doi.org/10.24963/ijcai.2026/288
Keywords
- Multidisciplinary Topics and Applications: Finance
- Data Mining: Applications
- Uncertainty in AI: Applications
Abstract
Asset pricing and portfolio recommendation are two closely related fundamental tasks in quantitative investment, for which machine learning methods have attracted significant attention in both academia and industry. In particular, nonlinear asset pricing models based on deep learning architectures that learn risk factors and risk exposures (betas) conditioned on high-dimensional asset characteristics have become widely used in the field.
Despite their popularity, three challenges remain for portfolio recommendation: (i) their static risk pricing structure constrains predictive performance for expected returns; (ii) their representation learning is typically deterministic or fails to account for the inherent distributional uncertainty in the feature space arising from noisy returns and heterogeneous characteristics; and (iii) the sparse factor structure of asset returns and the diversity of characteristics make it difficult to identify incremental predictive information. To address these issues and bridge the gap to practical applications, we propose a novel multi-task dynamic factor model that jointly performs asset pricing and portfolio recommendation. Specifically, we introduce dual-adversarial trainers into the variational prior-posterior learning framework for Factor and Beta Networks, augmented with probabilistic equivariance regularization and dual adaptive spatio-temporal clustering. These components filter redundant information and enhance the model's ability to adapt to changing market conditions. Extensive experiments on a comprehensive open-source stock market dataset demonstrate that our model achieves strong and robust performance relative to baseline methods in the literature.
- [Bryzgalova et al., 2025] Svetlana Bryzgalova, Markus Pel- ger, and Jason Zhu. Forest through the trees: Building cross-sections of stock returns. The Journal of Finance, 80(5):2447-2506, 2025.
- [Carhart, 1997] Mark M Carhart. On persistence in mutual fund performance. The Journal of Finance, 52(1):57-82, 1997.
- [Chatigny et al., 2021] Philippe Chatigny, Ruslan Goyenko, and Chengyu Zhang. Asset pricing with attention guided deep learning. Available at SSRN 3971876, 2021.
- [Chen and Zimmermann, 2022] Andrew Y. Chen and Tom Zimmermann. Open source cross-sectional asset pricing. Critical Finance Review, 27(2):207-264, 2022.
- [Chen et al., 2024a] Jialin Chen, Jan Eric Lenssen, Aosong Feng, Weihua Hu, Matthias Fey, Leandros Tassiulas, Jure Leskovec, and Rex Ying. From similarity to superiority: Channel clustering for time series forecasting. Advances in Neural Information Processing Systems, 37:130635- 130663, 2024.
- [Chen et al., 2024b] Luyang Chen, Markus Pelger, and Ja- son Zhu. Deep learning in asset pricing. Management Science, 70(2):714-750, 2024.
- [Cochrane, 2011] John H Cochrane. Presidential address: Discount rates. The Journal of Finance, 66(4):1047-1108, 2011.
- [Du et al., 2021] Yuntao Du, Jindong Wang, Wenjie Feng, Sinno Pan, Tao Qin, Renjun Xu, and Chongjun Wang. AdaRNN: Adaptive learning and forecasting of time se- ries. In Proceedings of the 30th ACM International Conference on Information & Knowledge Management, pages 402-411, 2021.
- [Duan et al., 2022] Yitong Duan, Lei Wang, Qizhong Zhang, and Jian Li. FactorVAE: A probabilistic dynamic factor model based on variational autoencoder for predicting cross-sectional stock returns. In Proceedings of the 36th AAAI Conference on Artificial Intelligence, volume 36, pages 4468-4476, 2022.
- [Duan et al., 2025] Yitong Duan, Weiran Wang, and Jian Li. FactorGCL: A hypergraph-based factor model with temporal residual contrastive learning for stock returns prediction. In Proceedings of the 39th AAAI Conference on Artificial Intelligence, volume 39, pages 173-181, 2025. [Fama and French, 1992] Eugene Fama and Kenneth French. The cross-section of expected stock returns. The Journal of Finance, 47(2):427-465, 1992.
- [Fama and French, 1993] Eugene F Fama and Kenneth R French. Common risk factors in the returns on stocks and bonds. Journal of Financial Economics, 33(1):3-56, 1993.
- [Gu et al., 2021] Shihao Gu, Bryan Kelly, and Dacheng Xiu. Autoencoder asset pricing models. Journal of Economet- rics, 222(1):429-450, 2021.
- [Jang et al., 2016] Eric Jang, Shixiang Gu, and Ben Poole. Categorical reparameterization with gumbel-softmax. In Proceedings of the 4th International Conference on Learn- ing Representations, 2016.
- [Kouzelis et al., 2025] Theodoros Kouzelis, Ioannis Kako- georgiou, Spyros Gidaris, and Nikos Komodakis. EQ- VAE: Equivariance regularized latent space for improved generative image modeling. In Proceedings of the 42nd International Conference on Machine Learning, 2025.
- [Kozak et al., 2018] Serhiy Kozak, Stefan Nagel, and Shri- hari Santosh. Interpreting factor models. The Journal of Finance, 73(3):1183-1223, 2018.
- [Lin et al., 2021] Hengxu Lin, Dong Zhou, Weiqing Liu, and Jiang Bian. Learning multiple stock trading patterns with temporal routing adaptor and optimal transport. In Proceedings of the 27th ACM SIGKDD Conference on Knowledge Discovery and Data Mining, pages 1017- 1026, 2021.
- [Liu et al., 2025] Ruirui Liu, Huichou Huang, and Johannes Ruf. Asset pricing with contrastive adversarial variational Bayes. In Proceedings of the 34th International Joint Conference on Artificial Intelligence, pages 7572-7579, 2025. IJCAI
- [Mescheder et al., 2017] Lars Mescheder, Sebastian Nowozin, and Andreas Geiger. Adversarial variational Bayes: Unifying variational autoencoders and generative adversarial networks. In Proceedings of the 34th International Conference on Machine Learning, pages 2391-2400. PMLR, 2017.
- [Ng et al., 1992] Victor Ng, Robert F Engle, and Michael Rothschild. A multi-dynamic-factor model for stock returns. Journal of Econometrics, 52(1-2):245-266, 1992.
- [Qin et al., 2017] Yao Qin, Dongjin Song, Haifeng Chen, Wei Cheng, Guofei Jiang, and Garrison Cottrell. A dual- stage attention-based recurrent neural network for time series prediction. arXiv preprint arXiv:1704.02971, 2017.
- [Veličković et al., 2017] Petar Veličković, Guillem Cucurull, Arantxa Casanova, Adriana Romero, Pietro Lio, and Yoshua Bengio. Graph attention networks. In Proceedings of the 5th International Conference on Learning Represen- tations, 2017.
- [Yang et al., 2024] Xuanling Yang, Zhoufan Zhu, Dong Li, and Ke Zhu. Asset pricing via the conditional quantile variational autoencoder. Journal of Business and Eco- nomic Statistics, 42(2):681-694, 2024.
- [Zhang et al., 2017] Liheng Zhang, Charu Aggarwal, and Guo-Jun Qi. Stock price prediction via discovering multi- frequency trading patterns. In Proceedings of the 23rd ACM SIGKDD Conference on Knowledge Discovery and Data Mining, pages 2141-2149, 2017.
References were extracted automatically from the PDF and may contain errors.
Full text extracted automatically from the PDF; figures, tables and equations may differ. The PDF is the version of record.
1 Introduction
Asset pricing and portfolio recommendation are closely related tasks in quantitative finance. Asset pricing aims to evaluate financial assets by modeling the relationship between risk factors and expected returns using asset characteristics as conditioning information. Portfolio recommendation seeks to identify assets that are expected to outperform their peers while balancing return and risk. This motivates a unified framework for asset pricing and portfolio recommendation.
A typical asset pricing model (APM) is formulated as rt = βft + ϵt, where asset returns rt are decomposed into a systematic component driven by latent factors ft and risk exposures β to these factors, together with an idiosyncratic noise term ϵt ∼ N(0,Σ). Under an asset-pricing interpretation, the systematic component captures priced sources of risk, while ϵt represents idiosyncratic variation. Estimating this equation is challenging because the true latent sources of risk are unobservable to investors, who instead observe a large set of conditioning variables, namely sequences of asset characteristics xt-1 (e.g., firm fundamentals for stocks or market state indicators). These variables help learn feature representations of latent risk factors that are informative about return dynamics.
[Fama and French, 1992; Fama and French, 1993; Carhart, 1997] rely on firm-specific characteristics to construct tradable factor portfolios as proxies for systematic risk. These approaches require prior financial knowledge to identify economically meaningful sources of risk. However, this has led to the proposal of hundreds of factors, giving rise to the 'factor zoo' problem in empirical asset pricing [Cochrane, 2011]. [Kozak et al., 2018] show that cross-sectional return variation can be summarized by a small number of strong factors, implying substantial factor redundancy.
Recent advances in machine learning have introduced a data-driven perspective to asset pricing models. Methods such as [Gu et al., 2021; Yang et al., 2024; Liu et al., 2025] learn risk factors from returns using autoencoder architectures, where beta is modeled as a neural network conditional on asset characteristics, i.e., rt = β(xt-1)f(rt) + ϵt. Since the factor representation depends on contemporaneous returns rt, this formulation is mainly explanatory rather than directly predictive. It relies on the products of the lagged risk quantities β and static estimates (averages) of historical f (also known as risk prices) as the proxy for expected returns. This limits its applicability to downstream portfolio recommendation tasks, where investment decisions must be based on information available before rt is observed. Modeling factor dynamics in an autoregressive manner leads to the following dynamic factor model (DFM) [Ng et al., 1992]: rt = β(xt-1)f(rt-1) + ϵt.
It is worth noting that the DFMs used in [Duan et al., 2022; Duan et al., 2025] differ from the asset pricing framework in that they derive factors directly from asset characteristics. As a result, the betas cannot be interpreted as risk exposures, but merely as predictive parameters. A limitation of such models is that the latent factors are primarily induced from characteristics, which weakens the direct connection to the factor structure in realized asset returns. Moreover, existing approaches often rely on deterministic mappings or fail to account for the inherent distributional uncertainty when learning representations from return and characteristic sequences. This restricts their ability to adapt quickly to changing market conditions. Furthermore, asset characteristics are highly heterogeneous relative to the sparsity of latent factors, making it difficult for models to extract incremental predictive information for asset returns. These limitations suggest three requirements for a unified asset pricing and portfolio recommendation framework: predictive factor dynamics, uncertainty-aware latent representation learning, and adaptive selection of informative characteristics.
To overcome these challenges, we propose a novel DFM, namely da-Vinci, based on dual-adversarial variational priorposterior learning in the Factor and Beta Networks. The model is augmented with probabilistic equivariance regularization (to enhance representation stability in factor learning) and dual adaptive spatio-temporal clustering schemes to dynamically filter noisy and redundant information in returns and characteristics, corresponding to two broad clustering branches: one in the Beta Network for characteristic and inter-asset dependency modeling, and one in the Factor Network for return-structure modeling. It jointly captures the spatio-temporal dynamics of asset characteristics and returns to learn sparse factors and incremental predictive information from diverse characteristics, while explicitly accounting for uncertainty in the latent factor structure and risk pricing relations. Specifically, we adaptively model the spatio-temporal dependencies in asset characteristics and returns to estimate time-varying risk exposures (beta) and latent risk sources. By integrating temporal attention with clustering mechanisms, the model dynamically adapts to changing market states and effectively captures incremental predictive signals from heterogeneous and noisy asset characteristics. Moreover, we leverage stochastic noise to construct the latent factor space from historical return sequences through dual-adversarial training, which enriches the expressiveness of variational inference. The model further improves the stability of latent factor learning and risk pricing by aligning prior and posterior latent factor distributions and enforcing consistency between reconstructed and predicted returns.
Our main contributions are summarized as follows. First, we propose da-Vinci, a dynamic factor model that integrates dual-adversarial variational prior-posterior learning for Factor and Beta Networks with dual adaptive spatio-temporal clustering schemes. Second, we introduce an uncertaintyaware risk-pricing framework that aligns prior and posterior distributions of the latent factors and risk-pricing returns, enforcing consistency between reconstructed and predicted returns. Third, we show through extensive experiments on the comprehensive open-source stock market dataset 'OSAP' [Chen and Zimmermann, 2022] that da-Vinci outperforms baseline methods for time-series forecasting, asset pricing, and financial DFMs across a range of evaluation metrics.
2 Methodology
To connect time-varying asset characteristics with dynamic latent risk factors, we propose a novel framework for asset pricing and return prediction based on dual-adversarial variational Bayes and dual adaptive spatio-temporal clustering. Specifically, we introduce dual-adversarial variational learning into the Factor Network, enabling the construction of a flexible and expressive latent risk factor space with implicit distributions. This design improves the model's capacity to capture diverse and nonlinear risk structures by aligning prior and posterior factor distributions and enforcing consistency between reconstructed and predicted returns. Furthermore, we develop dual adaptive spatio-temporal clustering branches: one in the Beta Network to model characteristic structure and inter-asset dependencies, and one in the Factor Network to model return structures. This improves the framework's ability to handle changing characteristic sequences and previously unseen assets, while dynamically adapting to evolving market conditions. We provide the pseudo-code for training da-Vinci in Online Appendix A.
2.1 The Architecture of da-Vinci
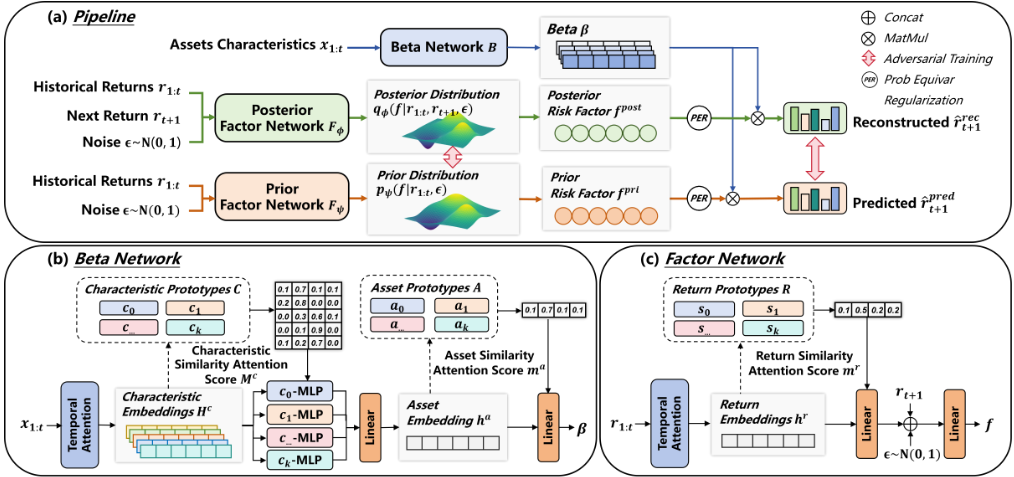
As illustrated in Figure 1(a), da-Vinci consists of four key modules designed to enable dynamic risk factor modeling and accurate asset return prediction. (1) The Beta Network (B) adaptively captures the spatio-temporal dependencies of cross-sectional asset characteristics xt and estimates timevarying risk exposures β, which are used to reconstruct or predict asset returns. (2) The Posterior Factor Network (Fϕ) uses historical returns rt, realized next-period return rt+1, and Gaussian noise ϵ to infer a posterior distribution qϕ(f | rt, rt+1) over latent risk factors. The inferred factors are then combined with the estimated exposures β to reconstruct realized returns during training. (3) The Prior Factor Network (Fψ) models the prior distribution pψ(f | rt) by learning a mapping from historical returns to latent risk representations, enabling return prediction. Unlike traditional asset pricing models that often rely on fixed factor proxies or historical estimates of risk exposures or prices, we leverage an end-toend adversarial Bayesian training framework to learn timevarying latent factors directly from return and factor patterns. This allows the model to adapt more quickly to changing market conditions and improves the robustness of portfolio selection. (4) Adversarial Learning minimizes the distance between the prior and posterior distributions of latent risk factors, as well as the divergence between reconstructed and predicted returns. The entire model is trained by minimizing a joint objective that combines return, clustering, adversarial, and ranking losses, ensuring that robust risk factor estimation can be achieved during inference using only the Prior Factor Network Fψ.
Beta Network
As illustrated in Figure 1(b), we extend the channel clustering framework of [Chen et al., 2024a] to build an adaptive clustering module for the Beta Network. This module groups asset characteristics and assets according to their learned behavior over time, rather than relying on fixed characteristic or asset labels. By updating the cluster prototypes as market conditions evolve, the model can better capture changing cross-sectional dependencies and estimate time-varying factor exposures β.
Adaptive Spatio-Temporal Feature Clustering. Given an asset characteristic sequence xt, each individual characteristic sequence xit is transformed into a d-dimensional embedding hi ∈ Rd through a temporal attention mechanism. Collecting these embeddings yields the characteristic embedding matrix Hc ∈ RC×d , where C is the number of asset characteristics and d is the embedding dimension. To further model temporal dependencies, we perform adaptive clustering on these characteristic embeddings. Specifically, we initialize K learnable characteristic cluster prototypes collected in a matrix C ∈ RK×d , where the k-th row ck ∈ Rd represents the k-th prototype. The probability of assigning the embedding hi of characteristic xit to the k-th prototype cluster is then computed from the similarity score between the prototype ck and the embedding hi as follows:
We adopt the Gumbel-Softmax trick [Jang et al., 2016] to compute the characteristic-cluster similarity matrix Mc ∈ RC×K , where Mci,· = GumbelSoftmax(pi). This allows for a more discriminative and differentiable assignment of characteristics to cluster prototypes. To extract temporal patterns, we associate each cluster with a dedicated MLP. The matrix Mc serves as a soft weighting mechanism for aggregating the outputs of all MLPs. The final feature embedding is computed as a weighted average, followed by a linear projection to obtain the asset-level temporal representation:
During training, to enhance intra-cluster cohesion and reduce inter-cluster interference, we update the characteristic cluster prototypes C using a cross-attention mechanism [Chen et al., 2024a]:
where Wq, Wk, and Wv are learnable projection matrices, and ⊙ denotes element-wise multiplication.
To capture spatial dependencies, i.e., inter-asset correlations, we adopt a similar clustering mechanism. We initialize a set of K asset cluster prototypes A ∈ RK×d and compute the asset-cluster similarity score ma ∈ RK by applying (1) analogously to the asset-level temporal representation ha and the asset prototypes A. The asset prototypes are updated using the same cross-attention mechanism as in (2), with the characteristic embeddings and prototypes replaced by the corresponding asset-level representations and asset prototypes. To efficiently aggregate inter-asset information, especially in large-scale settings, we adopt the update rule ˆha = ha +Linear(maA). Finally, we apply a fully connected layer to generate the risk exposure β = Linear(ˆha ).
Factor Network
As shown in Figure 1(c), the Factor Network learns latent risk factors f from historical return sequences rt. Its architecture is similar to the asset-level clustering module in the Beta Network, but it clusters return patterns rather than asset characteristics.
The input to the Factor Network includes historical returns rt, the next-period return rt+1, and Gaussian noise ϵ. For the Posterior Factor Network, all three inputs are used, whereas for the Prior Factor Network, only rt and ϵ are used.
To capture temporal dependencies in return sequences, we first apply a temporal attention mechanism to rt to obtain the return embedding hr ∈ Rd . We then initialize K learnable return-structure prototypes, collected in a matrix R ∈ RK×d , where the k-th row represents the k-th prototype. The returnstructure similarity score mr ∈ RK is computed between the embedding hr and the prototypes R analogously to (1). Similar to the asset embedding update, we update the returnstructure embedding by ˆhr = hr + Linear(mrR).
Finally, we concatenate the return-structure embedding ˆhr with the next-period return rt+1 and Gaussian noise ϵ for the posterior network, and with Gaussian noise ϵ only for the prior network. The resulting vectors are passed through fully connected layers to obtain the posterior and prior latent factor representations:
The base return loss, consisting of prediction and reconstruction terms, is defined as
The same exposure estimate β from the Beta Network is used to decode both prior and posterior factors.
In latent-factor asset pricing models, deep generative methods such as VAEs learn factors from cross-sectional returns. Although flexible, these latent factors can be unstable: small input perturbations may change their scale or ordering, leading to unstable predictive performance across market conditions. This instability can weaken portfolio construction and risk assessment. To address this issue, we introduce an equivariance-based regularization mechanism in the latent factor space. The idea is motivated by EQ-VAE [Kouzelis et al., 2025], which imposes equivariance constraints on latent representations so that they respond predictably to structured transformations, such as scaling or rotation. In our setting, this regularization encourages latent risk factors to remain stable under controlled perturbations while preserving model flexibility.
Following this idea, we apply structured transformations to the latent factors, such as scaling or linear perturbations, and map the transformed factors back to the return space through the same predictive function. The resulting predictions are required to be consistent with the corresponding transformed returns. This imposes structural constraints on the latent factor space during training, thereby restricting the feasible solutions and encouraging the model to learn factor representations that are more stable and economically coherent. Without introducing additional supervision, this regularization improves the stability of the latent factors and the generalization performance of the model. Formally, we define the probabilistic equivariance regularization loss as
where τ· denotes the scaling transformation operator for latent factor space and return space, respectively.
Furthermore, we adopt a probabilistic equivariance regularization (PER) strategy, in which equivariant transformations are not enforced at every training iteration. Instead, equivariant perturbations are applied to the latent factors with a certain probability, introducing randomness into the regularization. This design preserves model flexibility while maintaining structural constraints, allowing the latent factors to respect the original data distribution while retaining distributional stability under structured perturbations. The resulting return loss is defined as
where p is sampled uniformly from [0, 1] and pα denotes the probability threshold.
Dual-Adversarial Variational Learning
To improve the diversity of latent risk factor representations, we introduce noise sampled from a standard Gaussian distribution as an additional input to the Factor Network. The Posterior and Prior Factor Networks share the same architecture, with the key difference that the posterior network has access to the next-period return rt+1, whereas the prior network does not. Specifically, latent factors are generated as fpost = Fϕ(rt, rt+1, ϵ) and fprior = Fψ(rt, ϵ), where ϵ ∼ N(0, I). By incorporating Gaussian noise and adopting implicit latent distributions, the model avoids the restrictions imposed by predefined parametric distributions and allows flexible latent risk factor structures to be learned.
However, the resulting implicit distributions make the KLdivergence term in the ELBO intractable. To address this issue, we follow AVB [Mescheder et al., 2017] and adopt a Wasserstein generative adversarial network (WGAN) framework to align the posterior distribution qϕ(f | rt, rt+1) and the prior distribution pψ(f | rt) of latent risk factors. Specifically, we train a risk factor critic network Df to distinguish whether a sampled factor f originates from the posterior or prior distribution. The critic objective for aligning prior and posterior risk factor distributions is formulated as
where ˆ f is sampled uniformly along straight lines between pairs of posterior and prior factor samples, and λ is the gradient penalty coefficient.
To further enhance the consistency between predicted and reconstructed returns, we introduce an additional adversarial learning step in the return space. Specifically, we apply the same WGAN-based strategy to distinguish reconstructed returns, decoded from posterior factors, from predicted returns, decoded from prior factors. This auxiliary return critic has a structure analogous to Df and encourages the predicted returns to be distributionally close to those reconstructed from the posterior factors. Let rrec = β·fpost and rpred = β·fprior. The return-level adversarial objective is given by
where ˆ r is sampled uniformly along straight lines between pairs of reconstructed and predicted returns, and λ is the gradient penalty coefficient.
It is worth noting that the use of rt+1 is restricted to the Posterior Factor Network during training. At inference time, rt+1 is unavailable and is never used; latent risk factors are generated solely by the Prior Factor Network Fψ from historical returns and noise. The WGAN critics serve only as training-time alignment mechanisms: the factor critic aligns prior and posterior factor samples, while the return critic aligns predicted and reconstructed returns. This dualadversarial strategy aligns both the latent risk factors and their generated returns across the prior and posterior distributions, thereby improving the coherence, expressiveness, and predictive power of the learned risk structure.
2.2 Loss Function
Since da-Vinci employs an end-to-end adversarial training approach, it jointly optimizes the Factor Networks that generate latent risk factors, the return decoder that reconstructs or predicts returns, and the WGAN critics that align the prior and posterior factor distributions as well as the reconstructed and predicted return distributions. Therefore, we consider the return loss Lret, as introduced above with PER, the adversarial loss Ladv = Lfadv + Lradv as introduced above, and the ranking loss Lrank (introduced below). Furthermore, to enhance the clustering effect and encourage clearer separation between learned clusters, we introduce below a clustering loss Lclus. The total loss is formulated as
Clustering Loss. We adopt the ClusterLoss of [Chen et al., 2024a] to encourage items assigned to the same cluster to have similar representations and to reduce overlap between clusters. The clustering loss is applied to three adaptive clustering modules: characteristic clustering and asset clustering in the Beta Network, and return-structure clustering in the Factor Network. Hence, the total clustering loss is
For each clustering module m ∈ {c, a, r}, let Mm ∈ Rnm×K denote the corresponding soft assignment matrix and let Xm i ∈ Rd denote the representation of the i-th item being clustered. The module-specific clustering loss is defined as
where σ is a scaling factor, Sm is the pairwise similarity matrix for the representations in module m, and Tr denotes the trace operator.
Ranking Loss. In portfolio selection, optimizing the model solely based on reconstruction loss is inadequate, because an important objective is to construct a naive portfolio by investing in a subset of stocks with the highest predicted returns. While the MSE loss minimizes the discrepancy between predicted and actual returns, it does not ensure the correct cross-sectional ranking of returns. [Yang et al., 2024; Liu et al., 2025] find that quantile distribution-based methods, particularly, the contrastive learning approach proposed in CAVB [Liu et al., 2025], can substantially improve naive portfolio performance. To address this limitation of MSE loss and to explicitly consider the prediction rank rather than enforcing it implicitly through quantile distributions, we incorporate the following ranking loss:
3 Experiment
3.1 EvaluationMetrics
This paper is based on an asset pricing framework for portfolio selection. Hence, we adopt three categories of metrics to evaluate the model's asset pricing and portfolio selection performance.
Regression Metrics. To assess return prediction performance in asset pricing, we employ the out-of-sample coefficient of determination R2 , defined as
where ˆ ri,t+1 and ri,t+1 denote the predicted and true returns of stock i at time t + 1, respectively.
RankingMetrics. To evaluate the consistency between the predicted return ranking and the realized return ranking, we employ Spearman's rank correlation coefficient, known in finance as the Rank Information Coefficient (RankIC). Specifically, we define
Additionally, to assess the stability of the predicted return ranking, we introduce the RankICIR metric:
Portfolio Metrics. We select the top ranked stocks based on predicted returns to form an equally weighted investment portfolio. The portfolio return is denoted by Rt = 1K ∑Ki=1 ri,t - ct, where ct represents transaction costs. We adopt Annualized Return (AR), Sharpe Ratio (SR), Maximum Drawdown (MDD), and Calmar Ratio (CR) as evaluation metrics:
Here R denotes the portfolio return series, Vt denotes the cumulative portfolio value, and Vmax t =maxs≤t Vs denotes the running maximum portfolio value.
3.2 Data and Baselines
We evaluate the model's performance on the Open Source Asset Pricing (OSAP) dataset [Chen and Zimmermann, 2022], which integrates comprehensive historical monthly data from the U.S. stock market across the NYSE, AMEX, and NASDAQ universes. We filter stocks to avoid large illiquiditydriven premia and drop those with significant missing data (see Online Appendix B for the criteria and steps). Our dataset contains N = 405 stocks and C = 96 firm characteristics, where the historical data window for each stock is required to be longer than L = 60 months to ensure sufficient information for learning temporal dependencies. The dataset is partitioned into three sub-periods: 1980/012007/12 for training, 2008/01-2009/12 for validation, and 2010/01-2023/12 for testing. Implementation details are delegated to Online Appendix C.
We compare da-Vinci with two major categories of baseline models. The first group consists of deep learning-based time-series forecasting models that directly predict asset returns, including SFM [Zhang et al., 2017], GAT [Veliˇckovi´c et al., 2017], ALSTM [Qin et al., 2017], TRA [Lin et al., 2021], and AdaRNN [Du et al., 2021]. The second group consists of established APMs and state-of-the-art DFMs for predicting asset returns, including AGDL [Chatigny et al., 2021], AP-Tree [Bryzgalova et al., 2025], GAN [Chen et al., 2024b], CAE [Gu et al., 2021], CQVAE [Yang et al., 2024], CAVB [Liu et al., 2025], FactorVAE [Duan et al., 2022], and FactorGCL [Duan et al., 2025].
3.3 Performance Evaluation
Table 3.3 presents a comparison of empirical results on the benchmark dataset OSAP. We conduct extensive experiments with da-Vinci and diverse baselines across various evaluation metrics, including predictive accuracy, ranking accuracy, and portfolio performance.
Return Prediction Results. Several static APM baselines, such as AGDL, AP-Tree, GAN, CAE, and CQVAE, exhibit weaker predictive performance than the strongest time-series and dynamic factor models. This weaker performance is consistent with their static treatment of the risk-pricing relationship, which neglects temporal dynamics inherent in the factor space. In contrast, TSMs, such as SFM, GAT, and ALSTM, explicitly incorporate temporal and spatial information and thereby achieve better prediction accuracy. This is also reflected in the stronger performance of DFMs, although their factor representations are primarily optimized for prediction rather than explicit asset-pricing interpretation. Notably, daVinci outperforms all competing baselines, achieving the highest R2 of 1.061%, indicating its superior predictive capability in capturing complex and evolving temporal patterns and spatial dependencies among assets.
Asset Ranking Results. Accurate ranking of predicted asset returns directly affects portfolio performance. Ranking performance is evaluated using the RankIC and RankICIR, respectively. Models that account for both temporal and spatial dependencies, such as FactorVAE and FactorGCL, tend to perform better. CAVB is the runner-up in the ranking performance, possibly due to its quantile distribution-based contrastive learning capability. da-Vinci substantially outperforms the competing models by large margins, achieving the highest RankIC of 4.584% and RankICIR of 37.006%, indicating strong ranking accuracy and stability.
Portfolio Selection Results. To assess the economic value of predictive accuracy, we invest in the assets with the top 10% predicted returns and compute portfolio metrics net of 30 basis points transaction costs. We also report cumulative portfolio values for the top 10% and 20% strategies in Figure E.1 of the Online Appendix. Generally speaking, models with a static treatment of risk-pricing relations yield weaker prediction and ranking results, while methods with stronger temporal modeling capability, such as FactorVAE and FactorGCL, deliver better risk-adjusted returns. Although CAVB yields the highest AR, its risk-adjusted return SR and downside protection, such as CR and MDD, are worse than da-Vinci. da-Vinci delivers the strongest overall portfolio performance, achieving the best SR of 0.894, CR of 0.523, and MDD of 28.601%, while attaining the secondbest AR of 15.984%. These results demonstrate its ability to translate predictive ranking accuracy into practical portfolio recommendation performance.
3.4 Ablation Study and Sensitivity Analysis
We first conduct an ablation study on the proposed da-Vinci to demonstrate the effectiveness of each module, followed by a sensitivity analysis on three key hyperparameters, i.e., number of factors, number of clustering prototypes, and PER threshold, to examine its performance stability. The specific model variants considered in the ablation and sensitivity analysis as well as the corresponding results (see Table 2) are summarized as follows:
- w/o Clus.: We remove the adaptive clustering scheme (ACS) from all networks, using only temporal attention to extract temporal information and convolutional layers to capture correlations among assets. The results show that ACS is an important spatio-temporal filtering mechanism: by reducing noisy and redundant information in the characteristic and return spaces, it helps identify incremental predictive information aligned with the sparse factor structure of returns. This improves overall
| Model | R2 (%)↑ | RankIC(%)↑ | RankICIR(%)↑ | AR(%)↑ | SR↑ | CR↑ | MDD(%)↓ |
|---|---|---|---|---|---|---|---|
| SFM | 0.910 ± 0.283 | 0.398 ± 0.154 | 4.135 ± 4.130 | 12.493 ± 1.718 | 0.819 ± 0.089 | 0.405 ± 0.071 | 31.031 ± 1.860 |
| GAT | 0.887 ± 0.272 | 0.144 ± 0.108 | 4.685 ± 1.067 | 13.836 ± 2.459 | 0.822 ± 0.108 | 0.447 ± 0.109 | 31.374 ± 2.918 |
| ALSTM | 0.877 ± 0.163 | 0.571 ± 0.041 | 5.718 ± 0.852 | 13.550 ± 1.158 | 0.836 ± 0.085 | 0.390 ± 0.074 | 35.456 ± 5.094 |
| TRA | 0.274 ± 0.135 | 0.324 ± 0.048 | 2.133 ± 0.530 | 12.356 ± 4.493 | 0.614 ± 0.217 | 0.293 ± 0.118 | 44.447 ± 8.267 |
| AdaRNN | 0.609 ± 0.254 | 0.373 ± 0.087 | 1.164 ± 0.748 | 12.433 ± 1.134 | 0.720 ± 0.050 | 0.392 ± 0.079 | 32.741 ± 6.980 |
| AGDL | 0.809 ± 0.452 | 1.675 ± 0.310 | 3.566 ± 1.416 | 9.134 ± 1.366 | 0.386 ± 0.093 | 0.165 ± 0.049 | 56.311 ± 4.505 |
| AP-Tree | 0.503 ± 0.237 | 0.733 ± 0.161 | 3.320 ± 0.557 | 10.312 ± 1.933 | 0.591 ± 0.130 | 0.376 ± 0.072 | 38.850 ± 8.561 |
| GAN | 0.423 ± 0.267 | 0.837 ± 0.191 | 4.851 ± 0.651 | 11.313 ± 1.024 | 0.609 ± 0.127 | 0.439 ± 0.056 | 42.029 ± 6.357 |
| CAE | 0.562 ± 0.170 | 0.628 ± 0.121 | 5.078 ± 0.896 | 13.239 ± 3.082 | 0.675 ± 0.139 | 0.277 ± 0.096 | 49.041 ± 5.315 |
| CQVAE | 0.474 ± 0.125 | 0.844 ± 0.129 | 1.442 ± 0.538 | 10.765 ± 2.501 | 0.467 ± 0.107 | 0.210 ± 0.076 | 53.462 ± 9.119 |
| CAVB | 1.044 ± 0.220 | 2.388 ± 0.126 | 15.631 ± 0.712 | 16.942 ± 0.955 | 0.886 ± 0.052 | 0.419 ± 0.0438 | 40.740 ± 4.45 |
| FactorVAE | 0.904 ± 0.112 | 0.761 ± 0.046 | 9.973 ± 0.624 | 13.022 ± 1.648 | 0.754 ± 0.057 | 0.412 ± 0.056 | 31.889 ± 4.288 |
| FactorGCL | 1.010 ± 0.320 | 1.213 ± 0.171 | 13.931 ± 3.704 | 13.812 ± 0.630 | 0.809 ± 0.008 | 0.454 ± 0.021 | 30.420 ± 0.629 |
| da-Vinci | 1.061 ± 0.249 | 4.584 ± 0.141 | 37.006 ± 3.162 | 15.984 ± 1.716 | 0.894 ± 0.077 | 0.523 ± 0.068 | 28.601 ± 3.528 |
Note: '↑' indicates that larger values are better, while '↓' indicates that smaller values are better. The best and second-best results are highlighted in bold and with an underline, respectively. Results are averaged over five runs, with standard deviations reported after '±'.
Table 1: Performance Comparison on OSAP Dataset.
performance across all evaluation metrics, particularly in downside risk protection.
- w/o Adv.(f/r): We partially remove either factor-level or return-level adversarial learning, and also consider a variant that completely removes dual-adversarial learning (DAL) and relies only on the KL divergence to optimize the distance between the prior and posterior factor distributions. As shown by the performance deterioration, each component of DAL contributes to overall performance, while the combination of both components performs best, suggesting that factor-level and returnlevel adversarial learning are complementary.
- w/o PER: We remove PER from the encoder-decoder structure and use a standard VAE. The results indicate that PER particularly improves asset-ranking performance, suggesting that it provides a meaningful regularization effect rather than a purely cosmetic modification.
- w/o Rank: We remove the ranking loss. As expected, the ranking loss is crucial for improving ranking performance. More importantly, it substantially improves portfolio performance across all four evaluation metrics.
- NoLFs: We evaluate the impact of the number of latent factors (NoLFs) on model performance, which exhibits an inverted-U-shaped pattern in the results. Increasing the NoLFs from 8 to 16 improves model performance, whereas increasing the NoLFs to 32 leads to performance deterioration.
The results and discussion of the additional sensitivity analysis are reported in Table D.1 in the Online Appendix. The results show that the performance of da-Vinci is relatively stable with respect to the number of clustering prototypes (NoCPs) or the PER threshold (PER pα.). We find similar mild inverted-U-shaped patterns. Moderately increasing the values of NoCPs and PER threshold improves the performance of da-Vinci.
| Model | R2(%)↑ | RankIC(%)↑ | RankICIR(%)↑ | AR(%)↑ | SR↑ CR↑ | MDD(%)↓ |
|---|---|---|---|---|---|---|
| w/o Clust. | 0.876 | 3.032 | 23.559 | 14.697 | 0.824 0.429 | 33.952 |
| w/o Adv(r) | 0.900 | 3.979 | 27.687 | 14.491 | 0.819 0.468 | 31.899 |
| w/o Adv(f) | 0.813 | 3.527 | 25.657 | 14.128 | 0.812 0.386 | 34.561 |
| w/o Adv. | 0.709 | 2.634 | 20.352 | 13.551 | 0.764 0.362 | 32.588 |
| w/o PER | 1.039 | 2.927 | 22.349 | 14.825 | 0.842 0.502 | 29.958 |
| w/o Rank | 0.917 | 2.462 | 19.561 | 13.313 | 0.795 0.379 | 36.427 |
| NoLFs: 8 | 0.827 | 4.279 | 32.671 | 15.102 | 0.864 0.436 | 30.420 |
| NoLFs: 16 | 1.061 | 4.584 | 37.006 | 15.984 | 0.894 0.523 | 28.601 |
| NoLFs: 32 | 0.617 | 2.369 | 12.359 | 13.236 | 0.657 0.312 | 41.106 |
4 Conclusion
We propose da-Vinci, a novel dual-adversarial variational asset pricing framework that combines asset pricing and portfolio recommendation under a unified DFM. By integrating adaptive spatio-temporal clustering mechanisms into the Factor and Beta Networks, we allow the model to learn spatiotemporal clustering structures embedded in both asset characteristics and returns in a temporally aware manner. This reconciles sparse factors with diverse characteristics and boosts the model's capability to identify incremental predictive information for returns. By introducing probabilistic equivariance regularization and dual-adversarial learning based on the Wasserstein distance into the Factor and Beta Networks, we enable the model to align the prior and posterior distributions of latent factors, enforce consistency between reconstructed and predicted returns, and explicitly address uncertainty in the latent factor structure and risk-pricing relations under changing market conditions. Extensive experiments on the comprehensive benchmark demonstrate its superior and stable performance in both predictive accuracy and portfolio recommendation compared with representative baselines in time-series forecasting, asset pricing, and financial DFMs. Ablation studies confirm the importance of each component, including dual-adversarial variational inference and adaptive clustering, in delivering robust financial decision-making.
Acknowledgments
We thank the referees for insightful comments and helpful suggestions. This work was supported by National Natural Science Foundation of China (NSFC) 62272172 and the Fundamental Research Funds for the Central Universities 2025ZYGXZR095.
Contribution Statement
Yupeng Fang and Ruirui Liu contributed equally to this research. Huichou Huang and Qingyao Wu are corresponding authors.
@inproceedings{ijcai2026p288,
  title     = {Dual-Adversarial Dynamic Variational Asset Pricing with Adaptive Spatio-Temporal Feature Clustering for Portfolio Recommendation},
  author    = {Fang, Yupeng and Liu, Ruirui and Xia, Xinyu and Huang, Huichou and Ruf, Johannes and Wu, Qingyao},
  booktitle = {Proceedings of the Thirty-Fifth International Joint Conference on
               Artificial Intelligence, {IJCAI-26}},
  publisher = {International Joint Conferences on Artificial Intelligence Organization},
  editor    = {Diego Calvanese},
  pages     = {2590--2598},
  year      = {2026},
  month     = {8},
  note      = {Main Track},
  doi       = {10.24963/ijcai.2026/288},
  url       = {https://doi.org/10.24963/ijcai.2026/288},
}
TY - CPAPER TI - Dual-Adversarial Dynamic Variational Asset Pricing with Adaptive Spatio-Temporal Feature Clustering for Portfolio Recommendation AU - Fang, Yupeng AU - Liu, Ruirui AU - Xia, Xinyu AU - Huang, Huichou AU - Ruf, Johannes AU - Wu, Qingyao T2 - Proceedings of the Thirty-Fifth International Joint Conference on Artificial Intelligence, IJCAI-26 PB - International Joint Conferences on Artificial Intelligence Organization PY - 2026 SP - 2590 EP - 2598 DO - 10.24963/ijcai.2026/288 UR - https://doi.org/10.24963/ijcai.2026/288 ER -Copied
Machine-readable versions of this paper, for tools and AI agents:





