---
title: "Integrating LLM, VLM, and Text-to-Image Models for Enhanced Information Graphics: A Methodology for Accurate and Visually Engaging Visualizations"
authors:
- "Chao-Ting Chen"
- "Hen-Hsen Huang"
doi: "10.24963/ijcai.2024/995"
url: "https://ijcai.org/proceedings/2024/995"
pdf: "https://ijcai.org/proceedings/2024/0995.pdf"
venue: "Proceedings of the Thirty-Third International Joint Conference on Artificial Intelligence"
year: 2024
pages: "8627-8630"
track: "Demo Track"
keywords:
- "Humans and AI: HAI: Intelligent user interfaces"
- "Computer Vision: CV: Vision and language"
- "Multidisciplinary Topics and Applications: MDA: Arts and creativity"
---
# Integrating LLM, VLM, and Text-to-Image Models for Enhanced Information Graphics: A Methodology for Accurate and Visually Engaging Visualizations
Chao-Ting Chen, Hen-Hsen Huang
*Proceedings of the Thirty-Third International Joint Conference on Artificial Intelligence*, pages 8627-8630. DOI: [10.24963/ijcai.2024/995](https://doi.org/10.24963/ijcai.2024/995)
## Abstract
This study presents an innovative approach to the creation of information graphics, where the accuracy of content and aesthetic appeal are of paramount importance. Traditional methods often struggle to balance these two aspects, particularly in complex visualizations like phylogenetic trees. Our methodology integrates the strengths of Large Language Models (LLMs), Vision Language Models (VLMs), and advanced text-to-image models to address this challenge. Initially, an LLM plans the layout and structure, employing Mermaid—a JavaScript-based tool that uses Markdown-like scripts for diagramming—to establish a precise and structured foundation. This structured script is crucial for ensuring data accuracy in the graphical representation. Following this, text-to-image models are employed to enhance the vector graphic generated by Mermaid, adding rich visual elements and enhancing overall aesthetic appeal. The integration of text-to-image models is a key innovation, enabling the creation of graphics that are not only informative but also visually captivating. Finally, a VLM performs quality control, ensuring that the visual enhancements align with the informational accuracy. This comprehensive approach effectively combines the accuracy of structured data representation, the creative potential of text-to-image models, and the validation capabilities of VLMs. The result is a new standard in information graphic creation, suitable for diverse applications ranging from education to scientific communication, where both information integrity and visual engagement are essential.
## Full text
## 1 Introduction
In the realm of artificial intelligence, advancements in natural language processing and image generation have paved the way for innovative applications across various domains [Zhang et al., 2023]. Large language models (LLM) [Schulman et al., 2022; Achiam et al., 2023] have demonstrated remarkable proficiency in understanding and generating human-like text, while text-to-image models such as DALL-E [Shi et al., 2020] and Midjourney 1 have captivated audiences with its ability to generate diverse and creative images from textual descriptions. However, a significant challenge remains in bridging the gap between textual and visual representations, particularly in the creation of information graphics [Huang et al., 2024; Dibia, 2023].
In the evolving landscape of data visualization and information communication, the challenge of accurately representing complex data structures while maintaining visual appeal is paramount. Information graphics, such as phylogenetic trees, play a crucial role in various fields, including biology, education, and data science. However, the existing approach of using text-to-image models often leads to a compromise between the factual correctness of the content and its aesthetic representation.
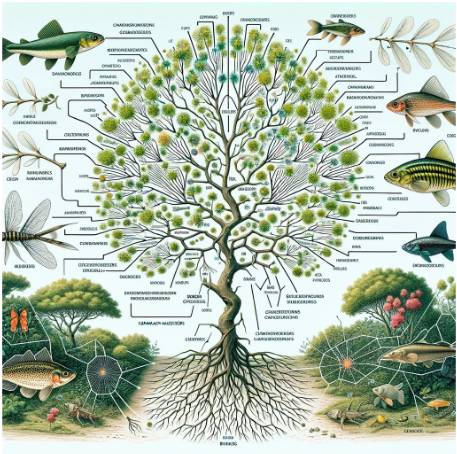
Figure 1 displays a phylogenetic tree created with DALLE 3. While aesthetically pleasing, the content it depicts lacks accuracy and meaningfulness. Additionally, a common limitation of text-to-image models is evident here: the textual information within the figure is indecipherable, reflecting a well-known shortcoming in text-to-image generation. User control over output correctness remains challenging.
This research introduces an innovative methodology that synergizes LLMs, Vision Language Models (VLMs), and advanced text-to-image models to overcome this challenge, aiming to produce information graphics that are both visually engaging and accurate in content. Our approach begins with the use of an LLM for initial planning and layout of the information graphic. The LLM's role is to understand the intricacies of the data and conceptualize a structure that best represents it. This planning phase is critical as it sets the foundation for the accuracy and comprehensibility of the final graphic. To translate this plan into a tangible layout, we utilize Mermaid, a JavaScript-based diagramming tool. Mermaid's ability to render Markdown-inspired text definitions into dynamic diagrams makes it an ideal choice for creating structured, accurate representations of complex data relationships, such as those found in phylogenetic trees.
Once the structural foundation is laid out by the LLM and rendered by Mermaid, the methodology introduces the use of text-to-image models. These models serve to enhance the vector graphics created by Mermaid, adding a layer of visual sophistication and appeal. This step is where the creative potential of AI comes into play, transforming a structurally sound diagram into a visually captivating piece of information art. The integration of text-to-image models is a key innovation of our approach, enabling us to bridge the gap between informative and aesthetically pleasing graphics.
[1 https://www.midjourney.com/home](https://www.midjourney.com/home)
Figure 1: A phylogenetic tree generated by using DALL-E 3. Although it looks fancy, the information it depicts is non-sense and meaningless.
Finally, to ensure the integrity and coherence of the enhanced graphic, a VLM is employed for quality control. This stage is crucial as it validates the accuracy of both the content and its visual representation. The VLM assesses whether the enhancements made by the text-to-image models align with the factual data and maintains the overall clarity of the information presented.
This research aims to set a new standard in the creation of information graphics. By leveraging the unique capabilities of LLMs for structure and content planning, text-to-image models for visual enhancement, and VLMs for final validation, we present a comprehensive solution that addresses the dual needs of accuracy and aesthetic appeal in data visualization. This methodology has the potential to revolutionize the way complex information is communicated, making it more accessible and engaging for a wider audience. Our contributions are threefold as follows:
1. Innovative AI Technology Integration: This work pioneers the integration of Large Language Models, Vision Language Models, and text-to-image models, establishing a novel approach for creating information graphics that are both accurate and visually appealing.
2. Enhanced Accuracy in Data Representation: The methodology significantly improves the precision of complex data visualizations, using LLMs for detailed structure planning and Mermaid for accurate graphical
3. layouts, setting new standards in data representation accuracy.
3. Aesthetic Enhancement of Information Graphics: The integration of text-to-image models elevates the visual appeal of information graphics, making complex data more accessible and engaging to a wider audience without compromising informational integrity.
## 2 SystemOverview
With our system, the user can create an information graphic with a simple prompt. Then the prompt will be processed in the following four steps to yield the final outcome.
1. Planning with LLM: Initially, the LLM is utilized to plan the overall layout and structure of the information graphic. This involves understanding the content requirements (like the specific family of animals for a phylogenetic tree) and determining the best way to visually represent this information. In our system, GPT-4, one of the most powerful LLM so far, is served as the LLM.
2. Script Generation in Mermaid: The LLM then generates a script in Mermaid, a tool that uses Markdowninspired text to create diagrams. This script will define the structure and layout of the information graphic. Mermaid is particularly suitable for this task as it's designed to handle structured data and relationships, making it ideal for things like phylogenetic trees.
3. Enhancement with Text-to-Image Models: Once the basic structure is in place, text-to-image models are used to enhance and illustrate the vector graphic created by Mermaid. This step adds visual appeal, making the graphic more engaging and easier to understand for a broader audience. It can add realistic textures, colors, and other visual elements that make the diagram more visually compelling. In this work, we employ DALL-E 3 as the text-to-image model.
4. Quality Control with VLM: Finally, a VLM checks the outcome. This step is crucial for ensuring that the visual enhancements do not distort or misrepresent the information. The VLM can verify the accuracy of both the text and the visual representation, ensuring that the final product is both informative and aesthetically pleasing. In our system, we further employ GPT-4 as the VLM for monitoring the outcomes.
Figure 2 shows an example of a phylogenetic tree being generated by our system. This process leverages the strengths of both LLMs and VLMs. The LLM ensures the accuracy and appropriateness of the content and structure, while the VLM and text-to-image models enhance the visual presentation. The result is a more accurate, informative, and visually appealing information graphic.
This method could significantly improve the way complex information is conveyed, making it more accessible and engaging, especially for educational purposes or in scientific communication. It's a promising direction for the development of AI-assisted graphic design and data visualization.
## User Prompt: Please give me an image of structure of phylogenetic tree.
```
Information Graphic Layout in MERMAID Script graph TD Carnivora [Common Ancestor
Carnivora] -->|divergence| Caniformia [Caniformia] Carnivora -->|divergence| Feliformia [Feliformia] Caniformia -->|divergence| Ursidae [Bear Family
Ursidae] Caniformia -->|divergence| Mustelidae [Weasel Family
Mustelidae] Caniformia -->|divergence| Canidae [Dog Family
Canidae] Feliformia -->|divergence| Felidae [Cat Family
Felidae] Feliformia -->|divergence| Hyaenidae [Hyena Family
Hyaenidae] Feliformia -->|divergence| Viverridae [Civet Family