
Exploring Structural Similarity in Fitness Landscapes via Graph Data Mining: A Case Study on Number Partitioning Problems
Proceedings of the Thirty-Second International Joint Conference on Artificial Intelligence. Main Track. Pages 5595-5603.
https://doi.org/10.24963/ijcai.2023/621
Keywords
- Search: S: Combinatorial search and optimisation
- Data Mining: DM: Data visualization
- Data Mining: DM: Exploratory data mining
- Data Mining: DM: Mining graphs
Abstract
One of the most common problem-solving heuristics is by analogy. For a given problem, a solver can be viewed as a strategic walk on its fitness landscape. Thus if a solver works for one problem instance, we expect it will also be effective for other instances whose fitness landscapes essentially share structural similarities with each other. However, due to the black-box nature of combinatorial optimization, it is far from trivial to infer such similarity in real-world scenarios. To bridge this gap, by using local optima network as a proxy of fitness landscapes, this paper proposed to leverage graph data mining techniques to conduct qualitative and quantitative analyses to explore the latent topological structural information embedded in those landscapes. In our experiments, we use the number partitioning problem as the case and our empirical results are inspiring to support the overall assumption of the existence of structural similarity between landscapes within neighboring dimensions. Besides, experiments on simulated annealing demonstrate that the performance of a meta-heuristic solver is similar on structurally similar landscapes.
- [Benesty et al., 2009] J. Benesty, J. Chen, Y. Huang, and I. Cohen. Pearson correlation coefficient. In Noise re- duction in speech processing, pages 1-4. Springer, 2009.
- [Blum and Roli, 2003] C. Blum and A. Roli. Metaheuristics in combinatorial optimization: Overview and conceptual comparison. ACM Comput. Surv., 35(3):268-308, 2003.
- [Boccaletti et al., 2006] S. Boccaletti, V. Latora, Y. Moreno, M. Chavez, and D-U Hwang. Complex networks: Struc- ture and dynamics. Phys. Rep., 424(4-5):175-308, 2006.
- [Colizza et al., 2006] V. Colizza, A. Flammini, M Angeles Serrano, and A. Vespignani. Detecting rich-club order- ing in complex networks. Nature Physics, 2(2):110-115, 2006.
- [Corder and Foreman, 2014] Gregory W Corder and Dale I Foreman. Nonparametric statistics: A step-by-step ap- proach. John Wiley & Sons, 2014.
- [Gibson et al., 2013] H. Gibson, J. Faith, and P. Vickers. A survey of two-dimensional graph layout techniques for in- formation visualisation. Inf. Vis., 12(3-4):324-357, 2013.
- [Goyal and Ferrara, 2018] P. Goyal and E. Ferrara. Graph embedding techniques, applications, and performance: A survey. Knowl. Based Syst., 151:78-94, 2018.
- [Herman et al., 2000] I. Herman, G. Melanc ¸on, and M. S. Marshall. Graph visualization and navigation in informa- tion visualization: A survey. IEEE Trans. Vis. Comput. Graph., 6(1):24-43, 2000.
- [Herrmann et al., 2018] S. Herrmann, G. Ochoa, and F. Rothlauf. Pagerank centrality for performance predic- tion: the impact of the local optima network model. J. Heuristics, 24(3):243-264, 2018.
- [Iclanzan et al., 2014] D. Iclanzan, F. Daolio, and M. Tomassini. Data-driven local optima network characterization of QAPLIB instances. In GECCO'14: Proc. of the 2014 Genetic and Evolutionary Computation Conference, pages 453-460. ACM, 2014.
- [Kendall, 1938] MG. Kendall. A new measure of rank cor- relation. Biometrika, 30(1/2):81-93, 1938.
- [Kirkpatrick et al., 1983] S. Kirkpatrick, C. D. Gelatt, and M. P. Vecchi. Optimization by simulated annealing. Sci- ence, 220(4598):671-680, 1983.
- [Korf, 1998] R. E. Korf. A complete anytime algorithm for number partitioning. Artif. Intell., 106(2):181-203, 1998.
- [Liefooghe et al., 2020] A. Liefooghe, F. Daolio, S. Vérel, B. Derbel, H. E. Aguirre, and K. Tanaka. Landscape-aware performance prediction for evolutionary multiobjective optimization. IEEE Trans. Evol. Comput., 24(6):1063- 1077, 2020.
- [Malan, 2021] K. M. Malan. A survey of advances in land- scape analysis for optimisation. Algorithms, 14(2):40, 2021.
- [McInnes and Healy, 2018] L. McInnes and J. Healy. UMAP: uniform manifold approximation and projection for dimension reduction. CoRR, abs/1802.03426, 2018.
- [Mersmann et al., 2011] O. Mersmann, B. Bischl, H. Traut- mann, M. Preuss, C. Weihs, and G. Rudolph. Exploratory landscape analysis. In GECCO'11: Proc. of the Genetic and Evolutionary Computation Conference Companion, pages 829-836. ACM, 2011.
- [Muñoz et al., 2015] M. A. Muñoz, Y. Sun, M. Kirley, and S. K. Halgamuge. Algorithm selection for black-box con- tinuous optimization problems: A survey on methods and challenges. Inf. Sci., 317:224-245, 2015.
- [Ochoa and Herrmann, 2018] G. Ochoa and S. Herrmann. Perturbation strength and the global structure of QAP fit- ness landscapes. In PPSN'XV: Proc. of the 15th Interna- tional Conference on Parallel Problem Solving from Na- ture, volume 11102, pages 245-256. Springer, 2018.
- [Ochoa and Malan, 2019] G. Ochoa and K. Malan. Recent advances in fitness landscape analysis. In GECCO'19: Proc. of the Genetic and Evolutionary Computation Con- ference Companion, pages 1077-1094. ACM, 2019.
- [Ochoa et al., 2008] G. Ochoa, M. Tomassini, S. Vérel, and C. Darabos. A study of NK landscapes' basins and local optima networks. CoRR, abs/0810.3484, 2008.
- [Ochoa et al., 2015] G. Ochoa, N. Veerapen, L. D. Whitley, and E. K. Burke. The multi-funnel structure of TSP fit- ness landscapes: A visual exploration. In EA: Proc. of the 12th International Conference, Evolution Artificielle, vol- ume 9554, pages 1-13. Springer, 2015.
- [Ou et al., 2016] M. Ou, P. Cui, J. Pei, Z. Zhang, and W. Zhu. Asymmetric transitivity preserving graph embedding. In SIGKDD'22: Proc. of the 22nd ACM International Con- ference on Knowledge Discovery and Data Mining, pages 1105-1114. ACM, 2016.
- [Richter, 2012] H. Richter. Fitness landscapes and evolution- ary dynamics. In Nostradamus: Modern Methods of Pre- diction, Modeling and Analysis of Nonlinear Systems, vol- ume 192 of Adv. Intell. Syst. Comput., pages 5-8. Springer, 2012.
- [Rozemberczki and Sarkar, 2020] B. Rozemberczki and R. Sarkar. Characteristic functions on graphs: Birds of a feather, from statistical descriptors to parametric models. In CIKM'20: Proc. of the 29th ACM International Conference on Information and Knowledge Management, pages 1325-1334. ACM, 2020.
- [Smith-Miles and Tan, 2012] K. Smith-Miles and T. T. Tan. Measuring algorithm footprints in instance space. In CEC'12: Proc. of the IEEE Congress on Evolutionary Computation, pages 1-8. IEEE, 2012.
- [Smith-Miles et al., 2014] K. Smith-Miles, D. Baatar, B. Wreford, and R. Lewis. Towards objective measures of algorithm performance across instance space. Comput. Oper. Res., 45:12-24, 2014.
- [Stadler, 2002] P. F. Stadler. Fitness landscapes, pages 183- 204. Springer, 2002.
- [Stillinger, 1995] F. H. Stillinger. A topographic view of supercooled liquids and glass formation. Science, 267(5206):1935-1939, 1995.
- [Stützle, 2006] T. Stützle. Iterated local search for the quadratic assignment problem. Eur. J. Oper. Res., 174(3):1519-1539, 2006.
- [Tayarani-N and Prügel-Bennett, 2014] M.-H. Tayarani-N and A. Prügel-Bennett. On the landscape of combinatorial optimization problems. IEEE Trans. Evol. Comput., 18(3):420-434, 2014.
- [Veerapen and Ochoa, 2018] N. Veerapen and G. Ochoa. Vi- sualising the global structure of search landscapes: genetic improvement as a case study. Genet. Program. Evolvable Mach., 19(3):317-349, 2018.
- [Vérel et al., 2011] S. Vérel, F. Daolio, G. Ochoa, and M. Tomassini. Local optima networks with escape edges. In EA'10: Proc. of the 10th International Conference on Evolution Artificielle, volume 7401, pages 49-60. Springer, 2011.
- [Vérel et al., 2018] S. Vérel, F. Daolio, G. Ochoa, and M. Tomassini. Sampling local optima networks of large combinatorial search spaces: The QAP case. In PPSN'XV: Proc. of the 15th International Conference on Parallel Problem Solving from Nature, volume 11102, pages 257- 268. Springer, 2018.
- [Wang et al., 2018] M. Wang, B. Li, G. Zhang, and X. Yao. Population evolvability: Dynamic fitness landscape anal- ysis for population-based metaheuristic algorithms. IEEE Trans. Evol. Comput., 22(4):550-563, 2018.
- [Wright, 1932] S. Wright. The roles of mutations, inbreed- ing, crossbreeding and selection in evolution. In Proc. of the 11th International Congress of Genetics, volume 1, pages 356-366, 1932.
- [Zhang et al., 2020] D. Zhang, J. Yin, X. Zhu, and C. Zhang. Network representation learning: A survey. IEEE Trans. Big Data, 6(1):3-28, 2020.
- [Zou et al., 2022] F. Zou, D. Chen, H Liu, S. Cao, X. Ji, and Y. Zhang. A survey of fitness landscape analysis for opti- mization. Neurocomputing, 503:129-139, 2022.
References were extracted automatically from the PDF and may contain errors.
Full text extracted automatically from the PDF; figures, tables and equations may differ. The PDF is the version of record.
1 Introduction
Black-box optimization problems (BBOPs), originated from black-box concepts in cybernetics, are ubiquitous in the real world. Since there does not exist any analytical form or authentic solution for a BBOP, it is hard to interpret and investigate except for an observation of input-output response through experimentation. Fitness landscape analysis has been widely recognized as a major approach for analyzing and understanding the characteristics of BBOPs in the metaheuristic community [Zou et al., 2022]. In particular, it is noticed that there exist certain patterns or structures associated with the fitness landscape of a BBOP, rather than a full randomness [Tayarani-N and Pr¨ugel-Bennett, 2014].
In practice, one of the most common problem-solving approaches is by analogy. Its basic assumption is that if a BBOP solver is effective for one problem, we can expect its effectiveness for solving other problems belonging to the same category whose fitness landscapes essentially share structural similarities with each other. In other words, the strategic walk on the fitness landscape induced by the solver may be extended to fitness landscapes of similar problems that are anticipated to share certain patterns or sub-structures but vary in different sizes or volumes. Thus the inference of such similarity would not only deepen our understanding of the solver's behavior [Wang et al., 2018] but also facilitate the design/selection of BBOP solvers with respect to its fitness landscape potentially [Mu˜noz et al., 2015]. However, it is in practice far from trivial to infer such similarity in fitness landscapes when encountering BBOPs due to the lack of descriptive methods for modeling fitness landscapes.
In recent two decades and beyond, there have been many efforts devoted to developing computational models of fitness landscape [Richter, 2012], among which local optima networks (LONs) [Ochoa et al., 2008] have become the most popular one in the meta-heuristic community [Malan, 2021]. LONs are rooted in the study of energy landscapes in chemical physics [Stillinger, 1995] and its basic idea is to model the fitness landscape as a graph. In particular, the vertices of a LON are local optima and the edges indicate certain search dynamics of a meta-heuristic algorithm. Since LONs are able to capture various characteristics of the underlying landscape (e.g., the number of local optima, their distribution and connectivity pattern), they are powerful tools for fitness landscape analysis [Ochoa and Malan, 2019]. In particular, the graph nature of LONs allows researchers to take advantage of many tools developed for analyzing complex networks, e.g., network metrics [Boccaletti et al., 2006], graph visualization methods [Gibson et al., 2013], network representation learning (NRL) techniques [Zhang et al., 2020], to effectively explore LONs and thus advance the understanding of the corresponding fitness landscapes.
With the application of LON and various graph mining techniques, in this paper, we seek to gain constructive insights into the potential existence of structural similarity among different combinatorial landscapes. To the best of our knowledge, there is no dedicated research to infer or measure such similarity in the related literature. To bridge this gap, this work takes the first step towards this direction, with the focus on the landscapes of number partitioning problem (NPP).
Towards this end, we first apply a LON construction routine to build a coarse-grained model to represent the fitness landscapes of NPP at various dimensions, i.e, different numbers of items to partition. We then use the generated LONs as the driver to conduct exploratory landscape analysis (ELA) [Mersmann et al., 2011] on the corresponding landscapes to investigate the potential existence of structural similarity among them. In particular, this is conducted from both qualitative and statistical perspectives, which leads us to our first two research questions (RQs):
RQ1: For NPP, can we investigate any potential structural similarity across landscapes of different dimensions through the mining of statistical features?
RQ2: For NPP, can we visually investigate any potential structural similarity across landscapes of different dimensions?
The empirical analysis with regard to these two RQs is highly inspiring to disclose concrete evidence that supports the existence of structural similarity among NPP with various dimensions. These observations, though more qualitative, we design our next RQ to conduct a quantitative investigation upon such similarity assumption to seek deeper insights.
RQ3: For NPP, if such structural similarity exists, can we quantitatively investigate it across landscapes of different dimensions?
Finally, to further verify our findings, we expect to see how the measured structural similarity relates to the performance of meta-heuristic search algorithm. Thus, our final RQ:
RQ4: For NPP, if such quantitative determination of structural similarity is possible, how effective is it in explaining the performance difference of meta-heuristics between different problem instances?
Details of our empirical experiments and responses to these RQs will be elaborated in later sections step by step. Drawing on these answers, this study, for the first time, provides new insights help to further advance this field of research:
- If there exist certain structural similarities sharing across the landscapes of different dimensions of NPP, it implies BBOP solver(s) work for the low-dimensional problems, which are relatively easier to develop, will be 'directly' scalable to a high dimension.
- Graph mining methods, which have shown to be capable of discovering and analyzing hidden topological structures of fitness landscape, can be promising for assisting the design and/or selection of BBOP solvers.
In the rest of this paper, Section 2 provides some preliminary knowledge related to this work. Section 3 delineates our empirical methodologies for problem instance generation and LON construction. Extensive empirical results are presented and analyzed in Section 4. In the end, Section 5 concludes this paper and threads some light on future directions.
2 Preliminaries
In this section, we provide some important background knowledge and definitions pertinent to this paper.
Number Partitioning Problem (NPP). This is a classic class of NP-complete problem [Korf, 1998] that considers the task of deciding whether a given multiset S of positive integers can be divided into two disjoint subsets S 1 and S 2 , i.e., S 1 YS 2 " S, such that the sum of the numbers in S 1 equals that in S 2 . A partition is called perfect if the discrepancy between the two subsets is 0 when the sum of the original set is even, or 1 when the sum is odd. Mathematically, the NPP considered in this paper is defined as follows:
In this paper, we use NPP-n to denote the n-dimensional NPP instance whose cardinality is n " |S|.
Fitness Landscapes. The original idea of fitness landscape dates back to 1932 when Wright pioneered this concept in evolutionary biology [Wright, 1932], and a formal expression was developed by Stadler as a triplet pX , N , fq [Stadler, 2002], where X is the space of potential solutions, N indicates a neighborhood structure that relates solutions in X , and f : X ÑR is the fitness function of the underlying problem. For NPP, a solution in X can be represented as a vector binary string with a length n.
Local Optimum. A solution is a local optimum if its fitness value is superior to any other solution in its neighborhood. In other words, for a minimization problem like NPP, xℓ is a local optimum if @x P Npxℓ q, we have fpxℓ q ď fpxq.
Basin of Attraction. The basin of attraction B of a local optimumxℓ is the set of all solutions fromwhich local search converges to xℓ , i.e., B " tx P X | LocalSearch Ñ xℓ u.
Local Optima Network (LON). A LON is considered as a subspace of fitness landscape constituted by local optima. It compresses the information of the whole search space into a graph G " pV, Eq, where the vertex set V consists of local optima and the edge set E indicates the transitions between them. Note that there exist various types of definitions of an edge in LONs, e.g., the transition probabilities between basins [Ochoa et al., 2008], the escape probability between local optima through perturbations [V´erel et al., 2011]. In essence, these definitions all aim at constructing LONs that could effectively capture the transition dynamics between local optima while keeping the computational cost and the complexity of the resulting network manageable.
3 The Empirical StudyMethodology
This section elaborates the methodology and experimental setup of our empirical study, including the problem instances to investigate and the procedures we take to construct LONs.
3.1 Studied Problem Instances
In this paper, we take the NPP defined in Section 2 as a case to conduct a preliminary investigation on the potential existence of structural similarity among different fitness landscapes. In particular, we consider NPP with dimensions varies within n P t10, 13, 15, 17, 20, 23, 25, 27, 30u, which is adequate to illustrate patterns in fitness landscapes across a range of dimensions. To mitigate biases induced by randomness, 30 random NPP instances are generated for each dimension. In particular, for each NPP instance, the n items on which partitioning is performed are randomly drawn within the range r0, 2n¨k s, where k is a parameter that controls the hardness of the underlying NPP and it is set as 0.7 in this study.
3.2 LONConstruction and Iterated Local Search
There are two major ingredients to construct LONs: one is a node set of local optima V and the other is an edge set of transitions between local optima E. To generate V and E from combinatorial landscapes, a proper sampling strategy is essential to extract representative samples of local optima and determine their connectivity patterns. In this paper, we apply the widely used iterated local search (ILS), a powerful local search meta-heuristic [St¨utzle, 2006; Blum and Roli, 2003], to serve this purpose [V´erel et al., 2018; Ochoa and Herrmann, 2018]. In particular, we adopt an acceptance criterion that only accepts non-deteriorating local optima, i.e., ones with superior fitness value than their predecessors, to V. For each non-deteriorating move, an edge traced between the starting and the new local optimum is recorded in E. The termination condition of an ILS is set to K " 500 non-improvement perturbations. Thereafter, another ILS will be restarted from a new randomly initialized solution. To sample sufficient local optima for each problem instance, such ILS iterations will be performed T " 5, 000 times. Different from the other LON literature [V´erel et al., 2011], the weight associated with an edge is not recorded as we only apply LON as a proxy to study the structural similarity within a fitness landscape. Henceforth, the LON constructed in this paper is an unweighted and undirected graph. The working mechanism of ILS can be found in Section 1 of the supplementary material. 1
4 Results and Analysis
In this section, we seek to address the four RQs raised in Section 1 through a series of dedicated experiments.
4.1 Structural Similarity Analysis via Statistical Mining
Research Methods
To address RQ1, we conduct a series of statistical analyses on both network and local optima features 2 , which are expected to inspect various topological structures and properties associated with the corresponding fitness landscapes. In particular, our analyses are conducted at two levels.
- We first calculate two sets of features which are able to capture high-level properties of NPP landscapes.
- Graph features derived from LONs including i) number of nodes nnode; ii) number of edges nedge; iii) network density density; iv) average clustering coefficient ccavg; v) fitness assortativity fassor;
1 Available at https://tinyurl.com/mw3bx92h.
2 A detailed description for these features are available in Section 2 of the supplementary material.
- vi) cumulative degree distribution (CDD), vii) rich club coefficient (RCC) [Colizza et al., 2006], and viii) average degree connectivity (ADC) [Boccaletti et al., 2006].
- Local optima features averaged over the whole sampled population including i) average number of hill climbs to reach a local optimum denoted as nclimb; ii) average number of perturbations imposed on a local optimum to find an improving move denoted as nimpr; iii) minimum/average length for a local optimum to reach the accessible global optimum denoted as lmin or lavg; and iv) average size of basin attraction for all local optima or local optima with top 5% fitness values denoted as bsize or top 5%bsize.
We plot the trajectories of these features with the increase in dimensionality. This allows us to compare the high-level characteristics of different NPP landscapes.
- To obtain deeper insights into these landscapes, we inspect the following low-level features.
- Node features including i) node degree; ii) clustering coefficient; iii) betweenness centrality; iv) eigenvector centrality; v) closeness centrality; vi) PageRank centrality.
- Local optimum features including i) number of hill climbs to reach a local optimum; ii) number of perturbations required to find an improved local optimum; iii) minimum/average length for a local optimum to reach the accessible global optimum; iv) size of basin attraction.
Specifically, we apply the Spearman correlation coefficient 3 [Corder and Foreman, 2014] to quantitatively inspect the correlation between these features and the fitness values of local optima, and thus enable comparison of the intrinsic structural properties of each landscape.
Results for High-Level Qualitative Analysis
From the trajectories of graph features shown in Figure 1(a) to Figure 1(e), we find that most indicators experience a monotonic variation with the increase of n. In other words, LONs of NPPs, so as their corresponding fitness landscapes, share similar properties in 'neighboring' dimensions.
- As shown in Figure 1(a), nnode and nedge of LONs increase exponentially with the increase of dimensionality. This is reasonable as the size of the search space expands exponentially with the problem size.
- As shown in Figure 1(b), density and ccavg experience a significant reduction as n increases. This can be attributed to the sparse distribution of the sampled local optima in a high dimensional space, which makes them hardly connect with each other. On the other hand, we
3 Despite throughout this paper, we grounded all correlation analyses on the Spearman coefficient, we have actually repeated the experiments using other measures such as Pearson [Benesty et al., 2009] and Kendall [Kendall, 1938] metric, the outcomes of which are available in Section 6 of the supplementary material and highly consistent with the results reported in this paper.
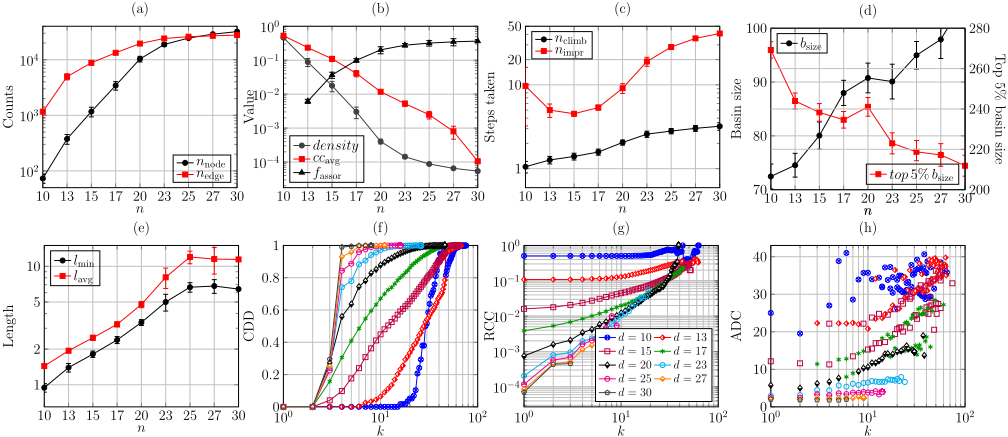
find that fassor increases monotonically with n. This implies there are more likely to have connections among local optima with similar fitness values when n is large.
- From Figure 1(c), it is clear to see an increasing demand for the number of hill climb steps (denoted as nclimb) to reach a local optimum with the increase of dimensionality. Likewise, it becomes more struggling for an algorithm to find an improving move by using perturbation, as reflected by the climbing trajectory of nimpr.
- As shown in Figure 1(d), The average basin size (denoted as bsize) of the whole LON gradually increases with the dimensionality. However, it is interesting to note the bsize of those top 5% local optima shows an opposite trajectory. This indicates it becomes more difficult for a meta-heuristic algorithm to locate a highquality local optimum during the local search. Similar conclusions could be drawn from Figure 1(e) where we find that both lavg and lmin become larger for higher dimensional problems, implying that more steps will be taken upon reaching a global optimum.
As for the trajectories of local optima features shown in Figure 1(f) to Figure 1(h), we have similar observations above, i.e., LONs of NPPs tend to produce similar trajectories when the dimensionality is close to each other. If we take a closer look at RCC trajectories, we find that nodes with a larger degree tend to have higher RCC values. This implies local optima with many connections are likely to be inter-connected to each other. Similar observations can also be obtained from ADC trajectories, which suggest that highdegree nodes tend to be connected with others that themselves are linked with many more. It is also interesting to note that such properties found in RCC and ADC trajectories are actually shared across almost all studied dimensions, though, such trends are not obvious to perceive for some instances.
Results for Local Low-Level Quantitative Analysis
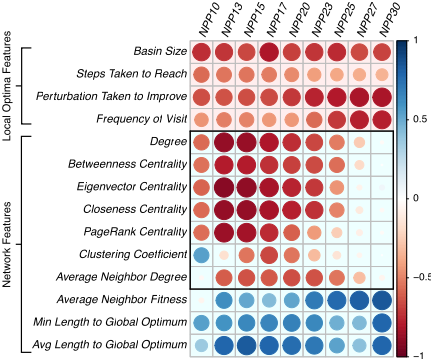
From the heatmap shown in Figure 2, it is interesting to see that most features considered in our experiments show high correlations with the corresponding fitness values when n ď 23. The only two exceptions are the average neighbor fitness/degree, which showed little relation with fitness when n " 10. We attributed this to the high density of LON for NPP-10 shown in Figure 1(b). This suggests each local optimum in its LON may connect to a considerable fraction of other nodes in the whole network, making it difficult to discover informative patterns through neighborhood statistics. On the other hand, as marked by the black rectangle in Figure 2, we find that the previously identified high correlations on some selected features are diminishing when n ą 23. However, the correlations still remain strong on the other features. These observations indicate some properties are actually shared across NPP with a wide range (even all) of dimensions. Specifically, we interpret the results as follows.
- All four local optima features, as shown in the first four rows of Figure 2, exhibited a remarkable degree of negative correlation with fitness across all studied dimensions. This indicates that in all the corresponding landscapes, local optima with better fitness values require more efforts to be reached/escaped from. Also, better local optima tend to have larger basins of attraction as well as higher chances to be visited during the local search.
- Three features derived from LONs, as shown in the last three rows of Figure 2, including the average neighbor fitness and the average/minimum length to global optimum, show a high positive correlation with fitness values across all dimensions. This observation suggests that local optima with better fitness values tend to be closer to the global optimum while their neighbors are likely to be solutions who are also high-quality local optima.
-1
Figure 2: Heatmap of Spearman correlation between fitness values and selected features. Each dot represents the mean correlation metric value collected over 30 random instances.
- On the other hand, other network features, as marked in the black rectangle, are highly correlated with fitness values when n ď 23. However, the relevant correlations are diminishing significantly when n ą 23. This can be attributed to the sparse distribution of the sampled local optima which we have discussed in the previous subsection, since all these indicators are highly dependent on the connectivity pattern of networks. Nevertheless, we still believe that the characteristics discovered in lower dimensions are generalizable to high dimensions in case more ILS iterations can be conducted.
Response to RQ1: Since the features studied in this subsection are able to capture various structural characteristics of LONs/fitness landscapes, their similar values/trajectories between problems with neighboring dimensions as well as the sharing/consistency of their correlation with local optima fitness across different dimensions, can be interpreted as structural similarity with respect to the corresponding landscapes.
4.2 Structural Similarity Analysis via Visual Mining
Research Methods
To address RQ2, we also ground our analyses on two levels.
- To have a visual interpretation of the topological structure of the LONs, we apply an NRL technique along with a dimensionality reduction to map the original LONs into a 2-dimensional space. Specifically, we first apply the HOPE node embedding method proposed in [Ou et al., 2016] to generate a 128-dimensional feature representation for each node in a LON. By doing so, the network will be transformed into a |V|ˆ128 matrix. Thereafter, we apply the UMAP method proposed in [McInnes and Healy, 2018] to further compress the embedded features into two components.
- Inspired by [Smith-Miles and Tan, 2012; Iclanzan et al., 2014], we apply another NRL technique along with the UMAP to map the LONs into a 2-dimensional instance space to directly visualize their 'structural closeness'. Specifically, we apply the Feather graph embedding method proposed in [Rozemberczki and Sarkar, 2020] to learn a 500-dimensional feature vector for a LON. We then apply UMAP to further compress this embedding into 2-dimension to enable visualization of the corresponding problem instance in a bivariate instance space.
Note that HOPE, Feather, and UMAP methods are delineated in Sections 3 and 4 of the supplementary document.
Remark 1. The motivation for our first proposed network visualization method stems from the poor scalability of traditional techniques such as tree- or 3D-based methods for large-scale networks like LONs [Herman et al., 2000]. Note that this method is also different from the existing practices for LON visualization [Veerapen and Ochoa, 2018;
Ochoa et al., 2015], but it has been successfully applied in other disciplines [Goyal and Ferrara, 2018].
Remark 2. To enable instance space analysis, instead of taking the LONs as a whole, which can be overly complicated, it would be more feasible to investigate the topological characteristics of LONs in a latent feature space. Different from the previous works which mainly relied on hand-crafted features based on human expertise [Iclanzan et al., 2014], we argue that the features generated by the NRL technique could be more plausible.
Results for Topological Visualization of LONs
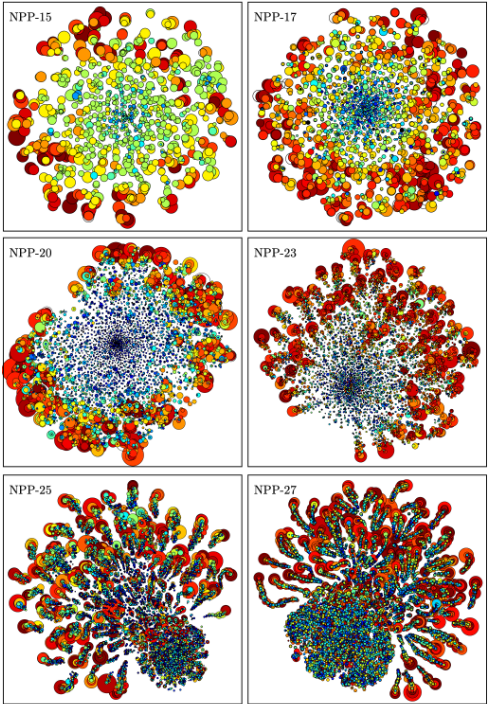
The 2-dimensional projections of the global structure of LONs for NPP at different dimensions are shown in Figure 3. To avoid the plots being either too crowded or too sparse, we only consider n P t15, 17, 20, 23, 25, 27u here without loss of generality. From Figure 3, We find three patterns as follows.
- Distribution of nodes: There exists a dense region of nodes and it becomes more obvious as n increases. Away from these crowded regions, local optima tend to form separated "strips" when n ě 23. This observation supports our hypothesis in Section 4.1 that the sampled local optima are sparsely distributed in a highdimensional space.
- Distribution of fitness values: The nodes located at the central dense regions tend to have unsatisfactory fitness values. On the other hand, the fitness are gradually improved for the nodes away from these central dense regions. In particular, the best set of local optima are located at the outer region. In other words, such local optima are likely to occur at the outer end of each 'strip' in a high-dimensional space.
- Distribution of degree: The nodes with a higher degree also tend to locate at the outer region and thus they are usually associated with better fitness values. This observation also conforms with the results in Section 4.1.
Remark 3. The second observation is interesting since neither HOPE nor UMAP is provided with fitness information. This indicates the pattern discovered in the fitness distribution is an intrinsic property of LONs and it is successfully captured by HOPE merely based on the network typology.
-1
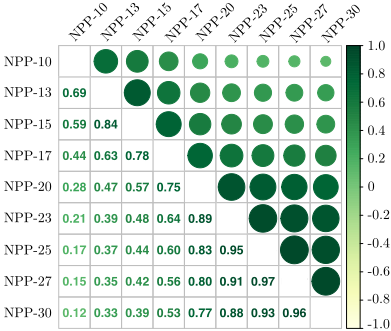
Figure 5: Heatmap of Sim metrics obtained for NPP instances across all studied dimensions. The data are averaged over 30 random instances.
Results for Visualizing LONs in Bivariate Instance Space
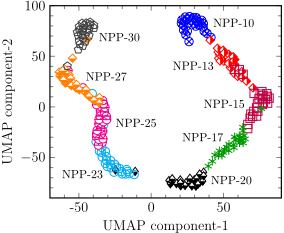
Figure 4 shows the distribution of NPP instances of different dimensions in 2D instance space, where 30 random instances are drawn for each dimension. It is clear to see that instances are grouped into clusters with respect to n. In particular, clusters of 'neighboring' dimensions are adjacent to each other, whereas those with very distinct dimensions tend to be far apart in the instance space. These observations are consistent with those in Figure 3 and Section 4.1.
Response to RQ2: By visualizing the structures of LONs for NPP at different dimensions in a latent space, we find certain regularities in terms of the distribution of local optima and their associated fitness and degree. In particular, we find similar patterns for problems in neighboring dimensions. Such observations are also reflected from an instance space analysis where LONs of instances with similar dimension(s) are close to/grouped with each other. Such observations imply the existence of structural similarity among their corresponding fitness landscapes.
4.3 Quantitative Measurement of Structural Similarity
Research Methods
For RQ3, we propose to use the Spearman correlation coefficient to measure the inter-correlation between those embedded features generated by the Feather method used in Section 4.2. Note that such evaluation could play as a metric (denoted as Sim) to quantitatively evaluate the structural similarity or 'closeness' between different fitness landscapes.
Empirical Results and Analysis
The Sim values, i.e., the Spearman correlations between different dimensions, are calculated and presented as a 9 ˆ 9 symmetric heatmap matrix shown in Figure 5. These results show some level of consensus with our previous findings when responding to the first two RQs. More specifically, we find positive correlations across all dimensions. In particular, the NPP instance with a certain dimension tends to have a higher correlation with problems of similar sizes, whereas they are much less correlated with those of very different sizes. For example, the lowest correlation value of 0.12 occurs between NPP-10 and NPP-30 while NPP-27 and NPP30 revealed the highest correlation of 0.96.
Response to RQ3: Our empirical study in this subsection demonstrates that graph embedding method is able to play as a driver to quantitatively evaluate the structural similarity with respect to different fitness landscapes. The observations in this subsection achieve a consensus with those discussed in Section 4.1 and Section 4.2. This quantitatively consolidates the existence of structural similarity among NPPs across different dimensions.
4.4 Effectiveness Verification of the Measured Similarity
Research Methods
To answer RQ4, we choose simulated annealing (SA) [Kirkpatrick et al., 1983] as the meta-heuristic and test its performance on NPP instances with n P t10, ¨ ¨ ¨ , 20u. Following the ideas in [Herrmann et al., 2018; Liefooghe et al., 2020; Smith-Miles et al., 2014], we define the performance of SA on a certain NPP instance as the capability to find the global optimum under a fixed budget. Specifically, we run a SA on each instance for 1, 000 independent runs, and record the fraction of runs that successfully find the global optimum as the success rate (SR). In practice, the stopping criterion of SA is set to a fixed budget of 1, 000 iterations. In each iteration, the temperature is reduced to T0 ˆ 0.8i{300 , where the initial temperature T0 is set as 1, 000. We propose two metrics to measure the relative performance of SA between each pair of problem instances. One is called the difference of success rates ∆SR " |SRi´SRj |; the other is called the relative ratio of success rates ρSR " SRi{SRj, where i, j P t10, ¨ ¨ ¨ , 20u and i ‰ j. In this subsection, we first investigate the correlation between Sim calculated using the method in Section 4.3 against ∆SR and ρSR. Then, we apply a quadratic regression to evaluate to which extent can our calculated Sim explain the relative performance of SA in terms of ∆SR and ρSR.
Empirical Results and Analysis
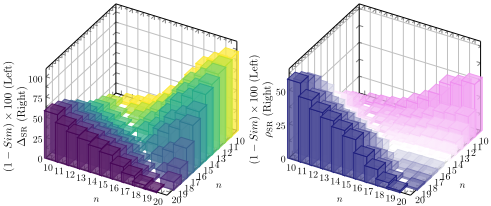
From the bar charts shown in Figure 6, it is clear to see both ∆SR and ρSR change in correspondence with Sim. Their Spearman coefficients are ´0.909 and ´0.862, respectively 4 . Furthermore, it is interesting to see the correlation between neighboring dimensions is high and it diminishes when the dimensionality becomes disparate. Such relationship is further exploited in Figure 7 by using a quadratic regression between ∆SR and ρSR against Sim, respectively. It is very encouraging to see both quadratic regression analyses return a high R2 score close to 0.9.
4 We transform the Sim to reverse its trend thus the results are shown in positive correlation values in Figure 6.
n
20
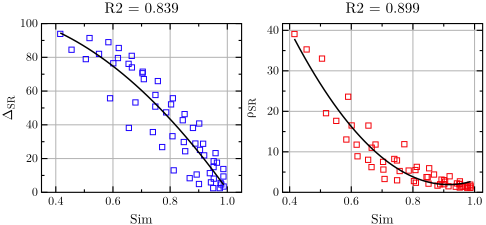
Figure 7: Quadratic regression analysis of ∆SR and ρSR versus Sim. Each data point represents average over 30 instances.
Response to RQ4: Here we empirically investigate the correlation between the structural similarity of fitness landscapes versus the performance of a meta-heuristic algorithm, SA in particular in our experiments. In a nutshell, SA requires similar computational cost to solve structurally similar NPPs.
5 Conclusions and Future Directions
By using LON as the proxy of fitness landscapes of NPP instances, this paper proposed to leverage graph data mining techniques to conduct qualitative and quantitative analyses to explore the latent topological structural information embedded in those landscapes. Our empirical results are inspiring to support the overall assumption of the existence of structural similarity between landscapes within neighboring dimensions. Besides, experiments on SA demonstrate that the performance of a meta-heuristic solver is similar on structurally similar landscapes.
To the best of our knowledge, this is the first attempt towards the investigation of structural similarity within combinatorial fitness landscapes. We believe graph data mining is a promising vehicle to facilitate the exploratory landscape analysis. Our methodologies are applicable for the purpose of exploring fitness landscapes of other combinatorial optimization problems. It is intriguing to see whether the structural similarity and generalizable to a wider range of combinatorial optimization problems. In addition, it is interesting to investigate the potential of the features learned and extracted by our methods for a wider range of tasks such as automatic algorithm selection and algorithm performance prediction.
10
11
12
13
n
Acknowledgements
This work was supported by UKRI Future Leaders Fellowship (MR/X011135/1, MR/S017062/1), NSFC (62076056), Alan Turing Fellowship, EPSRC (2404317), Royal Society (IES/R2/212077) and Amazon Research Award.
@inproceedings{ijcai2023p621,
  title     = {Exploring Structural Similarity in Fitness Landscapes via Graph Data Mining: A Case Study on Number Partitioning Problems},
  author    = {Huang, Mingyu and Li, Ke},
  booktitle = {Proceedings of the Thirty-Second International Joint Conference on
               Artificial Intelligence, {IJCAI-23}},
  publisher = {International Joint Conferences on Artificial Intelligence Organization},
  editor    = {Edith Elkind},
  pages     = {5595--5603},
  year      = {2023},
  month     = {8},
  note      = {Main Track},
  doi       = {10.24963/ijcai.2023/621},
  url       = {https://doi.org/10.24963/ijcai.2023/621},
}
TY - CPAPER TI - Exploring Structural Similarity in Fitness Landscapes via Graph Data Mining: A Case Study on Number Partitioning Problems AU - Huang, Mingyu AU - Li, Ke T2 - Proceedings of the Thirty-Second International Joint Conference on Artificial Intelligence, IJCAI-23 PB - International Joint Conferences on Artificial Intelligence Organization PY - 2023 SP - 5595 EP - 5603 DO - 10.24963/ijcai.2023/621 UR - https://doi.org/10.24963/ijcai.2023/621 ER -Copied
Machine-readable versions of this paper, for tools and AI agents:





