
A Rule Mining-based Advanced Persistent Threats Detection System
Proceedings of the Thirtieth International Joint Conference on Artificial Intelligence. Main Track. Pages 3589-3596.
https://doi.org/10.24963/ijcai.2021/494
Keywords
- Data Mining: Anomaly/Outlier Detection
- Data Mining: Frequent Pattern Mining
- Multidisciplinary Topics and Applications: Security and Privacy
Abstract
Advanced persistent threats (APT) are stealthy cyber-attacks that are aimed at stealing valuable information from target organizations and tend to extend in time.
Blocking all APTs is impossible, security experts caution, hence the importance of research on early detection and damage limitation.
Whole-system provenance-tracking and provenance trace mining are considered promising as they can help find causal relationships between activities and flag suspicious event sequences as they occur.
We introduce an unsupervised method that exploits OS-independent features reflecting process activity to detect realistic APT-like attacks from provenance traces.
Anomalous processes are ranked using both frequent and rare event associations learned from traces. Results are then presented as implications which, since interpretable, help leverage causality in explaining the detected anomalies. When evaluated on Transparent Computing program datasets (DARPA), our method outperformed competing approaches.
- [Abir et al., 2016] A. Abir, S. Kadry, et al. Data leakage de- tection using system call provenance. In INCoS, 2016.
- [Agrawal et al., 1993] R. Agrawal, T. Imieliński, and A. Swami. Mining association rules between sets of items in large databases. SIGMOD Rec., 22(2):207-216, 1993.
- [Akoglu et al., 2013] L. Akoglu, H. Tong, et al. CompreX: Fast and reliable anomaly detection in categorical data. In CIKM, pages 415-424, 2013.
- [Akoglu et al., 2015] L. Akoglu, H. Tong, et al. Graph based anomaly detection and description: a survey. DMKD, 29(3):626-688, 2015.
- [Auty, 2015] M. Auty. Anatomy of an advanced persistent threat. Network Security, 15(4):13-16, 2015.
- [Berrada et al., 2020] G. Berrada, J. Cheney, et al. A base- line for unsupervised advanced persistent threat detection in system-level provenance. FGCS, 108:401-413, 2020.
- [Bertens et al., 2017] R. Bertens, J. Vreeken, et al. Effi- ciently discovering unexpected pattern-co-occurrences. In SDM, pages 126-134, 2017.
- [Brian and Beaver, 2011] J. Brian and M. Beaver. Host- based data exfiltration detection via system call sequences. In ICIW, pages 134-142, 2011.
- [Chandola et al., 2009] V. Chandola, A. Banerjee, et al. Anomaly detection: A survey. ACM computing surveys (CSUR), 41(3):15:1-15:58, July 2009.
- [Grünwald, 2007] P. Grünwald. The Minimum description length principle. MIT Press, 2007.
- [Han et al., 2018] X. Han, T. Pasquier, et al. Provenance- based intrusion detection: Opportunities and challenges. In TaPP, 2018.
- [Han et al., 2020] X. Han, T. Pasquier, et al. Unicorn: Run- time provenance-based detector for advanced persistent threats. In NDSS, 2020.
- [Hassan et al., 2018] W. Hassan, M. Lemay, et al. Towards scalable cluster auditing through grammatical inference over provenance graphs. In NDSS, 2018.
- [He et al., 2005] Z. He, X. Xu, et al. FP-outlier: Frequent pattern based outlier detection. CSIS, 2(1):103-118, 2005.
- [Hossain et al., 2017] N. Hossain, S. Milajerdi, et al. SLEUTH: real-time attack scenario reconstruction from COTS audit data. In USENIX, pages 487-504, 2017.
- [Huang and Majidi, 2018] B. Huang and M. Majidi. Case study of power system cyber attack using cascading outage analysis model. In 2018 IEEE PESGM, pages 1-5, 2018.
- [Jenkinson et al., 2017] G. Jenkinson, L. Carata, et al. Ap- plying provenance in APT monitoring and analysis: Prac- tical challenges for scalable, efficient and trustworthy dis- tributed provenance. In TaPP, pages 16-21, 2017.
- [Ji et al., 2016] S.Y. Ji, B.K. Jeong, et al. A multi-level in- trusion detection method for abnormal network behaviors. NCA, 62:9-17, 2016. [Kalervo and Kekäläinen, 2002] J. Kalervo and J. Kekäläinen. Cumulated gain-based evaluation of IR techniques. TOIS, 20(4), 2002.
- [Koen and Vreeken, 2011] S. Koen and J. Vreeken. The odd one out: Identifying and characterising anomalies. In SDM, 2011.
- [Koufakou and Georgiopoulos, 2010] A. Koufakou and M. Georgiopoulos. A fast outlier detection strategy for distributed high-dimensional data sets with mixed attributes. DMKD, 20(2):259-289, 2010.
- [Koufakou et al., 2007] A. Koufakou, E. Ortiz, et al. A scal- able and efficient outlier detection strategy for categorical data. In 19th IEEE ICTAI, pages 210-217, 2007.
- [Kumar and Spafford, 1994] S. Kumar and E. Spafford. A pattern matching model for misuse intrusion detection. In NCSC, page 11, 1994.
- [Manzoor et al., 2016] E. Manzoor, S. Milajerdi, et al. Fast memory-efficient anomaly detection in streaming hetero- geneous graphs. In SIGKDD, pages 1035-1044, 2016.
- [Martin et al., 2020] T. Martin, G. Francoeur, et al. CI- CLAD: A fast and memory-efficient closed itemset miner for streams. In ACM SIGKDD, pages 1810-1818, 2020.
- [Mohiuddin et al., 2016] A. Mohiuddin, A. Mahmood, et al. A survey of network anomaly detection techniques. JNCA, 60:19-31, 2016.
- [Narita and Kitagawa, 2008] K. Narita and H. Kitagawa. Outlier detection for transaction databases using associa- tion rules. In WAIM, pages 373-380, 2008.
- [Ping and Johnson, 2018] W. Ping and W. Johnson. Cyberse- curity incident handling: A case study of the equifax data breach. Issues in Information Systems, 19(3), 2018.
- [Sebenius, 2021] A. Sebenius. SolarWinds hack followed years of warnings of weak c-security. Bloomberg, 2021.
- [Szathmary et al., 2007] L. Szathmary, P. Valtchev, et al. To- ward rare itemset mining. In ICTAI, pages 305-312, 2007.
- [Szathmary et al., 2012] L. Szathmary, P. Valtchev, et al. Ef- ficient vertical mining of minimal rare itemsets. In CLA, pages 269-280, 2012.
- [Thomas and Balakrishnan, 2008] C. Thomas and N. Bal- akrishnan. Improvement in minority attack detection with skewness in network traffic. In Data Mining, Intrusion De- tection, Inform. Assurance, and Data Networks Security, page 69730N, 2008.
- [Vreeken et al., 2011] J. Vreeken, M. van Leeuwen, et al. KRIMP: Mining itemsets that compress. DMKD, 23(1):169-214, 2011.
- [Yamanishi et al., 2004] K. Yamanishi, J.I. Takeuchi, et al. On-line unsupervised outlier detection using finite mix- tures with discounting learning algorithms. DMKD, 8(3):275-300, 2004.
- [Zhang et al., 2012] O. Zhang, R. Ko, et al. How to track your data: Rule-based data provenance tracing algorithms. In TrustCom, pages 1429-1437. IEEE, 2012.
References were extracted automatically from the PDF and may contain errors.
Full text extracted automatically from the PDF; figures, tables and equations may differ. The PDF is the version of record.
1 Introduction
"[I]n this world nothing can be said to be certain, except death and taxes.", wrote Benjamin Franklin in 1789. To this list, one could add the increasingly common and headlinegrabbing cyberattacks/security breaches [Sebenius, 2021; Ping and Johnson, 2018; Huang and Majidi, 2018], most of which are so-called advanced persistent threats (APT).
APTs are long-running and stealthy cyberattacks where adversaries gain access to specific targets' systems, staying undetected in the system for as long as necessary to reach their goal (mostly stealing or corrupting sensitive data or damaging the target's critical systems). Such attacks are now "part and parcel of doing business" [Auty, 2015], say experts and when not stopped early enough, inflict significant damage, particularly financial or reputational, to the victim. Preventing all such attacks is impossible [Auty, 2015], experts warn, so systems should be monitored continuously so as to detect APTs early and keep their damage to a minimum.
∗Contact Author
With APTs mimicking normal user activity, such attacks cannot be detected with traditional means (e.g antivirus software, signature or system-policy-based techniques). Methods relying on system/event logs or audit trails typically fail as they generally only analyze short event/system call sequences, which not only makes them unable to properly model and capture long-term behavior patterns but also susceptible to evasion techniques. Recent work [Manzoor et al., 2016; Han et al., 2018; Berrada et al., 2020; Han et al., 2020] has suggested whole-system provenance-tracking and provenance trace mining as solutions better suited for APT detection: the richer contextual information of provenance would help identify causal relationships between system activities, allowing the detection of attack patterns (e.g data exfiltration) that usually go unnoticed with the usual perimeter defencebased or policy-driven tools [Brian and Beaver, 2011; Zhang et al., 2012; Abir et al., 2016; Jenkinson et al., 2017].
There are, however, challenges to be overcome before mining provenance data that can fulfill its system security strengthening promises. There are also issues directly linked to the recording of provenance itself (e.g. level of provenance granularity, fault tolerance, trustworthiness and consistency of the recorded trace [Jenkinson et al., 2017]). The more worrisome issue though is the "needle in a haystack" problem: the volume of recorded provenance traces is massive (each day of system activity results in one or more gigabytes of provenance traces, containing hundreds or thousands of processes) and anomalous system activity (if at all present) only constitutes a tiny fraction of the recorded traces. Added to this, the diversity of possible APT patterns and the unavailability of fully annotated data make it even more complex to uncover anomalous activity indicative of an ongoing APT.
In such a context, typical supervised learning techniques would be of limited use to detect APT patterns and only unsupervised learning techniques would pass muster (see section 5.1 on data imbalance). In operational security settings, the ready availability of actionable information is critical. Security analysts can easily recognize and forensically investigate suspicious system behavior (e.g. processes created or subverted by an attacker) when brought to their attention. However, having the analysts sift through the traces in their entirety, when as little as 0.004% of the activity, if any at all, is suspicious, is hardly an efficient use of their time. In this paper, we investigate the key subproblem of quickly flagging unusual process activity that calls for further manual inspection. To tackle this problem, we summarize process activity through binary or categorical features (e.g kinds of events performed by a process, process executable name, IP addresses and ports accessed) and propose an anomaly detection method that scores individual processes based on whether they satisfy or violate association rules (both frequent and rare) extracted from process activity summaries.
Central to our method and a key advantage of it is the use of association rules. Not only do the rules let us score processes and flag anomalies in a principled manner, but they also allow us to present results in a way that could be more easily understood and interpreted by experts/security analysts seeking to thoroughly investigate and gain a deeper understanding of attack patterns. We evaluated our approach using provenance traces produced by the DARPA Transparent Computing (TC) program 1 . We set our association-based anomaly detector against an array of existing batch anomaly detectors and show it outperformed all of them.
The remainder of the paper is as follows: Section 2 summarizes related work, while section 3 provides background on association rule mining. Next, section 4 introduces our approach and section 5 discusses the experimental study and its outcome. We conclude with section 6.
2 RelatedWork
Intrusion and malware detection methods follow two main approaches: misuse detection (e.g. [Kumar and Spafford, 1994]) and anomaly detection (e.g. [Ji et al., 2016]). Misuse detection searches for events matching predefined signatures and patterns. Related methods can only detect attacks with known signature/patterns, hence are unsuitable for APT detection. By contrast, anomaly detection makes no assumption about the attack nature and just looks for activity that deviates from normal behavior i.e. usually recorded on a specific host or network. Ahmed et al. [Mohiuddin et al., 2016] is a survey of the main network anomaly detection techniques, which it divides into four categories: classificationbased, clustering-based, information theory-based and statistical. Anomaly detection surveys [Chandola et al., 2009; Akoglu et al., 2015] typically distinguish approaches w.r.t. the type of data (categorical, continuous, semi-structured, etc.) they admit. Among those, graph methods are the most relevant for our study, yet they typically work on graph formats of reduced expressiveness (e.g. undirected or unlabeled), whereas provenance graphs have rich structure (labels and properties on both nodes and edges). Existing anomaly detection approaches for provenance graphs rely on training with benign traces [Manzoor et al., 2016], require userprovided annotations [Hossain et al., 2017], or assume highly regular background activity [Hassan et al., 2018].
1 https://www.darpa.mil/program/transparent-computing
In parallel, a number of anomaly detection approaches have been designed for categorical data [He et al., 2005; Narita and Kitagawa, 2008; Koufakou et al., 2007; Koen and Vreeken, 2011; Akoglu et al., 2013; Bertens et al., 2017]. Some of them, e.g. OC3 [Koen and Vreeken, 2011; Vreeken et al., 2011] and CompreX [Akoglu et al., 2013], are based on the Minimum Description Length (MDL) principle [Gr¨unwald, 2007]: the idea here is to preprocess the dataset by compressing it and then take the compressed record size as its anomaly score, the underlying assumption being that infrequent/anomalous patterns are less efficiently compressed and result in higher sizes. UPC [Bertens et al., 2017] also relies on MDL (in combination with pattern mining) and is a two-pass approach that looks for a different kind of anomalies (class-2) than CompreX. FPOF (Frequent Pattern Outlier Factor) [He et al., 2005] is an itemset-mining method exploiting transaction outlierness: outliers (lower FPOF values) are transactions with fewer frequent patterns. Outlier-degree (OD) [Narita and Kitagawa, 2008], uses both categorical and continuous variables whereby infrequent values would indicate outlier status. AVF (Attribute Value Frequency) [Koufakou et al., 2007] computes anomaly scores by summing attribute frequencies. Data points having features with low occurrence probability (estimated from frequencies) are likely to be outliers. Other existing methods mixing categorical and numerical, e.g. SmartSifter [Yamanishi et al., 2004] and ODMAD [Koufakou and Georgiopoulos, 2010], could be applied to pure categorical data. ODMAD performs an initial off-line pattern mining stage, while SmartSifter is, to the best of our knowledge, the only previous unsupervised online algorithm for categorical data. However, it is unclear whether it can scale to a large number of attributes.
3 Itemset and Association Rule Mining
In association rule mining (ARM) [Agrawal et al., 1993], data comes as a transaction database D (as in Table 1) involving a universe of items, or attributes, A = {a1, a2, . . . , an} (here named a to e). A set of items X ⊆ A is called an itemset. Below, for compactness reasons, itemsets are given in separator-less form. Then, a transaction, aka object, is a pair (tid, itemset) where tid is a transaction identifier taken from the set O = {o1, o2, ..., om} (aka set of objects). Next, a set of tids is called a tidset. For historical reasons, we call D a context and introduce it as ×-table (see Table 1).
The image of a tidset Y from O, ι(Y ) = ⋂{Z|(j,Z) ∈ D, j ∈ Y } is made of the items shared by all the corresponding objects. Conversely, the image of an itemset X, aka its support set, comprises the tids of all objects for which X is a subset of the respective itemset, τ (X) = {j|(j, Z) ∈ D, X ⊆ Z}. For instance, in Table 1, τ(e) = {o1}. An itemset quality reflects its support: (absolute) support is its supporting set size, suppa(X) = |τ(X)| while relative support is the fraction supp(X) = |τ(X)|/|D|. A support threshold, min supp, splits itemsets into frequent and infrequent itemsets, whereas with a max supp, infrequent ones, a.k.a. rare [Szathmary et al., 2007], are the target. For instance, with min supp=3, ac is frequent while abcd is rare. Here, we exploit borderline cases, i.e. maximal frequent itemsets (MFI, no frequent superset) and minimal rare itemsets (MRI, no rare subsets), which are closed itemsets and generators, respectively. In fact, τ induces an equivalence relations on ℘(A): X ≡ Z iff τ (X) = τ (Z) whereby each class has a unique maximum, called the closed itemset, and one or more minima, its generators. Both categories admit straightforward support-wise definitions: an itemset X is closed (generator) if it admits no superset (subset) with identical support. For instance, in Table 1, bc is closed while b is a (non closed) generator.
| a | b | c | d e | |
|---|---|---|---|---|
| o1 | x | x | x | |
| o2 | x | x | x | |
| o3 | x | x | x | x |
| o4 | x | x | ||
| o5 | x | x | x | x |
| o6 | x | x | x |
An association rule has the form X→Y , where X, Y ⊆ A and X ∩ Y = ∅. Among the most popular rule quality measures are the support, supp(X→Y )=supp(X∪Y ), the confidence, conf (X→Y )=supp(X→Y )/supp(X), and the lift, lift(X→Y )= supp(X∪Y )/supp(X)×supp(Y ). Again, support-wise, a rule qualifies as frequent or rare [Szathmary et al., 2007] whereas it is said to be confident if it reaches a confidence threshold min conf. Frequent (rare) and confident rules are valid. For example, with min conf= 3/5, and min supp=max supp=3, a→c is valid frequent (supp= 4 and conf =4/5) while ab→d is valid rare (supp=2 and conf =1).
4 Rule Mining-Based Anomaly Detection
Below, we first provide some arguments in favor of our rulebased approach and then present it together with some technical details.
4.1 Rationale
Frequent and rare patterns [Szathmary et al., 2007] clearly convey different types of regularities in the data. The former tend to capture generally valid rules, e.g. the typical behavior of customers on an online retail portal. The latter, in contrast, focus on local regularities that, without being totally exceptional, i.e. unique, have a very limited extent. In fact, such regularities will likely be missed by an exhaustive search with a low min supp threshold since they will be missed in the immensely voluminous result. Rare patterns have the capacity to capture the features of a highly under-represented - and unknown - class in an imbalanced sample, which makes them valuable for our study.
Following the above guidelines, we hypothesize that APTrelated processes constitute a separate class following a event chaining schema that distinguishes them from normal ones. The schema should manifest as atypical associations of events which, taken separately, might be totally legitimate. Consequently, such atypical behavior may be captured either as a mismatch to common behavioral patterns or as a consistent, yet rare, pattern of itself. Thus, a forensic APT detection approach should focus on candidate processes satisfying these conditions. Technically speaking, an anomaly score needs to quantify the above (mis)matches of key patterns while also reflecting those patterns' quality (see section 3).
As a first approach, we propose to organize system traces as a transaction database and to mine itemset associations from them (rather than, say, sequential patterns). Such an approach has the added benefit of being explainable as the event implication format is easy to interpret. This, in turn, favors better understanding of mechanisms behind an APT and therefore should facilitate threat prevention.
4.2 Anomaly DetectionMethod
We designed two separate anomaly detection methods: VRARM for Valid Rare ARM and VF-ARM for Valid Frequent ARM. The underlying association rules have been derived from MRIs and MFIs, respectively. The advantage behind using both here is to speed up the ARM task w.r.t. other direct approaches [Szathmary et al., 2012] due to a substantial reduction in the underlying search space.
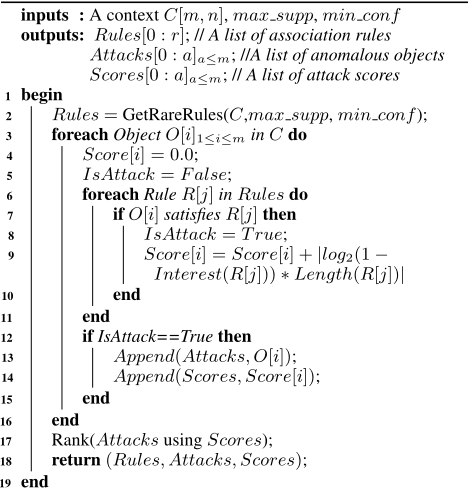
Algorithm 1 presents the pseudo-code of VR-ARM. It takes as input a context C (i.e. a m × n ×-table) plus the support and confidence thresholds. Its outputs are (i) Rules: the association rules extracted from C; (ii) Attacks: the list of anomalous objects; and (iii) Scores: the list of scores associated to objects in Attacks. The algorithm starts by calling GetRareRules to generate the rare rules through the MRIs. It implements the BtB (Break the Barrier) method [Szathmary et al., 2012]. Next, objects from C are matched against rare associations: an object satisfies a rare rule if its itemset comprises all the items of the rule. An anomalousness score is assigned to each object based on the set of matching outcomes (the higher the score, the more anomalous the object). VF-ARM follows the same principles as VR-ARM so will be skipped here: main differences include the parameter min supp and a call to the MFI-based rule miner GetFreqRules. Moreover, an object violates a frequent rule if its itemsets are included in the left-hand side of the rule and not in its right-hand side. Objects matching rare rules or violating frequent ones are deemed potentially anomalous, hence put in Attacks. Their anomalousness scores are computed as the average of a function combining the interestingness (e.g. lift) and length of the respective rules, log2(1-Interest(R[j]))∗Length(R[j]). High quality rules, with many items on both sides, would have large scores.
At a final stage, the list of the potential attack objects are ranked w.r.t. their anomaly scores so that the top-ranked elements could be subsequently checked by a security expert.
5 Evaluation
Below, we first describe the data used in our experiments together with the selected performance metrics and then present the evaluation study outcome and discuss the observed trends.
5.1 Datasets
In our evaluation study, we have used two data collections described in [Berrada et al., 2020], which are publicly available 2 . These collections (or scenarios) consist of sets of feature views or contexts from raw whole-system provenance
2 https://gitlab.com/adaptdata
Algorithm 1: VR-ARM: Association Rule Mining Anomaly Detion
graphs produced during two DARPA Transparent Computing (TC) program "engagements" (exercises aimed at evaluating provenance recorders and techniques to detect APT activity from provenance data). During the engagements, several days (5 for scenario 1 and 8 for scenario 2) of system activity (process, netflow, etc.) were recorded on various platforms (Windows, BSD, Linux and Android) subjected to APT-like attacks. [Han et al., 2020] explains engagements in more detail and provides more information on provenance data for Scenario 2. All contexts in the data collections relate unique process identifiers (rows) to varying features/attributes of process activity. They include the following contexts:
- ProcessEvent (PE): Integrated traces use event types such as open, close, exit, etc. to describe process activity in a OS-independent way. Thus, process uuids are rows and event types are columns: A process p has attribute ty if p ever performs an event of type ty.
- ProcessExec (PX): Attributes are executable names nm, for example ls or sudo. A process p has attribute nm if p is an instance of executable nm.
- ProcessParent (PP): Attributes are executable names nm. A process p has attribute nm if p is a child process of an executable named nm.
- ProcessNetflow (PN): Attributes are IP addresses ip and port numbers pn. A process p has attributes ip and pn if it ever communicates with IP address ip at port pn.
- ProcessAll (PA): Combination of all of the above contexts, with attributes renamed to avoid ambiguity.
Table 2 summarizes the properties of contexts per collection/scenario. It is noteworthy that the number of processes observed in each system varies significantly: In particular, the Linux dataset comprises 3 to 10 times as many different processes compared to the Windows or BSD datasets and up to 2400 times as many compared to Android. In general, among the base contexts, ProcessEvent usually has the largest number of processes, while ProcessNetflow or ProcessExec have the largest number of attributes, followed by ProcessParent. The last column represents the percentage of attacks observed in each OS/context. For example, there are 8 attack processes in the Windows data (0.04%) in the first scenario, and 8 (0.07%) in the second one. Note that the size of the original datasets do not directly correlate with the number of processes or attributes. For example, the Android dataset is the largest but has the fewest processes and attributes, because the provenance recorder would log low-level app activity and perform dynamic information flow tracking which are pieces of information we do not analyze. For a more detailed description, of the data collections/contexts, the reader is referred to [Berrada et al., 2020].
5.2 EvaluationMetrics
Rather than classifying processes as anomalous or not, our method ranks themw.r.t. their degree of suspiciousness. Due to the high data imbalance (attacks amount to 0.004% to 8.8% of data), using classification with accuracy would lead to the accuracy paradox [Thomas and Balakrishnan, 2008].
Instead, a better suited metric would be normalized discounted gain (nDCG), first introduced in [Kalervo and Kek¨al¨ainen, 2002] as a means to assess ranking quality in information retrieval. It is intended to reflect the value the end user assigns to a ranked document, i.e. relevant documents are more valuable than marginally relevant ones and even more so than irrelevant ones. Also, intuitively, since a user will only scan a small portion of a ranking, relevant documents close to its top have more value than comparably relevant ones further down the list (those too far down would be skipped). Consequently, nDCG favors rankings with all relevant documents near the top. The same principle applies to anomalous process: low ranked attack processes are all but useless to analysts whose monitoring burden increases with the amount of events to inspect (up to a point where suspicious processes escape their attention). Also, a large number of top-ranked normal processes (false alarms) may degrade analyst confidence in the automated monitoring system. The discounted cumulative gain (DCG) of a ranking sums element relevance scores penalized by the logarithm of their rank:
DCGN = ∑Ni=1 reli log2 (i+1) , where N is the ranking size, reli the i-th element relevance score. As DCG scores are not comparable for lists of varying size, a normalization is performed with the ideal score iDCG, i.e. one corresponding to the best case (all relevant entities at the top). Thus, for a ranking with p relevant entities iDCGN = ∑pi=1 reli log2 (i+1) . nDCG is the normalized version of DCG: nDCGN = DCGN iDCGN . We use a binary scale for the relevance reli where 1 stands for attack processes, 0 for normal ones.
Another possible choice would have been the recall@k measure. It has not been used in this study because we see it as likely less informative and of lower discriminative power than nDCG. As an illustration, assume two anomaly detection methods, A and B, that detect 4 anomalous entities by rank 10: A at ranks 1, 4, 6 and 7 and B at ranks 3, 4, 9 and 10. Recall@10 for both methods would be 0.4, thus, based on recall@10, the methods would be seen as performing equally well. Yet, with anomalous entities closer to the top with A, an analyst would consider the results of A better than those of B. The nDCG captures this difference in performance: The nDCG value is 0.83 for A and only 0.59 for B. We are not only concerned with finding relevant entities in the top k but also with the quality of that top k ranking, therefore choosing nDCG over recall@k.
| Scenario | Size | PE | PX | PP | PN | PA | nb attacks | % nb attacks nb processes | |
|---|---|---|---|---|---|---|---|---|---|
| BSD | 1 2 | 288 MB 1.27 GB | 76903 / 29 224624 / 31 | 76698 / 107 224246 / 135 | 76455 / 24 223780 / 37 | 31 / 136 42888 / 62 | 76903 / 296 224624 / 265 | 13 11 | 0.02 0.004 |
| Windows | 1 2 | 743 MB 9.53 GB | 17569 / 22 11151 / 30 | 17552 / 215 11077 / 388 | 14007 / 77 10922 / 84 | 92 / 13963 329 / 125 | 17569 / 14431 11151 / 606 | 8 8 | 0.04 0.07 |
| Linux | 1 2 | 2858 MB 25.9 GB | 247160 / 24 282087 / 25 | 186726 / 154 271088 / 140 | 173211 / 40 263730 / 45 | 3125 / 81 6589 / 6225 | 247160 / 299 282104 / 6435 | 25 46 | 0.01 0.01 |
| Android | 1 2 | 2688 MB 10.9 GB | 102 / 21 12106 / 27 | 102 / 42 12106 / 44 | 0 / 0 24 / 11 | 8 / 17 4550 / 213 | 102 / 80 12106 / 295 | 9 13 | 8.8 0.10 |
5.3 Evaluation Results
APT Ranking Visualisation with Band Diagrams
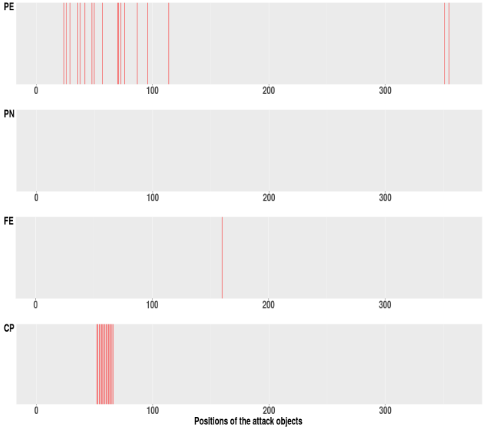
To ease the inspection of generated rankings, we designed a visualization technique, called band diagram charts (see Figure 1). In a diagram, each ranked list is drawn as a horizontal band where the position of a true positive, i.e. an APT, is marked by a red vertical line. The left-to-right order follows rank decrease: Top ranked entities will be put on the left, hence multiple red lines in that area indicate a highly efficient anomaly detection. Such an overall presentation enables easy visual result interpretation and helps filter out algorithmic parameters.
Ranking Evaluation With nDCG
We compared VF-ARM and VR-ARM to existing tools such as FPOutlier (FPOF) [He et al., 2005], Outlier-degree (OD) [Narita and Kitagawa, 2008], CompreX [Akoglu et al., 2013], AVF (Attribute Value Frequency) [Koufakou et al., 2007] and OC3 (Krimp) [Vreeken et al., 2011]: We ran them on the contexts from Table 2 and assessed the resulting rankings by means of nDCG. To that end, we first reimplemented FPOF, AVF, OC3 and OD in Python following their original descriptions 3 . We reused publicly-available implementations of OC3 [Koen and Vreeken, 2011] and CompreX [Akoglu et al., 2013], in C++ and Matlab respectively. Finally, experiments were run on an Intel Core i7-6700 CPU (3.4 GHz), 32 GB RAM PC with Ubuntu OS.
The global set of nDCG scores is split context-wise into tables 3, 4, 5, 6, and 7. An entry here corresponds to a combination (method, scenario, OS). Noteworthily, some algorithms did not finish within a reasonable time (4 to 48 hours). Such cases are indicated by DNF . For each OS (row) vs scenario combination, the maximum nDCG score is marked in bold.
3 Code available at https://gitlab.com/anomalyDetection/baseline
For visibility, high scores of our approach, VR-ARM or VFARM, are colored: green for values in ]0.25,50], orange for ]0.50, 0.75] and red for top scores in ]0.75, 1].
VR-ARM and OC3 were competitive on the ProcessEvent context with considerably better scores obtained with VR-ARM between 0.50 (Android, scenario 2) and up to 0.87 (Android, scenario 1). FPOF and OD yielded similar scores to each other. AVF and VF-ARM produced good scores with scenario 1. Concerning ProcessExec and ProcessParent, AVF and OC3 generated moderately acceptable scores with all four OS. The highest scores in these contexts were obtained by OC3 (0.51 and 0.42) in BSD w.r.t. scenario 2. VF-ARM got good ranking scores for BSD (scenario 1) for both contexts, yet due to the low confidence values, they were deemed irrelevant and non competitive with the other methods on this task. Concerning attacks in ProcessNetflow, VR-ARM reached good results on both attack scenarios, with nDCG scores varying between 0.30 (Windows, scenario 2) and 0.71 (Android, scenario 2). Like-wise, top-ranked anomalous entities in the super-context ProcessAll have been detected with VR-ARM on both attack scenarios. AVF and OC3 have also generated good scores with attack scenario 1. Note that CompreX produced good results whenever it was able to finish within a reasonable time (ProcessEvent, scenario 1); for wider contexts such as P rocessExec or P rocessP arent or ProcessAll, it usually did not terminate within a few minutes (while [Akoglu et al., 2013] claims CompreX can be run in anytime-mode, the available Matlab implementation does not support it). Runtime-wise, FPOF, CompreX and OD were significantly more expensive than VR-ARM and AVF.
| Detection method | FPOF | OD | Comprex | OC3 | AVF | VR-ARM (sup x conf) | VF-ARM (sup x conf) | ||||||||
|---|---|---|---|---|---|---|---|---|---|---|---|---|---|---|---|
| Attack scenario | 1 | 2 | 1 | 2 | 1 | 2 | 1 | 2 | 1 | 2 | 1 | 2 | 1 | 2 | |
| Source | Windows | 0.20 | DNF | 0.20 | DNF | 0.60 | DNF | 0.30 | 0.23 | 0.60 | 0.21 | 0.82 (5x100) | 0.19 (5x100) | 0.33 (60x70) | 0.13 (30x30) |
| BSD | 0.20 | 0.13 | 0.19 | 0.17 | 0.54 | DNF | 0.43 | 0.24 | 0.51 | 0.19 | 0.64 (0.05x100) | 0.12 (5x100) | 0.33 (40x97) | 0.12 (40x40) | |
| Linux | 0.18 | 0.22 | 0.18 | 0.21 | 0.30 | DNF | 0.38 | 0.38 | 0.27 | 0.29 | 0.13 (0.05x100) | 0.14 (5x100) | 0.22 (20x97) | 0.10 (40x40) | |
| Android | 0.29 | 0.36 | 0.33 | 0.22 | 0.82 | DNF | 0.74 | 0.32 | 0.84 | 0.30 | 0.87 (30x100) | 0.50 (5x100) | 0.77 (5x70) | 0.12 (5x70) | |
| Detection method | FPOF | OD | Comprex | OC3 | AVF | VR-ARM (sup x conf) | VF-ARM (sup x conf) | |||||||
|---|---|---|---|---|---|---|---|---|---|---|---|---|---|---|
| Attack scenario | 1 | 2 | 1 | 2 | 1 | 2 | 1 | 2 | 1 | 2 | 1 | 2 | 1 | 2 |
| Windows | 0.15 | DNF | 0.15 | DNF | DNF | DNF | 0.28 | 0.24 | 0.28 | 0.22 | 0 | 0 | 0 | 0 |
| Source BSD | 0.15 | 0.18 | 0.15 0.17 | DNF | DNF | 0.49 | 0.51 | 0.34 | 0.17 | 0.08 (0.05x100) | 0.05 (0.05x100) | 0.53 (0.001x10) | 0.06 (1x40) | |
| Linux | 0.18 | 0.20 | 0.18 | 0.20 | DNF | DNF | 0.30 | 0.42 | 0.43 | 0.42 | 0.12 (0.05x100) | 0 | 0.10 (0.001x0.1) | 0.004 (0.001x0.1) |
| Android | 0.22 | 0.29 | 0.22 | 0.29 | 0.22 | DNF | 0.39 | 0.39 | 0.39 | 0.38 | 0 | 0 | 0 | 0 |
| Detection method | FPOF | OD | Comprex | OC3 | AVF | VR-ARM (sup x conf) | VF-ARM (sup x conf) | |||||||
|---|---|---|---|---|---|---|---|---|---|---|---|---|---|---|
| Attack scenario | 1 | 2 | 1 | 2 | 1 | 2 | 1 | 2 | 1 | 2 | 1 | 2 | 1 | 2 |
| Windows | 0.10 | DNF 0.10 | DNF | DNF | DNF | 0.21 | 0.22 | 0.21 | 0.22 | 0 | 0 | 0 | 0 | |
| Source BSD | 0.13 | 0.10 0.13 | 0.09 | DNF | DNF | 0.43 | 0.29 | 0.30 | 0.17 | 0.29 (0.05x100) | 0.24 (0.05x100) | 0.67 (0.001x10) | 0.06 (0.001x10) | |
| Linux | 0.17 | 0.20 0.17 | 0.20 | DNF | DNF | 0.24 | 0.42 | 0.20 | 0.25 | 0 | 0 | 0.12 (0.001x1) | 0.03 (10x40) | |
| Detection method | FPOF | OD | Comprex | OC3 | AVF | VR-ARM (sup x conf) | VF-ARM (sup x conf) | ||||||||
|---|---|---|---|---|---|---|---|---|---|---|---|---|---|---|---|
| Attack scenario | 1 | 2 | 1 | 2 | 1 | 2 | 1 | 2 | 1 | 2 | 1 | 2 | 1 | 2 | |
| Source | Windows | 0.36 | DNF | 0.36 | DNF | DNF | DNF | 0.65 | 0.24 | 0.58 | 0.18 | 0.62 (10x100) | 0.30 (5x100) | 0 | 0 |
| BSD | 0.13 | 0.20 | 0.14 | 0.20 | DNF | DNF | 0.11 | 0.50 | 0.58 | 0.18 | 0.34 (10x100) | 0.60 (5x100) | 0.11 (5x60) | 0.18 (5x60) | |
| Linux | 0.23 | 0.31 | 0.23 | 0.23 | DNF | DNF | 0.38 | 0.35 | 0.31 | 0.42 | 0.58 (20x100) | 0.39 (5x100) | 0.42 (5x50) | 0.11 (10x40) | |
| Android | 0.42 | 0.36 | 0.36 | 0.34 | DNF | DNF | 0.64 | 0.30 | 0.47 | 0.32 | 0.46 (50x100) | 0.71 (30x100) | 0 | 0.10 (20x50) | |
| Detection method | FPOF | OD | Comprex | OC3 | AVF | VR-ARM (sup x conf) | VF-ARM (sup x conf) | ||||||||
|---|---|---|---|---|---|---|---|---|---|---|---|---|---|---|---|
| Attack scenario | 1 | 2 | 1 | 2 | 1 | 2 | 1 | 2 1 | 2 | 1 | 2 | 1 | 2 | ||
| Source | Windows | DNF | DNF | DNF | DNF | DNF | DNF | 0.49 | DNF | 0.52 | DNF | 0.61 (5x100) | 0.35 (5x100) | 0.50 (80x70) | 0.07 (40x40) |
| BSD | 0.21 | 0.15 | 0.19 | 0.15 | DNF | DNF | 0.38 | DNF 0.52 | DNF | 0.36 (0.05x100) | 0.52 (5x100) | 0.18 (97x97) | 0.14 (40x40) | ||
| Linux | 0.18 | DNF | 0.18 | DNF | DNF | DNF | 0.41 | DNF 0.29 | DNF | 0.54 (0.05x100) | 0.45 (5x100) | 0.13 (40x70) | 0.09 (40x40) | ||
| Android | 0.31 | 0.37 | 0.34 | 0.20 | DNF | DNF | 0.82 | 0.40 | 0.83 | 0.35 | 0 | 0.51 (0.05x100) | 0 | 0.43 (40x40) | |
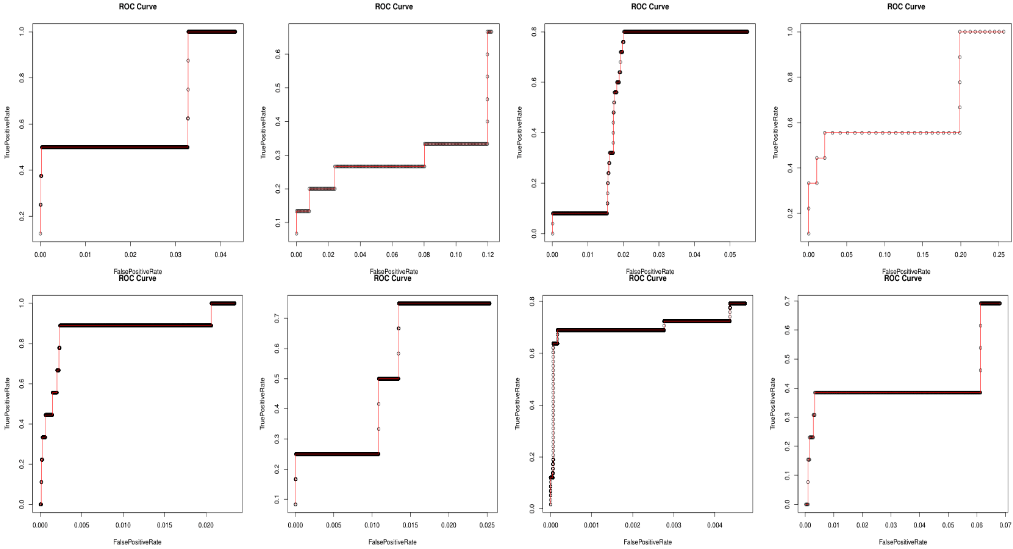
Table 8 summarizes attack detection and ranking for each combination (OS, scenario): The winner method for each OS is given with the best input context. Results comprise the top nDCG scores, the running time and the Area Under Curve (AUC). As per the figures, VR-ARM is likely to be the method that has led to the best nDCG scores with interesting AUC values on the four OS w.r.t. both scenarios (see also Figure 2). Its time efficiency is arguably due to MRI-based associations being only a tiny fraction of all the rules.
Intuitively, the results seem to confirm that most of the attacks can be detected by tracking their uncommon (rare) behavior in the provenance data. Indeed, in our experiments, we ran VR-ARM with max supp values ranging between 0.05 and 30 %. More interestingly, the rare rules found have confidence of 100%. Note that we kept the best configuration for every method that needs parameter tuning. Here again, VRARM stood out as very competitive even when compared to the best configurations of its competitors.
As an additional benefit, our tool output is highly explainable. As an illustration, consider the rare association rule made of the following itemsets: (OPEN, READ, CHANGEPRINCIPAL, SENDMSG) of Events, (216.66.26.25:1025', '216.66.26.25:0', '128.55.12.10:53') of Network activities, and ('/etc/host.conf','/lib/x86 64 linux gnu/libnss dns.so')
of File activities. The rule was detected when tracing back one of our top anomalous processes whose score was among the highest overall (79.0). A plausible interpretation of these itemsets could be as follows: Processes matching the rule alter some sensitive library files. They also try to establish communication with the devices on the listed IP
| Winner AD method | Winner context | Running time (sec.) | nDCG | AUC | ||||||
|---|---|---|---|---|---|---|---|---|---|---|
| Attack scenario | 1 | 2 | 1 | 2 | 1 | 2 | 1 | 2 | 1 | 2 |
| Windows | VR-ARM | VR-ARM | ProcessEvent | ProcessAll | 4.60 | 23.86 | 0.82 | 0.35 | 0.75 | 0.50 |
| Source BSD | VR-ARM | VR-ARM | ProcessEvent | ProcessNetflow | 12.18 | 12.30 | 0.64 | 0.60 | 0.75 | 0.50 |
| Linux | VR-ARM | VR-ARM | ProcessNetflow | ProcessAll | 3.53 | 2.74 | 0.58 | 0.45 | 0.83 | 0.50 |
| Android | VR-ARM | VR-ARM | ProcessEvent | ProcessNetflow | 0.78 | 3.35 | 0.87 | 0.71 | 0.92 | 0.50 |
addresses and subsequently send and/or receive data. We believe that presenting the security analyst not only with a list of anomalous processes but also with a list of such rules describing various aspects of the attack should easy her grasp of the attacking techniques.
6 Conclusion
In this paper. we proposed a novel OS-agnostic APT detection method in which anomalous entities are detected by an association rule-based scoring algorithm. Two versions of the algorithm was designed exploiting frequent and rare rules, respectively. A new visualization technique was also proposed to evaluate the position of potential anomalies within ranked lists. Our tool was evaluated on several large datasets containing realistic APT on a variety of OS (produced as part of the DARPA Transparent Computing program). The rare rule version VR-ARM was shown to consistently rank attack processes as highly anomalous entities. A major advantage of our approach over its competitors is the easy interpretation of both methods' output.
As a first step towards online detection, we are studying a stream version of our rule-based method which is to maintain MFIs/MRIs over a stream window (e.g. as in [Martin et al., 2020] for closures). Alternatively, we shall also examine the integration of analysts' feedback in the scoring loop, e.g. as an active learning task. Indeed, similarly to game theory problems, the security expert would imitate the adversary by giving answers on whether the top ranked elements are anomalous or not. The algorithm would receive these answers and adapt the scoring weights correspondingly.
Acknowledgements
Reported work was partially supported by Defense Advanced Research Projects Agency (DARPA) under contract number: FA8650-15-C-7557, by ERC grant Skye (grant 682315), and by an ISCF Metrology Fellowship grant provided by the UK Department for Business, Energy and Industrial Strategy. The assistance provided by Himan Mokherjee in re-implementing FPOF and OD in Python was greatly appreciated.
@inproceedings{ijcai2021p494,
  title     = {A Rule Mining-based Advanced Persistent Threats Detection System},
  author    = {Benabderrahmane, Sidahmed and Berrada, Ghita and Cheney, James and Valtchev, Petko},
  booktitle = {Proceedings of the Thirtieth International Joint Conference on
               Artificial Intelligence, {IJCAI-21}},
  publisher = {International Joint Conferences on Artificial Intelligence Organization},
  editor    = {Zhi-Hua Zhou},
  pages     = {3589--3596},
  year      = {2021},
  month     = {8},
  note      = {Main Track},
  doi       = {10.24963/ijcai.2021/494},
  url       = {https://doi.org/10.24963/ijcai.2021/494},
}
TY - CPAPER TI - A Rule Mining-based Advanced Persistent Threats Detection System AU - Benabderrahmane, Sidahmed AU - Berrada, Ghita AU - Cheney, James AU - Valtchev, Petko T2 - Proceedings of the Thirtieth International Joint Conference on Artificial Intelligence, IJCAI-21 PB - International Joint Conferences on Artificial Intelligence Organization PY - 2021 SP - 3589 EP - 3596 DO - 10.24963/ijcai.2021/494 UR - https://doi.org/10.24963/ijcai.2021/494 ER -Copied
Machine-readable versions of this paper, for tools and AI agents:





