
A Similarity Measurement Method Based on Graph Kernel for Disconnected Graphs
Proceedings of the Twenty-Eighth International Joint Conference on Artificial Intelligence. Doctoral Consortium. Pages 6430-6431.
https://doi.org/10.24963/ijcai.2019/904
Keywords
- Machine Learning Applications: Networks
- Machine Learning: Kernel Methods
Abstract
Disconnected graphs are very common in the real world. However, most existing methods for graph similarity focus on connected graph. In this paper, we propose an effective approach for measuring the similarity of disconnected graphs. By embedding connected subgraphs with graph kernel, we obtain the feature vectors in low dimensional space. Then, we match the subgraphs and weigh the similarity of matched subgraphs. Finally, an intuitive example shows the feasibility of the method.
- [Kondor and Pan, 2016] Risi Kondor and Horace Pan. The multiscale laplacian graph kernel. In Advances in Neural Information Processing Systems, pages 2990-2998, 2016.
- [Kriege et al., 2018] Nils M Kriege, Christopher Morris, An- ja Rey, and Christian Sohler. A property testing framework for the theoretical expressivity of graph kernels. In IJCAI, pages 2348-2354, 2018. IJCAI
- [Shervashidze et al., 2011] Nino Shervashidze, Pascal Schweitzer, Erik Jan van Leeuwen, Kurt Mehlhorn, and Karsten M Borgwardt. Weisfeiler-lehman graph kernels. Journal of Machine Learning Research, 12(Sep):2539- 2561, 2011.
- [Stöcker et al., 2018] Bianca K Stöcker, Till Schäfer, Petra Mutzel, Johannes Köster, Nils Kriege, and Sven Rahman- n. Protein complex similarity based on weisfeiler-lehman labeling. Technical report, PeerJ Preprints, 2018.
- [Yuan et al., 2019] Weiwei Yuan, Kangya He, Donghai Guan, Zhou Li, and Chenliang Li. Graph kernel based link prediction for signed social networks. Information Fusion, 46:1-10, 2019.
References were extracted automatically from the PDF and may contain errors.
Full text extracted automatically from the PDF; figures, tables and equations may differ. The PDF is the version of record.
1 Introduction
Graph similarity is a quantitative measurement of topology and attribute characteristics between graphs. Many applications call for a quantitative measure of the similarity of two graphs such as link prediction [Yuan et al., 2019].
Previous proposals with graph kernel have been devoted to graph similarity measurement and made great progress. Kriege et al. propose a kernel based on k-disc frequencies for the graph similarity, which can distinguish fundamental graph properties [Kriege et al., 2018]. A novel graph kernel based link prediction method is proposed by Yuan et al. to predict links by comparing user similarity via signed social network's structural information [Yuan et al., 2019]. But it would be desirable to have a kernel that can take structure into account at different scales [Kondor and Pan, 2016]. One wellknown kernel that account for that is the Weisfeiler-Lehman subtree kernel(WL)[Shervashidze et al., 2011]. Bianca.K [St¨ocker et al., 2018] combines WL to accurately measure the similarity of protein complexes which can be represented by graphs. However, it only focus on connected graph, rarely considering disconnected graphs.
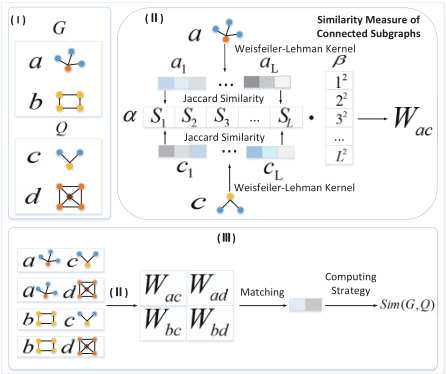
In this paper, we propose a method based on WL for similarity measurement of disconnected graphs. On the one hand, we utilize Weisfeiler-Lehman subtree kernel under different neighbor hops to enhance the information representation of connected subgraphs. On the other hand, we obtain similarity between disconnected graphs by subgraph matching and weighting strategy. Figure 1 provides an illustration of the proposed method.
∗Contact Author
2 Method
Given two disconnected graphs G and Q, where G includes m connected subgraphs {G1,G2, ...,Gm} and Q includes s connected subgraphs {Q1,Q2, ...,Qs}, the goal of similarity measurement is to get a similarity score for G and Q.
Our proposal includes the following steps:
Step 1: Obtain similarity vector α between connected subgraphs.
For connected subgraphs Gx ∈ G, (x ∈ {1, 2, ..., m}) and Qy ∈ Q, (y ∈ {1, 2, ..., s}), Weisfeiler-Lehman kernel is used to get the feature vectors. In the proposed method, we use degree as the initial feature of nodes. Taking Gx as example, we get the sequence of the degrees of nodes in Gx. Then the numbers of degrees are the values in the corresponding vector positions. For example, the degree sequence of subgraph a is (3, 1, 1, 1) in Fig. 1. Therefore, the first of vector a1 will be < 3, 0, 1 >. In the following, we update the features of nodes in Gx, Qy and calculate the current vectors ai and ci, (i ∈ {1, 2, ...,L}) according to nodes' features. Further, similarity Si between ai and ci can be obtained by using Jaccard similarity. Finally, a L-dimensional similarity vector α =< S1, ..., SL > between subgraphs Gx and Qy is obtained.
Step 2: Obtain similarity score of connected subgraphs. By using the L-dimensional similarity vector α, the similarity of Gx and Qy is:
where β =< 12 , 22 , ...,L2 >. In this way, we can get m × s similarity scores for m connected subgraphs of G and s connected subgraphs of Q, referred as W = {WG1Q1 , ..., WG1Qs , ..., WGmQ1 , ..., WGmQs }.
Step 3: Get the finial similarity score Sim(G,Q).
Firstly, we use maximum-weight bipartite matching to select optimal matches between Gx(x ∈ {1, 2, ...,m}) and Qy(y ∈ {1, 2, ..., s}) with the W obtained in above step.
To avoid the unbalance effect of various sizes of subgraphs, we propose to weight the original similarity score of two matched subgraphs. Assuming Gx and Qy are two matched subgraphs, the weighted value is
where |∗| indicates the number of nodes in graph "∗". Finally, the similarity score of graph G and Q is
where M is the set of matched subgraph pairs.
3 Example Applications
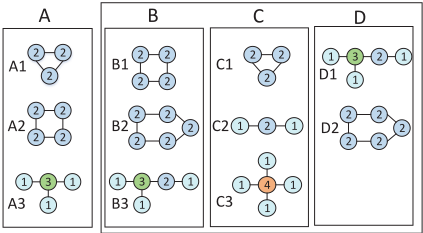
In this section, we apply our approach to measure similarity of the example graphs in Figure 2. The degrees of nodes are used as the initial attribute feature of node, which is labeled on nodes in Figure 2. Table 1 shows the similarity score between A and B,C,D respectively. It can be seen that graph B gains the highest similarity score 16.059 with graph A. The last column is the "alignment rate", which is used to be a metric for the objectivity of evaluation of graph similarity. Taking graph A and graph B as an example, alignment rate between them can be demonstrated as:
where same{Ax,By} and max{Ax,By} mean the number of identical labels and the maximum number of nodes in {Ax, By} respectively and M is the set of matched subgraph pairs in graph A and graph B.
From the results in Table 1, among the graphs B, C and D, graph B is most similar to graph A, because of its highest alignment rate 78.6%. The results are consistent with the facts, verifying the correctness and effectiveness of our proposed method.
| Graphs | Subgraph pairs | Similarity | Alignment Rate |
|---|---|---|---|
| A-B | A1-B2 A2-B1 A3-B3 | 16.059 | 78.6% |
| A-C | A1-C1 A2-C2 A3-C3 | 8.445 | 58.3% |
| A-D | A1-D2 A3-D1 | 11.119 | 70.0% |
4 Conclusions and FutureWork
The proposed method measures the similarity between disconnected graphs. However, the weighting strategy between connected subgraphs is artificially defined and it is desirable to be auto-weighted. Future research direction will focus on applying our method in real data sets such as biological network. Further, achieving automatic weighting by kernelized graph learning is also necessary to improve our approach.
@inproceedings{ijcai2019p904,
  title     = {A Similarity Measurement Method Based on Graph Kernel for Disconnected Graphs},
  author    = {Gao, Jun and Gao, Jianliang},
  booktitle = {Proceedings of the Twenty-Eighth International Joint Conference on
               Artificial Intelligence, {IJCAI-19}},
  publisher = {International Joint Conferences on Artificial Intelligence Organization},
  editor    = {Sarit Kraus},
  pages     = {6430--6431},
  year      = {2019},
  month     = {8},
  note      = {Doctoral Consortium},
  doi       = {10.24963/ijcai.2019/904},
  url       = {https://doi.org/10.24963/ijcai.2019/904},
}
TY - CPAPER TI - A Similarity Measurement Method Based on Graph Kernel for Disconnected Graphs AU - Gao, Jun AU - Gao, Jianliang T2 - Proceedings of the Twenty-Eighth International Joint Conference on Artificial Intelligence, IJCAI-19 PB - International Joint Conferences on Artificial Intelligence Organization PY - 2019 SP - 6430 EP - 6431 DO - 10.24963/ijcai.2019/904 UR - https://doi.org/10.24963/ijcai.2019/904 ER -Copied
Machine-readable versions of this paper, for tools and AI agents:





