
Exploiting POI-Specific Geographical Influence for Point-of-Interest Recommendation
Proceedings of the Twenty-Seventh International Joint Conference on Artificial Intelligence. Main track. Pages 3877-3883.
https://doi.org/10.24963/ijcai.2018/539
Keywords
- Multidisciplinary Topics and Applications: Recommender Systems
- Multidisciplinary Topics and Applications: AI and the Web
Abstract
Point-of-interest (POI) recommendation, i.e., recommending unvisited POIs for users, is a fundamental problem for location-based social networks. POI recommendation distinguishes itself from traditional item recommendation, e.g., movie recommendation, via geographical influence among POIs. Existing methods model the geographical influence between two POIs as the probability or propensity that the two POIs are co-visited by the same user given their physical distance. These methods assume that geographical influence between POIs is determined by their physical distance, failing to capture the asymmetry of geographical influence and the high variation of geographical influence across POIs. In this paper, we exploit POI-specific geographical influence to improve POI recommendation. We model the geographical influence between two POIs using three factors: the geo-influence of POI, the geo-susceptibility of POI, and their physical distance. Geo-influence captures POI?s capacity at exerting geographical influence to other POIs, and geo-susceptibility reflects POI?s propensity of being geographically influenced by other POIs. Experimental results on two real-world datasets demonstrate that POI-specific geographical influence significantly improves the performance of POI recommendation.
- [Bao et al., 2012] Jie Bao, Yu Zheng, and Mohamed F Mok- bel. Location-based and preference-aware recommenda- tion using sparse geo-social networking data. In SIGSPA- TIAL, pages 199-208, 2012.
- [Cheng et al., 2012] Chen Cheng, Haiqin Yang, Irwin King, and Michael R Lyu. Fused matrix factorization with geo- graphical and social influence in location-based social net- works. In AAAI, pages 17-23, 2012.
- [Cho et al., 2011] Eunjoon Cho, Seth A. Myers, and Jure Leskovec. Friendship and mobility: User movement in location-based social networks. In KDD, pages 1082- 1090, 2011.
- [Feng et al., 2017] Shanshan Feng, Gao Cong, Bo An, and Yeow Meng Chee. Poi2vec: Geographical latent represen- tation for predicting future visitors. In AAAI, pages 102- 108, 2017.
- [Gao et al., 2015] Huiji Gao, Jiliang Tang, Xia Hu, and Huan Liu. Content-aware point of interest recommendation on location-based social networks. In AAAI, pages 1721- 1727, 2015.
- [He et al., 2016] Jing He, Xin Li, Lejian Liao, Dandan Song, and William K Cheung. Inferring a personalized next point-of-interest recommendation model with latent be- havior patterns. In AAAI, pages 137-143, 2016.
- [Li et al., 2015] Xutao Li, Gao Cong, Xiao-Li Li, Tuan- Anh Nguyen Pham, and Shonali Krishnaswamy. Rank- geofm: A ranking based geographical factorization method for point of interest recommendation. In SIGIR, pages 433-442, 2015.
- [Li et al., 2016] Huayu Li, Yong Ge, Richang Hong, and Hengshu Zhu. Point-of-interest recommendations: Learn- ing potential check-ins from friends. In KDD, pages 975- 984, 2016.
- [Li et al., 2017] Huayu Li, Yong Ge, Defu Lian, and Hao Liu. Learning user's intrinsic and extrinsic interests for point-of-interest recommendation: A unified approach. In IJCAI, 2017. IJCAI
- [Lian et al., 2014] Defu Lian, Cong Zhao, Xing Xie, Guangzhong Sun, Enhong Chen, and Yong Rui. Geomf: joint geographical modeling and matrix factorization for point-of-interest recommendation. In KDD, pages 831- 840, 2014.
- [Liu and Xiong, 2013] Bin Liu and Hui Xiong. Point-of- interest recommendation in location based social networks with topic and location awareness. In ICDM, pages 396- 404, 2013.
- [Liu et al., 2014] Yong Liu, Wei Wei, Aixin Sun, and Chun- yan Miao. Exploiting geographical neighborhood char- acteristics for location recommendation. In CIKM, pages 739-748, 2014.
- [Liu et al., 2017] Yiding Liu, Tuan-Anh Nguyen Pham, Gao Cong, and Quan Yuan. An experimental evaluation of point-of-interest recommendation in location-based social networks. VLDB, 10(10):1010-1021, 2017.
- [Mikolov et al., 2013] Tomas Mikolov, Ilya Sutskever, Kai Chen, Greg S Corrado, and Jeff Dean. Distributed rep- resentations of words and phrases and their composition- ality. In NIPS, pages 3111-3119, 2013.
- [Saleem et al., 2017] Muhammad Aamir Saleem, Rohit Ku- mar, Toon Calders, Xike Xie, and Torben Bach Pedersen. Location influence in location-based social networks. In WSDM, pages 621-630, 2017.
- [Sun et al., 2017] Zhu Sun, Jie Yang, Jie Zhang, Alessandro Bozzon, Yu Chen, and Chi Xu. Mrlr: Multi-level repre- sentation learning for personalized ranking in recommen- dation. In IJCAI, 2017. IJCAI
- [Tang et al., 2013] Jiliang Tang, Xia Hu, Huiji Gao, and Huan Liu. Exploiting local and global social context for recommendation. In IJCAI, pages 2712-2718, 2013. IJCAI
- [Wang et al., 2015a] Weiqing Wang, Hongzhi Yin, Ling Chen, Yizhou Sun, Shazia Sadiq, and Xiaofang Zhou. Geo-sage: A geographical sparse additive generative model for spatial item recommendation. In KDD, pages 1255-1264, 2015.
- [Wang et al., 2015b] Yongqing Wang, Huawei Shen, Shenghua Liu, and Xueqi Cheng. Learning user-specific latent influence and susceptibility from information cascades. In AAAI, 2015.
- [Xiao et al., 2010] Xiangye Xiao, Yu Zheng, Qiong Luo, and Xing Xie. Finding similar users using category-based lo- cation history. In SIGSPATIAL, pages 442-445, 2010.
- [Xie et al., 2016] Min Xie, Hongzhi Yin, Hao Wang, Fan- jiang Xu, Weitong Chen, and Sen Wang. Learning graph- based poi embedding for location-based recommendation. In CIKM, pages 15-24, 2016.
- [Ye et al., 2011] Mao Ye, Peifeng Yin, Wang-Chien Lee, and Dik-Lun Lee. Exploiting geographical influence for col- laborative point-of-interest recommendation. In SIGIR, pages 325-334, 2011.
- [Yuan et al., 2013] Quan Yuan, Gao Cong, Zongyang Ma, Aixin Sun, and Nadia Magnenat Thalmann. Time-aware point-of-interest recommendation. In SIGIR, pages 363- 372, 2013.
- [Zhang and Chow, 2013] Jia-Dong Zhang and Chi-Yin Chow. igslr: personalized geo-social location recom- mendation: a kernel density estimation approach. In SIGSPATIAL, pages 334-343, 2013.
- [Zhang and Chow, 2015] Jia-Dong Zhang and Chi-Yin Chow. Geosoca: Exploiting geographical, social and categorical correlations for point-of-interest recommenda- tions. In SIGIR, pages 443-452, 2015.
- [Zhang et al., 2016] Fuzheng Zhang, Nicholas Jing Yuan, Kai Zheng, Defu Lian, Xing Xie, and Yong Rui. Exploit- ing dining preference for restaurant recommendation. In WWW, pages 725-735, 2016.
- [Zhao et al., 2017] Shenglin Zhao, Tong Zhao, Irwin King, and Michael R Lyu. Geo-teaser: Geo-temporal sequential embedding rank for point-of-interest recommendation. In WWW, pages 153-162, 2017.
References were extracted automatically from the PDF and may contain errors.
Full text extracted automatically from the PDF; figures, tables and equations may differ. The PDF is the version of record.
1 Introduction
Location-based social networks (LBSNs), such as Foursquare and Gowalla, are increasingly popular, bridging the gap between the physical world and online social networking services [Xiao et al., 2010; Sun et al., 2017]. In LBSNs, users share their locations and content associated with location information, facilitating the understanding of users' preference and behavior [Bao et al., 2012; Liu and Xiong, 2013; Gao et al., 2015; Wang et al., 2015a]. Point-of-Interest (POI) recommendation, i.e., recommending for users unvisited POIs (e.g., restaurants, shopping malls, and theaters) according to users' check-in records, gains great research interest in the last few years [Li et al., 2016; He et al., 2016; Zhang et al., 2016; Li et al., 2017].
One of the most prominent features for POI recommendation is that locations of POIs and target user are critical factors for recommendation. For example, in Gowalla and Foursquare, 90% of users' consecutive check-ins are within the distance less than 50km [Liu et al., 2017]. Therefore, besides modeling users' preference from the interaction between users and POIs, as done in traditional item recommendation, researchers devote to exploiting the geographical proximity or geographical influence among POIs to improve the performance of POI recommendation [Ye et al., 2011; Lian et al., 2014; Xie et al., 2016].
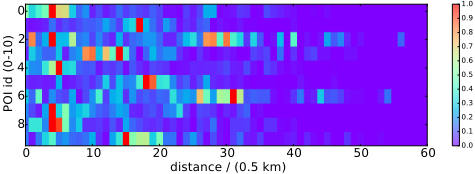
Existing methods that exploit geographical influence for POI recommendation roughly falls into two paradigms. The first kind of methods leverages the geographical proximity to improve the learning of users' preference, assuming that POIs in close proximity to each other share similar user preferences [Liu et al., 2014; Li et al., 2015; Xie et al., 2016; Feng et al., 2017]. For these methods, geographical proximity is used as a kind of spatial regularization for users' preferences. The second kind of methods explicitly models the geographical influence among POIs as the probability or propensity that the two POIs are co-visited by the same user given their physical distance [Ye et al., 2011; Cheng et al., 2012; Zhang and Chow, 2013; Lian et al., 2014; Saleem et al., 2017]. Various forms of functions, e.g., power law function and Gaussian distribution, are employed to capture the co-visited probability distribution of POIs with respect to their physical distance. Although the aforementioned methods gain some success at leveraging geographical influence, they are incapable to capture the high variation of geographical influence across POIs. For example, as shown in Figure 1, 10 randomly-selected POIs in Foursquare dataset exhibit quite different geographical influence, indicating that geographical influence cannot be well captured solely by physical distance and thus geographical influence should be POI-specific.
In this paper, we exploit POI-specific geographical influence to improve POI recommendation. We model the POIspecific geographical influence between two POIs using three factors: the geo-influence of POI, the geo-susceptibility of POI, and their physical distance. Geo-influence captures POI's capacity to spread its visitors to other POIs, and geosusceptibility reflects POI's propensity of receiving visitors from other POIs. For example, subway stations generally have high geo-influence and restaurants usually have high geo-susceptibility. Here, geo-influence and geo-susceptibility are two low-dimensional vectors, and the geographical influence between two POIs is represented by the inner product of the geo-influence vector of one POI and the geo-susceptibility vector of the other POI.
Our model for POI-specific geographical influence has two unique benefits: (1) Geographical influence between POIs is asymmetric, offering high flexibility to capture the high variability of geographical influence across POIs. (2) Instead of directly modeling the POI-specific geographical influence using a POI interaction matrix, our model represent geographical influence by two low-dimensional vectors for each POI, significantly reducing the number of free parameters [Wang et al., 2015b]. Thus, our model is appropriate for POI recommendation which suffers from severe data sparsity issue.
Finally, we integrate POI-specific geographical influence into a standard model that captures users' preference, forming a new POI recommendation method. We train our model using users' check-in records and validate the recommendation performance by applying the model to "predict" the POIs that they are likely to visit in the near future. We conduct extensive experiments on two real-world datasets from Foursquare and Gowalla to illustrate the effectiveness of our model. Experimental results demonstrate that POI-specific geographical influence significantly improves the performance of POI recommendation, outperforming state-of-the-art POI recommendation methods.
2 RelatedWork
In this section, we give a brief review about POI recommendation. POI recommendation recommends for users unvisited POIs according to users' check-in records. Considering users' check-ins are implicit feedback, existing methods model check-ins either by fitting scores converted from check-in counts [Lian et al., 2014] or by optimizing a pairwise ranking of users' preferences to POIs [Li et al., 2015; 2016; Zhao et al., 2017].
Due to the sparsity of users' check-ins, only exploiting check-in counts often suffer from poor performance. Auxiliary information can be incorporated to alleviate this situation. For example, geographical influence is one of the most important factors and it does not exist on the online recommendation sense. Existing methods of modeling geographical influence can be grouped into two categories, i.e., global methods [Ye et al., 2011; Cheng et al., 2012; Zhang and Chow, 2013; Lian et al., 2014] and regional methods [Liu et al., 2014; Li et al., 2015; Xie et al., 2016; Feng et al., 2017].
Global methods model the relation between POIs' cooccurence and their geographical coordinates. Ye et al. [2011] and Lian et al. [2014] respectively use a power-law distribution and a Gaussian distribution to characterize geographical influence over distance. [Cheng et al., 2012; Zhang and Chow, 2013] capture the scatter plot of each user's checkins (e.g., the longitude and latitude) by a fixed distribution. Regional methods consider that POIs in a same geographical region share similar attraction to users. [Xie et al., 2016; Feng et al., 2017; Zhao et al., 2017] use representation-based learning method and restrict POIs in the same region share similar representations. [Liu et al., 2014; Li et al., 2015] directly calculate the attraction of a target POI by considering the attraction of its geographical neighbors. However, global methods and regional methods provide two coarse grained representations of geographical influence, which ignore the POI-specific attributes. We address the problem in this paper.
In addition, many studies have explored other information to facilitate POI recommendation performance, such as social relationship [Tang et al., 2013], temporal factors [Yuan et al., 2013] and category [Zhang and Chow, 2015], etc.
3 Preliminary
We denote with U and I the set of users and the set of POIs respectively. For a user u and a POI i, we denote with cui as the number of times that user u visited POI i, and wui is a scaled version of cui. All POIs that user u visited form his/her check-in history, denoted as Hu. For each POI i, its location is denoted as longitude loni and latitude lati. We use dij to represent the physical distance between POI i and POI j. For each user u, its preference is denoted as a vector ⃗tu. For each POI i, we denote with ⃗zi its preference vector, and denote with ⃗gi and ⃗hi its geo-influence vector and geo-susceptibility vector. We summarize the notations in Table 1.
POI recommendation: Given a set of users U with checkin history H and a set of POIs I with location information (lon, lat), POI recommendation recommends for each target user u ∈ U a list of POIs {i|i ∈ I} consisting of POIs that the target user is potentially interested in but didn't visit up to the recommendation.
4 Model and Optimization
In this section, we describe the proposed model for POI recommendation. The proposed model consists of two parts, one for POI-specific geographical influence and the other for the modeling of user/item preference. The major novelty of the proposed model lies in the POI-specific geographical influence. For user/item preference, we model each check-in as a process of selecting one target POI from all candidate POIs, avoiding the bias caused by directly modeling the number of visiting frequency as a numeric quantity. Next, we describe the POI-specific geographical influence and the modeling of user preference.
| Variable | Description |
|---|---|
| U, I dij cui wui Hu ⃗tu ⃗zi | Set of users, POIs |
| loni, lati | Longitude and latitude of POI i |
| Physical distance between POI i and j | |
| Number of times that user u visited POI i | |
| A scaled version of cui | |
| User u's check-in history ({i|cui > 0}) | |
| Preference vector of user u | |
| Preference vector of POI i | |
| ⃗gi | Geo-influence vector of POI i |
| ⃗hi | Geo-susceptibility vector of POI i |
| Name | Form | Pre-learning |
|---|---|---|
| Power-law function | f (x) = a ∗ xb | Yes |
| Power-law function | f (x) = a ∗ xb | No |
| Exponential function | f(x) = a ∗ xb ∗ ecx | No |
| Hyperbolic function | f(x) = a x-b | No |
4.1 POI-Specific Geographical Influence
For a target POI j, we consider the geographical influence from each POI i in the check-in history Hu of user u. As illustrated in Figure 1, users prefer to visit neighboring POIs, and meanwhile different POIs have their own characteristics that are not well explained by physical distance. To capture the high variation of geographical influence across POIs, we model the geographical influence yij from POI i to POI j as
Here, the vector ⃗gi captures the geo-influence of POI i, i.e., a POI's capacity to spread its visitors to other POIs; the vector ⃗hj reflects the geo-susceptibility of POI j, i.e., a POI's propensity of receiving visitors from other POIs; dij is the physical distance between POI i and POI j.
The rationales behind Eq. (1) are as follows:
- First, f(dij) reflects the probability that two POIs are visited by the same user given their physical distance dij. In this paper, we consider four types of functions, shown in Table 2. In general, f(dij) decreases with the increase of dij, capturing the phenomenon that a user prefers to visit geographically neighboring POIs. Moreover, the parameters of f(dij) could be pre-trained before training the POI recommendation model, or are trained together with the training of the POI recommendation model.
- We model the interaction between a visited POI i and a target POI j as ⃗gT i ⃗hj. In this way, geographical influence between POIs is asymmetric, offering the flexibility
to capture the high variation of geographical influence across POIs. Moreover, instead of directly modeling the POI-specific geographical influence using a POI interaction matrix, our model represents geographical influence by two low-dimensional vectors for each POI, significantly reducing the number of free parameters. Thus, our model is appropriate for POI recommendation which suffers from severe data sparsity issue.
- The POI-specific geographical influence yij essentially captures the joint effect from both the physical distance and the intrinsic characteristics of two POIs. For a target POI j, a geographically neighboring and influencing POI would result in a high y, while a distant but influencing POI (or a neighboring but less influencing POI) would result in a relatively smaller y. The influence score y also depends on the intrinsic characteristics ⃗h of the target POI as well. This makes y different for different target POIs, given the same visited POI i. In other words, the influence score in our model is POI-specific in terms of the POIs involved.
Given the set Hu of visited POIs of user u and Eq. (1), we consider the impact from all these visited POIs and model the overall geographical influence of Hu on a target POI j as
4.2 Preference Modeling and Recommendation
To infer a user's preference to a target POI, we consider the impact from both user preference and geographical influence. Specifically, we denote user u's preference to POI j as suj, which is given as
where ⃗tu and ⃗zj are used to model the interaction between user u's preference and POI j's preference, following the practice of matrix factorization method.
Note that users' check-ins records their visit frequencies at POIs, which is a kind of implicit user preference. Thus, different from traditional recommendation that directly fit cuj, we model each check-in as a process of selecting one target POI from all candidate POIs. In this way, our model avoids the bias caused by directly modeling the number of visiting frequency as a numeric quantity. Specifically, the probability puj that user u prefers POI j is modeled as
where I is the set of POIs and the denominator is a normalization over all POIs for a given user u.
It is observed from Eq. (4) that for a given user u, {puj} serves as a set of parameters for a multinomial distribution. Accordingly, the behavior that user u visits POI j is modeled as the outcome of a decision-making process, where the user picks one POI j out of all the candidates. Check-ins can be then conveniently interpreted as samples drawn from a user's preference distribution {puj}.
We maximizes the log-likelihood of observing users' check-ins:
Since the check-in count cuj often shows a very skewed distribution, the interactions with a few popular POIs may dominate the log likelihood. We thus replace cuj by a scaled version wuj to alleviate the problem. Specifically, we adopt a log-form function [Lian et al., 2014], which is given by wuj = 1+log(1+cuj ×10ϵ ), where ϵ is a scaling parameter. For unvisited POIs, we simply set wuj = 0.
Finally, given a user u, we recommend unvisited POIs according to the probability puj that the user visits a POI j. Each user's recommendation list is composed of the top n POIs with the highest probability puj among the unvisited POIs.
4.3 Optimization
We now present the optimization of four types of latent factors, including ⃗tu, ⃗zj, ⃗gi, ⃗hj and parameters in the geographical function.
We adopt the approach of negative sampling proposed in [Mikolov et al., 2013] to maximize the log likelihood L. For each visited POI, we sample K negative check-ins according to some noisy distribution. Specifically, we use the following objective function to substitute L
where NEG(j) represents the set of negative POIs relative to POI j. δlj is an indicator which equals to 1 if l = j and 0 otherwise, and σ(·) is the sigmoid function.
We adopt the stochastic gradient ascent (SGA) algorithm to optimize the new objective function. In each iteration, we randomly sample a mini-batch of the pair set by a ratio ζ to optimize. The sampling probability is proportional to the scaled check-in count, i.e., wuj. If the pair (u, j) is sampled, the latent vectors will be updated as follows:
where i ∈ Hu, l ∈ j ∪NEG(j), and η is the learning rate.
5 Experiment
5.1 Datasets
We use two real-world datasets from Foursquare [Cho et al., 2011] and Gowalla [Yuan et al., 2013] for evaluation. We preprocess check-ins in Foursquare by removing users who have visited fewer than 10 POIs, and POIs which are visited by fewer than 10 users. In Gowalla the threshold for elimination is set as 40. After preprocessing, there are 172,961 check-ins generated by 6,118 users over 88,193 POIs in the Foursquare dataset and 115,890 check-ins generated by 1,624 users over 3,585 POIs in the Gowalla dataset. Each POI in both datasets is associated with its longitude and latitude. Additionally, in the Foursquare dataset, each POI is marked by 8 categories and 240 subcategories. For each user u, we sort his/her checkins chronologically, and take the early 70% of her check-ins as training data, the next 15% as validation data, and the last 15% as testing data.
5.2 EvaluationMetrics
We adopt two widely-used metrics for evaluation [Lian et al., 2014; Liu et al., 2017], namely, precision@n and recall@n, where n is the number of POIs in the recommendation list.
where P n u is the set of top n POIs in user u's recommendation list, and Tu is user u's ground truth set of POIs. |x| denotes the cardinality of set x. For each metric, we consider 7 values (i.e., 1, 2, 3, 5, 10, 15, 20) of n in our experiments.
5.3 Methods in Comparison
For convenience, we use GeoIE as the name of the proposed POI recommendation method. We evaluate the performance of GeoIE by comparing it with the following representative POI recommendation methods:
- UCF+G [Ye et al., 2011]: It uses a power-law function to capture check-in probability with distance, and then combines a user-based collaborative filtering method.
- MGM+PFM [Cheng et al., 2012]: It uses a multi-center Gaussian model to capture a user's check-in distribution and then combines a probabilistic factor model.
- GeoMF [Lian et al., 2014]: It extends MF by augmenting original users' and POIs' latent factors with users' activity regions and POIs' influence areas.
- RankGeoFM [Li et al., 2015]: It is a ranking-based MF model which includes the geographical influence by considering the attraction of neighboring POIs. According to the recent review for POI recommendation [Liu et al., 2017], RankGeoFM is one of the top-performing methods and serves as one of the state-of-the-art POI recommendation methods.
- Geo-Teaser [Zhao et al., 2017]: It combines a temporal POI embedding model and a geographically hierarchical pairwise ranking method.
precision@n-Foursquare
1 2 3 5 10 15 20
0.06
0.04
0.02
0.00
recall@n-Foursquare
1 2 3 5 10 15 20
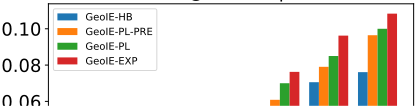
Figure 2: Performance of GeoIE in four types of geographical functions on the Foursquare dataset.
5.4 Experimental Setting
We set the scaling parameter ϵ as 10. We place a L2 regularization term for each latent vector when performing optimization, and the regularization coefficient is set as 0.02. The number of dimension of latent vectors is 32. The number of negative samples K is 10, the sampling ratio ζ as 0.2 and learning rate as 0.001 in each iteration.
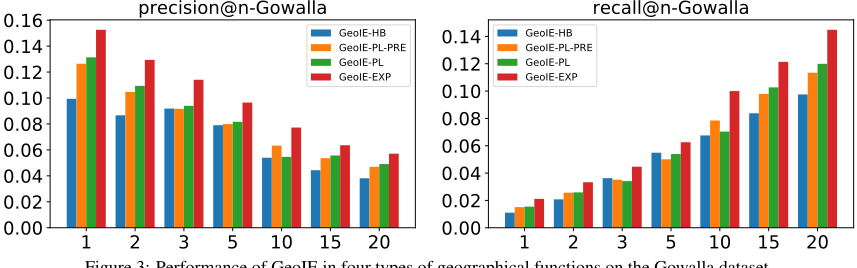
Before comparing our method with baselines, we first evaluate the performance of our method with four different geographical functions, as described in Table 2. The corresponding GeoIE are named as GeoIE-PL-PRE, GeoIE-PL, GeoIE-EXP, and GeoIE-HB. Figure 2 and Figure 3 show the performance of four variants of GeoIE on the Foursquare dataset and the Gowalla dataset respectively. It can be observed in both two figures that exponential function achieves the best performance, which implies that exponential function is the best choice for depicting the relationship between geographical influence and distance on both two datasets used in this paper. The superiority of the exponential function is attributed to that the exponential funciton has more parameters, and thus is flexible to capture the high variation of geographical influence. By comparing GeoIE-PL-PRE and GeoIEPL, we find that they achieve similar performance. However, what needs to be pointed out is that optimizing parameters of geographical function with other latent factors in our model would lead to a faster convergence rate.
5.5 Effectiveness of GeoIE
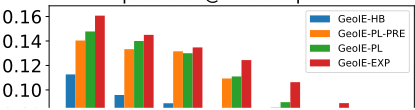
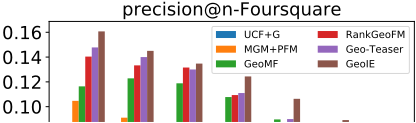
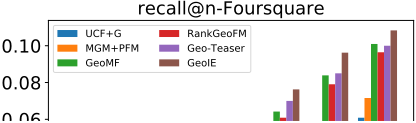
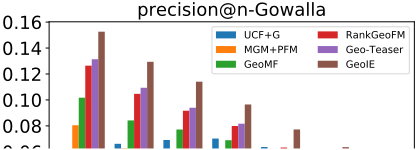
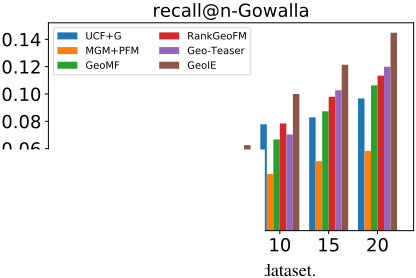
We select GeoIE-EXP as the representative of our method and compare it with state-of-the-art methods. Performance comparison on Foursquare dataset and Gowalla dataset are respectively illustrated in Figure 4 and Figure 5. It is observed that GeoIE-EXP consistently outperforms the competing baseline methods.
Figure 4 shows MGM+PFM performs better than UCF+G on Foursquare. On Gowalla, however, UCF+G outperforms MGM+PFM except when k = 1, as shown in Figure 5. They assume different geographical functions and achieve good performance on two datasets respectively. Different from UCF+G and MGM+PFM which fuse two separate models by linear interpolation, GeoMF integrates user preference and geographical influence into one unified model. Latent factors can be mutually influenced in its parameter learning process, leading to a better performance. However, GeoMF factorizes users' zero check-ins, besides non-zeros check-ins. This may weaken its performance to a certain extent.
RankGeoMF considers geographical influence of neighboring POIs, and utilizes a ranking-based method to explore negative samples. It outperforms GeoMF on both datasets. However, neighboring POIs' attraction cannot be directly taken as target POI's capacity of attracting users. Geo-Teaser integrates representation learning-based method and a geographically hierarchical pairwise ranking method by linear interpolation. We can observe that it is slightly better than RankGeoMF.
In sum, experimental results clearly demonstrate that POIspecific geographical influence improves POI recommendation. The superiority of POI-specific geographical influence over other methods that exploits geographical method offers us two key implications: (1) Geographical influence for POI recommendation is too noisy to be amenable to quantification using a simple function, e.g., power law function or exponential function; (2) The introduction of two additional vectors to characterize POI-specific geographical influence could
0.08
0.06
0.04
0.02
0.00
0.08
0.06
0.04
0.02
0.00
0.06
1 2 3 5 10 15 20
0.06
0.04
0.02
0.00
1 2 3 5 10 15 20
Figure 4: Performance of our method and state-of-the-arts methods on the Foursquare dataset.
0.04
0.02
0.00
1 2 3 5 10 15 20
Figure 5: Performance of our method and state-of-the-arts methods on the Gowalla dataset.
gain remarkable improvement, although POI recommendation suffers from data sparsity issue.
5.6 POI's Geo-Influence and Geo-Susceptibility
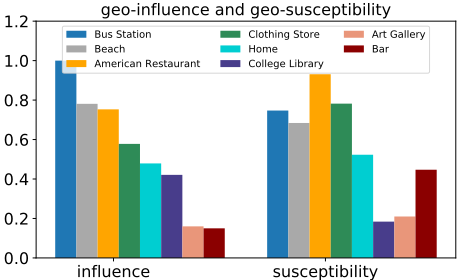
To capture POI-specific geographical influence, we introduce two latent vectors, i.e., the geo-influence and the geosusceptibility for each POI. In what follows, we study the attribute strength of different categories of POIs. Due to the limited space, we just select one subcategory from each category for case study. Specifically, we calculate the average norm of the two types of latent vectors for each subcategory, and divide these norm by the largest one to scale them between 0 to 1. We present these norms in Figure 6.
It can be observed that the Bus station has the largest geoinfluence, suggesting its powerful ability to spread users to other POIs. However, the geo-susceptibility of this influencial subcategory is not the largest. Meanwhile, both of the two attributes of the Bar and the Art Gallery are in a low position, which indicates that they are not important places in users' travel choices. These observations implies each POI has specific geo-influence and the geo-susceptibility, which are also asymmetric. This also verifies our assumption that it's necessary to model POI-specific geographical influence.
6 Conclusions
In this paper, we exploit POI-specific geographical influence to improve POI recommendation. We model the geographical influence between two POIs using three factors: the geo-influence of POI, the geo-susceptibility of POI, and their physical distance. Geo-influence captures POI's capacity at exerting geographical influence to other POIs, and geosusceptibility reflects POI's propensity of being geographically influenced by other POIs. Our model naturally capture the asymmetric geographical influence between POIs, offering high flexibility to capture the high variation of geographical influence across POIs. As future work, it is promising to directly learn a manifold for geographical influence from the interaction between POIs.
Acknowledgments
This work was funded by the National Basic Research Program of China under grant number 2014CB340401, and the National Natural Science Foundation of China under grant numbers 61425016, 61472400, 61433014, and 61602439. Huawei Shen is also funded by Youth Innovation Promotion Association CAS. Wentao Ouyang is also funded by the CAS Pioneer Hundred Talents Program under Grant Number 2920164120.
@inproceedings{ijcai2018p539,
  title     = {Exploiting POI-Specific Geographical Influence for Point-of-Interest Recommendation},
  author    = {Wang, Hao and Shen, Huawei and Ouyang, Wentao and Cheng, Xueqi},
  booktitle = {Proceedings of the Twenty-Seventh International Joint Conference on
               Artificial Intelligence, {IJCAI-18}},
  publisher = {International Joint Conferences on Artificial Intelligence Organization},
  editor    = {Jérôme Lang},
  pages     = {3877--3883},
  year      = {2018},
  month     = {7},
  note      = {Main track},
  doi       = {10.24963/ijcai.2018/539},
  url       = {https://doi.org/10.24963/ijcai.2018/539},
}
TY - CPAPER TI - Exploiting POI-Specific Geographical Influence for Point-of-Interest Recommendation AU - Wang, Hao AU - Shen, Huawei AU - Ouyang, Wentao AU - Cheng, Xueqi T2 - Proceedings of the Twenty-Seventh International Joint Conference on Artificial Intelligence, IJCAI-18 PB - International Joint Conferences on Artificial Intelligence Organization PY - 2018 SP - 3877 EP - 3883 DO - 10.24963/ijcai.2018/539 UR - https://doi.org/10.24963/ijcai.2018/539 ER -Copied
Machine-readable versions of this paper, for tools and AI agents:





