
A Local Algorithm for Product Return Prediction in E-Commerce
Proceedings of the Twenty-Seventh International Joint Conference on Artificial Intelligence. Main track. Pages 3718-3724.
https://doi.org/10.24963/ijcai.2018/517
Keywords
- Machine Learning: Clustering
- Machine Learning: New Problems
- Machine Learning Applications: Big data ; Scalability
- Machine Learning Applications: Other Applications
- Machine Learning: Data Mining
- Machine Learning: Learning Preferences or Rankings
Abstract
With the rapid growth of e-tail, the cost to handle returned online orders also increases significantly and has become a major challenge in the e-commerce industry. Accurate prediction of product returns allows e-tailers to prevent problematic transactions in advance. However, the limited existing work for modeling customer online shopping behaviors and predicting their return actions fail to integrate the rich information in the product purchase and return history (e.g., return history, purchase-no-return behavior, and customer/product similarity). Furthermore, the large-scale data sets involved in this problem, typically consisting of millions of customers and tens of thousands of products, also render existing methods inefficient and ineffective at predicting the product returns.
To address these problems, in this paper, we propose to use a weighted hybrid graph to represent the rich information in the product purchase and return history, in order to predict product returns. The proposed graph consists of both customer nodes and product nodes, undirected edges reflecting customer return history and customer/product similarity based on their attributes, as well as directed edges discriminating purchase-no-return and no-purchase actions. Based on this representation, we study a random-walk-based local algorithm for predicting product return propensity for each customer, whose computational complexity depends only on the size of the output cluster rather than the entire graph. Such a property makes the proposed local algorithm particularly suitable for processing the large-scale data sets to predict product returns. To test the performance of the proposed techniques, we evaluate the graph model and algorithm on multiple e-commerce data sets, showing improved performance over state-of-the-art methods.
- [Andersen et al., 2006] R. Andersen, F. Chung, and K. Lang. Local graph partitioning using pagerank vectors. In 47th Annual IEEE Symposium on Foundations of Computer Sci- ence, pages 475-486, 2006.
- [Andersen et al., 2007] R. Andersen, F. Chung, and K. Lang. Local partitioning for directed graphs using pagerank. In Anthony Bonato and Fan R. K. Chung, editors, Interna- tional Workshop on Algorithms and Models for the Web- Graph, volume 4863, pages 166-178. Springer, 2007.
- [Cassill, 1998] N. L. Cassill. Do customer returns enhance product and shopping experience satisfaction? The In- ternational Review of Retail, Distribution and Customer Research, 8(1):1-13, 1998.
- [Ma and Kim, 2016] Jungmok Ma and Harrison M. Kim. Predictive model selection for forecasting product returns. Journal of Mechanical Design, 2016.
- [Petersen and Kumar, 2009] J. A. Petersen and V. Kumar. Are product returns a necessary evil? antecedents and con- sequences. Journal of Marketing, 73(3):35-51, 2009.
- [Pur et al., 2013] S. Pur, E. Stahl, M. Wittmann, G. Wittmann, and S. Weinfurter. Retourenmanagement im online handel-das beste daraus machen. Technical report, Regensburg: ibi research an der universität Regensburg Gmbh, 2013.
- [Spielman and Teng, 2013] D. Spielman and S. Teng. A lo- cal clustering algorithm for massive graphs and its applica- tion to nearly linear time graph partitioning. SIAM Journal of Computation, 42:1-26, 2013.
- [Toktay et al., 2003] L. B. Toktay, W. L. N. Van, and V. D. R. Guide. Forecasting product returns. Business Aspects of Closed Loop Supply Chains, pages 203-220, 2003.
- [Toktay, 2004] B. Toktay. Business Aspects of Closed Loop Supply Chains, chapter Forecasting product returns, pages 203-209. Carnegie Mellon University Press, 2004.
- [Urbanke et al., 2015] Patrick Urbanke, Johann Kranz, and Lutz Kolbe. Predicting product returns in e-commerce: the contribution of mahalanobis feature extraction? In Proceedings of the 36th International Conference on In- formation Systems (ICIS), 2015.
- [Wood, 2001] S. L. Wood. Remote purchase environments: the influence of return policy leniency on two-stage decision processes. Journal of Marketing Research, 38(2):157-169, 2001.
- [Yang et al., 2017] Hongxia Yang, Yada Zhu, and Jingrui He. Local algorithm for user action prediction towards display ads. In the 23rd ACM SIGKDD International Con- ference on Knowledge Discovery and Data Mining, pages 2091-2099, 2017.
References were extracted automatically from the PDF and may contain errors.
Full text extracted automatically from the PDF; figures, tables and equations may differ. The PDF is the version of record.
1 Introduction
Recent years have seen explosive growth of e-tails (ecommerce retailers and retailing), which are expected to reach $4 trillion by 2020 1 . Meanwhile, numerous studies have shown that about one-third of all e-commerce orders incur returns every year 3 . In today's competitive environment, more and more retailers deploy hassle-free-return policies which improve customer engagement, overall spending amount, purchase rate, customer satisfaction and future buying behavior [Cassill, 1998; Wood, 2001; Petersen and Kumar, 2009]. However, a generous return policy is associated with reduced profit margin induced by high return rate [Pur et al., 2013]. Direct return costs, such as shipping, re-stocking and re-furbishing, and indirect costs, such as call center demand and customer satisfaction, have become a major challenge for the e-commerce industry and have even caused many online retailers to fail to achieve probability 2 . Therefore, it is of significant economic impact to predict customers' return actions while they are searching/browsing products or putting together their shopping cart, and prevent problematic transactions from taking place. However, historical product purchase and return records contain rich information, and can be challenging to integrate in a principled way for the purpose of predicting future returns. To the best of our knowledge, the limited existing work for modeling customer online shopping behaviors and predicting their return actions typically focus on a single type of information. Furthermore, when applied on large-scale data sets consisting of millions of customers and tens of thousands of products, existing work often turns out to be both inefficient and ineffective.
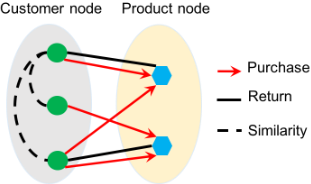
To address these problems, in this paper we propose to use a weighted hybrid graph named HyGraph to represent the rich information in historical records (e.g., return history, purchase-no-return behavior, and customer/product similarity), in order to predict customer return actions with respect to a specific product. The proposed graph consists of both customer nodes and product nodes, as well as directed and undirected edges. The existence of an undirected edge between a pair of customer node and product node indicates that the customer has returned the product before; whereas the existence of a directed edge indicates that the customer has purchased the product without return. In this way, both types of information between customers and products will be taken into consideration when we evaluate customer return propensity towards a product, and similar customers with similar (directed and undirected) connections with the product nodes are expected to have similar return behaviors towards future products. In addition, customers with similar attributes (e.g., age, gender and income) are expected to behave similarly with respect to their return behaviors, and products with similar properties (e.g., style and color) are likely to be returned by the same customer. Hence, there is an undirected edge between a pair of customers (products) if their similarity exceeds a certain threshold. Based on such a hybrid graph, our goal is to build predictive models for identifying top customers who are likely to return a specific product on the catalog in the future. To this end, we propose a random-walkbased local algorithm named LoGraph, to find the cluster consisting of ranked customers centered around the seed node corresponding to the target product. The computational complexity of LoGraph depends on the size of the output cluster, rather than the entire graph, making it particularly suitable for learning from the large-scale data set consisting of historical purchase and return records. The performance of LoGraph is evaluated on multiple e-commerce data sets, showing that it outperforms state-of-the-art techniques.
1 http://www.huffingtonpost.com/michael-lazar/retailers-peoplewant-eas b 12759542.html
2 https://hbr.org/2014/08/online-shopping-isnt-as-profitable-asyou-think
The main contributions of this paper can be summarized as follows.
- We propose HyGraph, a novel weighted hybrid graph to represent the rich information in historical records for modeling customer purchase and return behaviors in ecommerce.
- We propose LoGraph algorithm tailored for HyGraph in order to identify customers who are most likely to return with respect to a specific product.
- We use multiple real-world data sets from leading omnichannel retailers to validate the performance of the proposed graph model and local algorithm, which demonstrate their effectiveness and efficiency as compared to state-of-the-art.
The rest of the paper is organized as follows. In Section 2, we review the related work on predicting product returns and graph partitioning. In Section 3, we introduce the proposed hybrid graph HyGraph followed by the local algorithm LoGraph. Then we present experimental results on real-world data sets in Section 4 and conclude the paper in Section 5.
2 RelatedWork
In this section, we briefly review the existing work on predicting product returns and graph partitioning.
2.1 Prediction of Product Returns
Existing work on return prediction focuses on end-of-life returns that have already been sold for profit and now have the potential of generating additional benefits through remanufacturing or reducing environmental hazards, e.g. electronic products [Toktay et al., 2003]. Simple and naive approaches include either using the proportion of returns to sales with a known life cycle length [Toktay, 2004] or autoregressive-type statistical models to forecast return quantity and time [Ma and Kim, 2016]. These methods are designed to estimate the total return quantity within a time period which cannot predict individual customers' return actions. [Urbanke et al., 2015] investigate Mahalanobis feature extraction for return rate prediction based on product features (e.g., brand, color, size), customer attributes (e.g., past return rate), and basket information, such as the platform from which the basket is ordered, payment method, and total number of products in the basket. This method is not designed for customer-product level prediction and the required information is usually available only when customers have finished their online shopping journey. This could limit the capability for e-tailers to take preventive actions in advance for reducing return rates. The challenges for such applications lie in the large problem scale as well as the sparse history for continuously introduced new products and customers. To address these issues, in this paper, we propose a local algorithm LoGraph and hybrid graph HyGraph for modeling customer return behaviors.
2.2 Graph Partitioning
Today data from many different domains, such as social and information networks, biology, and neuroscience, can be naturally mapped to large graphs (networks). However, mining large graphs to detect optimal clusters of vertices is a NPcomplete problem. Recent years local algorithms for graph partitioning have achieved a time complexity that is close to linear in the number of edges. The first of such methods is NIBBLE [Spielman and Teng, 2013] that attempts to minimize the clustering quality metric cut conductance for undirected binary graphs. Given a starting vertex, it provably finds a cluster near that vertex in time (O(2b log6 m)/φ4 )) that is proportional to the size of the output cluster. Finding a cluster in time proportional to its size is an extremely valuable routine in itself, and the authors show how NIBBLE can be used as a subroutine to repeatedly remove small clusters from a large graph in order to obtain a nearly-linear time graph partitioning algorithm. Later [Andersen et al., 2006] extends NIBBLE using PageRank vectors and develops an algorithm for local unweighted binary graph partitioning that can find a cut with conductance at most φ. [Andersen et al., 2007] further generalize their work to directed binary graph by defining conductance in terms of the stationary distribution of a random walk. More recently [Yang et al., 2017] adapts NIBBLE to undirected andweighted bipartite graphs whose computational complexity is the same as NIBBLE. None of these local algorithms for graph partitioning directly fits our needs where the large massive graphs are weighted and contain both directed and undirected edges.
3 The Proposed Framework
In this section, we introduce the proposed hybrid graph representation (HyGraph) of the rich information in historical customer records, and the local algorithm (LoGraph) for finding customers highly likely to return a given product based on the graph.
3.1 Weighted Hybrid Graph
In order to predict customers' return actions with respect to a specific product, we propose to use weighted hybrid graphs (HyGraph) to represent historical customer purchase/return behaviors and customer/product similarity, as shown in Figure 1. The graph consists of two types of nodes, a customer node set (Vc) and a product node set (Vp), as well as three types of edges, directed edges (-→ Ep) from customer nodes to product nodes reflecting historical purchases without returns, undirected edges (Er) between pairs of customer and product nodes representing historical returns, and undirected edges (Es) showing customer-customer similarity and/or productproduct similarity. Such a design is based on the following key observation: customers with historical returns (undirected edges) are more likely to return a similar product as compared to customers with historical purchases but no returns (directed edges). Furthermore, the presence of a directed edge distinguishes the actions of purchase-withoutreturn and never-purchase. The hybrid graph designed in this way enables us to find more promising results compared to a simple undirected graph, as it contains richer information with the use of both directed and undirected edges.
Given a product node, our goal is to find a local cluster in the HyGraph near this seed node with a low conductance, such that the customers within this cluster are highly likely to return the product. Formally, we have following definitions.
Definition 1. In a HyGraph G = (V,E) with node set V = Vc∪Vp and edge set E = -→ Ep∪Er∪Es; every edge (i, j) ∈ -→ Ep links node i ∈ Vc to node j ∈ Vp (ordered pair of nodes); if an edge (i, j) ∈ Er for i ∈ Vc and j ∈ Vp, then edge (j, i) ∈ Er; if an edge (i, j) ∈ Es for i, j ∈ Vc or i, j ∈ Vp, then edge (j, i) ∈ Es.
In the HyGraph G = (V, E) defined above, the number of nodes equals to n = |V | and the number of edges is given by m = |E|. The HyGraph can be represented by its adjacency matrix A ∈ Rn×n , where the rows and columns represent the nodes of the graph and the entries indicate the edge weight.
Definition 2. The adjacency matrix A of a HyGraph G =
(V, E) is an n × n asymmetric matrix, such that
In the above definition, |Er|ij = |Er|ji = 1 if there is an undirected edges between nodes i and j; and |Er|ij = |Er|ji = 0, otherwise. wp ∈ [0, 1] is a scale factor representing the impact of purchase-without-return actions. In other words, wp > 0 indicates that a customer who has purchased a product without returning it is less likely to return that product upon future purchases. The larger the value of wp, the higher the probability that a customer will keep the product. When there are multiple purchases or multiple purchases with at least one return between a pair of customer-product nodes, the edge weights are combined in the adjacency matrix using wp |-→ Ep|ij + |Er|ij for i ∈ Vc, j ∈ Vp,wp ∈ [0, 1]. Usually customers with similar attributes are expected to behave similarly towards product returns, and products with similar attributes are likely to be returned by similar customers. Thus we introduce weights wcs ij (wps ij ) in the graph representing the similarity between customers (products) i and j calculated as follows.
where wcs is a scale factor reflecting the impact of customer similarity and Jij is the normalized similarity score. Jij can be obtained based on customer attributes using the Pearson coefficient, Jaccard coefficient, and cosine similarity, etc. The weight wps ij is defined in the same way as Eq. (2). Note HyGraph can accommodate more sophisticated similarity measures, however evaluating product similarity is beyond the scope of this paper.
Furthermore, we define the out degree and outgoing edge border on the HyGraph as follows.
Definition 3. The out degree of a node v ∈ V in a HyGraph is defined as
Definition 4. The outgoing edge border of a node set S ⊂ V is defined as the set of outgoing edges from S
where ¯ S is the compliment of S.
3.2 LoGraph Algorithm
In this subsection, we introduce the proposed LoGraph algorithm for finding potential customers that are highly likely to return a specific product. LoGraph is a random-walk-based local algorithm on HyGraph. The random walk starts from a seed node v ∈ Vp. It corresponds to the product node which we would like to predict the set of users who are likely to purchase and return. Let p(u), u ∈ V denote the probability distribution of the random particle over n nodes such that
∑u p(u) = 1. The change in this distribution after one step of the random walk is a linear operator that is realized by multiplying p(u) with the matrix M ∈ Rn×n defined as
where A is the adjacency matrix of the graph defined in Eq. (1), D is the diagonal matrix with diagonal entries (dout 1 , · · · , dout n ) defined in Eq. (3), and I is the identity matrix. According to M, the random walk at each time step stays at the current node with probability 1/2, and otherwise moves to the endpoint of a random edge out of the current node. Under certain conditions [Andersen et al., 2007], the random walk converges to a unique stationary distribution π(u), u ∈ V .
Based on the random walk defined above, using the definition of cut conductance for directed binary graphs in [Andersen et al., 2007], we formulate our problem of product return prediction as finding a local cluster S near seed node v (product node) that minimizes the cut conductance on HyGraph, which is defined based on the stationary distribution as follows.
where the numerator is the stationary out flow across the border of S defined in Eq. (4), and the denominator is the measure of the smaller side of the partition induced by S.
Following [Spielman and Teng, 2013], we define
One can easily check that I(p, 0) = 0 and I(p, 1) = 1. As the distribution p approaches the stationary distribution, the curve I(p, ·) approaches the straight line. Let Sj(p) be the set of j nodes u maximizing p(u)/π(u) and denote Ix(p, x) as the partial derivate of I(p, x) with respect to x, we have
where σ(j) = Sj(p) - Sj-1(p) is the permutation function, such that
for all i. As p(σ(i))/π(σ(i)) is non-increasing, Ix(p, x) is a non-increasing function in x and I(p, x) is a concave function in x. I(p, x) is used as one convergence measure and Ix(p, x) characterizes the normalized probability mass.
Next we introduce our proposed LoGraph in Algorithm 1. It improves over NIBBLE [Spielman and Teng, 2013] in such a way that it is tailored for weighted hybrid graphs and the cut conductance is based on the stationary distribution of random walks instead of node degrees. LoGraph works as follows. It takes as input the hybrid graph G, the product node v ∈ Vp, the upper bound k on the number of customers within the local cluster, the upper bound φ on the conductance of the local cluster, the positive integer b governing the size of the cluster returned and the running time, as well as the stationary distribution π. π is computed offline once the graph is constructed. The output is a set of customer nodes within the identified local cluster. In Steps 1 and 2, we initialize the parameters as tlast = (l + 1)t1 and ϵ = 1/(c3(l + 2)tlast2b ), where tlast = ⌈ 2 φ2 ln(c1(l +2)√(µ(V )/2))⌉, l = ⌈log2(µ(V )/2)⌉, and c1 and c3 are constants. Following the original NIBBLE in [Spielman and Teng, 2013], c1 = 200 and c3 = 1800. Notice that in the HyGraph G with n nodes, for an n × 1 vector p and a positive constant ϵ, define [p]ϵ to be an n × 1 vector such that [p]ϵ(v) = p(v) if and only if p(v) ≥ π(v)ϵ, where π(v) is the stationary distribution at node v, and 0 otherwise. In other words, [p]ϵ is a truncated version of p. Let r0 be an n × 1 indicator vector where the element corresponding to the seed node is one. Steps 4 and 5 generate a sequence of vectors starting at r0 by the following rule
where rt = [qt]ϵ, t > 0. That is, at each time stamp, we let the random walk proceed by one step from the current distribution and then round every qt(u) that is less than π(u)ϵ to 0. Notice that qt and rt are not necessarily probability vectors, as their components may sum to less than 1. Then Step 7 finds the set Sj(qt) consisting of j nodes whose corresponding elements in qt are the largest, and Step 8 determines if this set contains the desired user nodes that correspond to customers with potential returns. In particular, it first checks whether the number of customer nodes exceeds k in Step 9, and then checks the following 3 conditions: C.1 in Step 10 guarantees that the output set has at least cut conductance φ; C.2 in Step 11 ensures that it contains a good amount of volume (e.g., not too much and not too little); C.3 in Step 12 guarantees that the output user nodes have a large probability mass, where c4 = 140, a constant parameter as given in [Spielman and Teng, 2013].
One major benefit of the proposed LoGraph algorithm is its time complexity, which is bounded by O(2b log6 m/φ4 ). In other words, its running time depends only on the size of the output cluster, rather than the entire graph, which makes it particularly suitable for processing large-scale data sets. The detailed proof follows [Spielman and Teng, 2013], and is skipped for brevity.
Compared with the original NIBBLE algorithm [Spielman and Teng, 2013], there are three major differences of the proposed LoGraph algorithm. First, LoGraph is designed for weighted hybrid graphs that include both directed and undirected edges, while NIBBLE is for binary undirected graphs. Second, the cut conductance of LoGraph and NIBBLE is defined differently, where the former is based on the stationary distribution and the latter depends on the node degree. Third, in addition to using b as the input to control the local cluster size, LoGraph uses k, the maximum number of customer nodes in the local cluster. This upper bound is added for practical consideration as retailers need limit their preventive actions to balance benefits and costs.
Algorithm 1 LoGraph Algorithm
Input: G, vp, k, φ, b, π
- Output: The set of user nodes within the local cluster of a given product.
- 1: Compute tlast and initialize ϵ using φ and constants c1, c3.
- 2: Initialize r0 to be an n× 1 all zero vector except for the element that corresponds to vp.
- 3: for t = 1:tlast do
- 4: Set qt =Mrt-1
- 5: Set rt = [qt]ϵ.
- 6: for j = 1 : n do
- 7: Let Sj(qt) denote the set of j nodes whose corresponding elements in qt/π are the largest.
- 8: Return the user nodes in Sj(qt) as the ranked list if the following conditions are satisfied.
- 9:
- C.0 the user nodes in Sj(qt) ≥ k. or
- 10: - C.1: Φ(Sj(qt)) ≤ φ.
- 11: - C.2: 2b ≤ λj(qt) < 56 vol(G).
- 12: - C.3 Ix(qt, 2b ) ≥ 1 c4 (l + 2)2b .
- 13: end for
- 14: end for
- 15: Return an empty set.
4 Experimental Results
In this section, we evaluate LoGraph on e-tail data collected from a leading fashion retailer in Europe. Product returns are a major challenge for online retailers specializing in fashion, where the return rate is often higher than 50% of all purchase 3 . There is great potential and benefit to reduce return rate via modeling customer online shopping and return actions.
4.1 Data Sets and BenchmarkMethods
In this study, we obtain three data sets associated with three different fashion brands. Table 1 summarizes the basic data information. The retailer has a 30 days return policy, thus we discard the last 30 days data to avoid truncation. To mimic online experiments, for each data set, we split it into training, validation, and test sets based on transaction time. To be specific, the transactions in the last month and the month before last month are used as the test set and the validation set, respectively, and the rest as the training set to construct the graph. We choose parameters for each algorithm using the validation set. k the maximum number of customer nodes in the local cluster is set to 1000 for practical consideration. If a product in the test has no transaction records in the training set, we exclude that product from the test set.
We benchmark the performance of LoGraph over two approaches. The first one (Baseline) is a similarity-based method. That is, customers who have returned products similar to the given one in the training set are predicted to return the given product. In this study, the similar products include all those in the same subclass (e.g., jeans) based on product hierarchies. The second approach is ADNI [Yang et al., 2017], which adapts NIBBLE to bipartite graphs for user recommendation in display advertisement. We construct the bipartite graph using customer nodes and product nodes, and define edges based on customer return history with respect to each pair of customer and product nodes. The algorithm is proven to achieve better performance than NIBBLE on undirected graphs [Yang et al., 2017].
3 http://www.retourenforschung.de/
| Metrics | Brand C | Brand E | Brand G |
|---|---|---|---|
| Num. Transactions | 4.9M | 9.2M | 642K |
| Num. Products | 161K | 364K | 33K |
| Num. Customers | 490K | 672K | 146K |
| Ave. Return Rate | 51.5% | 52.8% | 37.4% |
| Time period (month) | 12 | 15 | 5 |
4.2 EvaluationMetrics
Among the customers who have purchased a given product during the test period, we label those belonging to the local cluster obtained from the seed product as positive, i.e., highly likely to return the product, and the rest as negative. We compare these labeled customers with those in the test set who have actually returned the product and count cases of true positive (TP), false positive (FP), and false negative (FN). Across all the products in the test data, we calculate the overall Precision and Recall based on Eq. (10). In our scenario, precision is the return rate of the predicted customers while recall is the fraction of returners that are included in our prediction out of the total returners. We also report F0.5 that weights precision higher than recall. Precision is the most important criterion in our problem as it reflects the confidence for retailers to take preventive actions on target customers.
4.3 Customer and Product Similarity
We add product similarity edge to LoGraph based on product hierarchies. To be specific, there is an edge between two products if they belong to the same subclass (e.g., jeans), class (e.g., bottom) and division (e.g., children). The corresponding weight is given by wps . As the collected data does not include any customer attributes, such as age and income, we leave the customer similarity for future exploration.
4.4 Comparison Results
Table 2 summarizes the performance metrics obtained from all the approaches and data sets. The bold numbers highlight the best performers. LoGraph consistently outperforms Baseline and ADNI regarding all three measures and ADNI outperforms Baseline in two out of three data sets. The Baseline makes prediction purely based on product similarity. ADNI leverages customer return affinity via bipartite graphs. LoGraph further improves the prediction performance by effectively leveraging both product similarity and the rich information in the customer purchase and return history. This demonstrates the effectiveness of modeling various information using HyGraph and making prediction via local algorithm LoGraph.
| Brand | Metrics | LoGraph | ADNI | Baseline |
|---|---|---|---|---|
| C | Precision | 0.820 | 0.756 0.223 | 0.729 0.194 |
| Recall | 0.388 | |||
| F0.5 | 0.671 | 0.512 | 0.470 | |
| E | Precision | 0.868 | 0.733 | 0.700 |
| Recall | 0.285 | 0.162 | 0.212 | |
| F0.5 | 0.616 | 0.430 | 0.479 | |
| G | Precision | 0.759 | 0.697 | 0.648 |
| Recall | 0.735 | 0.697 | 0.516 | |
| F0.5 | 0.891 | 0.820 | 0.751 |
4.5 Parameter Analysis
In this section, we evaluate the impact of input parameters on LoGraph. We sample 0.1% transaction data from Brand E
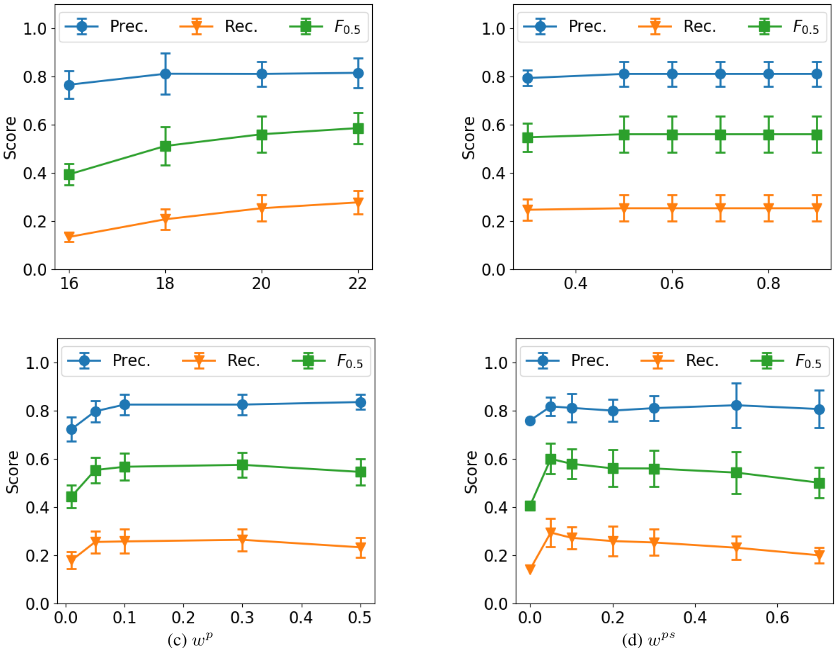
as the evaluation set and the rest for building the HyGraph. We change the input parameters of LoGraph in a range of values and calculate the corresponding precision, recall and F0.5 scores. We repeat the sampling process 10 times and report the mean and standard deviation of above scores as error-bar plots in Figure 2. In all the experiments, we set the maximum number of customer nodes in the local cluster as k = 1000 for practical consideration.
Figure 2(a) shows that as b increases, all the scores increase but recall and F0.5 increase quicker than precision. This is because b controls the size of the output cluster. A larger b leads to a larger cluster, i.e., more customers are predicted to return, thus higher recall and F0.5 scores. Since we set k = 1000, all the scores will approach to constants as b continues to increase. φ determines the cut conductance of the output cluster. Figure 2(b) shows that as φ increases, all the scores increase slightly and then become constants. Similarly, due to the upper limit of the maximum number of customers in the local cluster, the performance metrics is not sensitive to the change of φ. Figure 2(c) and (d) show similar trend that as wp (wps ) increases from 0, all the scores increase significantly. This demonstrates the effectiveness of introducing directed (undirected) edges for modeling purchase-no-return behaviors (product similarity). With wp (wps ) further increases, all the scores decrease. This implies that when the impact of purchase-no-return behaviors (product similarity) in HyGraph is forced to dominate historical return actions, it brings noise to the graph model.
5 Conclusion
Motivated by e-tail applications where a high return rate directly causes increased costs, we propose HyGraph, a novel hybrid graph representation to tackle the customer-product return prediction problem. Compared with the limited existing work, HyGraph is able to effectively model the rich information in historical purchase and return records. Based on this representation, we propose LoGraph, which is a randomwalk-based local algorithm whose running time depends on the size of the output cluster instead of the size of the entire graph. Unlike traditional approaches for graph clustering, the proposed LoGraph algorithm finds a cluster near an input node by only looking at a small neighborhood of this node within the graph. Experimental results on multiple real-world data sets show that the proposed algorithm significantly improves the prediction performance over state-of-the-art techniques.
Acknowledgments
This work is supported by National Science Foundation under Grant No. IIS-1552654, and Grant No. CNS-1629888, the U.S. Department of Homeland Security under Grant Award Number 2017-ST-061-QA0001, and an IBM Faculty Award. The views and conclusions are those of the authors and should not be interpreted as representing the official policies of the funding agencies or the government.
@inproceedings{ijcai2018p517,
  title     = {A Local Algorithm for Product Return Prediction in E-Commerce},
  author    = {Zhu, Yada and Li, Jianbo and He, Jingrui and Quanz, Brian L. and Deshpande, Ajay A.},
  booktitle = {Proceedings of the Twenty-Seventh International Joint Conference on
               Artificial Intelligence, {IJCAI-18}},
  publisher = {International Joint Conferences on Artificial Intelligence Organization},
  editor    = {Jérôme Lang},
  pages     = {3718--3724},
  year      = {2018},
  month     = {7},
  note      = {Main track},
  doi       = {10.24963/ijcai.2018/517},
  url       = {https://doi.org/10.24963/ijcai.2018/517},
}
TY - CPAPER TI - A Local Algorithm for Product Return Prediction in E-Commerce AU - Zhu, Yada AU - Li, Jianbo AU - He, Jingrui AU - Quanz, Brian L. AU - Deshpande, Ajay A. T2 - Proceedings of the Twenty-Seventh International Joint Conference on Artificial Intelligence, IJCAI-18 PB - International Joint Conferences on Artificial Intelligence Organization PY - 2018 SP - 3718 EP - 3724 DO - 10.24963/ijcai.2018/517 UR - https://doi.org/10.24963/ijcai.2018/517 ER -Copied
Machine-readable versions of this paper, for tools and AI agents:





