
Hierarchical Graph Structure Learning for Multi-View 3D Model Retrieval
Proceedings of the Twenty-Seventh International Joint Conference on Artificial Intelligence. Main track. Pages 913-919.
https://doi.org/10.24963/ijcai.2018/127
Keywords
- Computer Vision: Recognition: Detection, Categorization, Indexing, Matching, Retrieval, Semantic Interpretation
- Machine Learning Applications: Applications of Unsupervised Learning
Abstract
3D model retrieval has been widely utilized in numerous domains, such as computer-aided design, digital entertainment and virtual reality. Recently, many graph-based methods have been proposed to address this task by using multiple views of 3D models. However, these methods are always constrained by the many-to-many graph matching for similarity measure between pair-wise models. In this paper, we propose an hierarchical graph structure learning method (HGS) for 3D model retrieval. The proposed method can decompose the complicated multi-view graph-based similarity measure into multiple single-view graph-based similarity measures. In the bottom hierarchy, we present the method for single-view graph generation and further propose the novel method for similarity measure in single-view graph by leveraging both node-wise context and model-wise context. In the top hierarchy, we fuse the similarities in single-view graphs with respect to different viewpoints to get the multi-view similarity between pair-wise models. In this way, the proposed method can avoid the difficulty in definition and computation in the traditional high-order graph. Moreover, this method is unsupervised and is independent of large-scale 3D dataset for model learning. We conduct extensive evaluation on three popular and challenging datasets. The comparison demonstrates the superiority and effectiveness of the proposed method comparing with the state of the arts. Especially, this unsupervised method can achieve competing performance against the most recent supervised & deep learning method.
- [Ankerst et al., 1999] Mihael Ankerst, Gabi Kastenmüller, Hans-Peter Kriegel, and Thomas Seidl. 3d shape his- tograms for similarity search and classification in spatial databases. In Advances in Spatial Databases, 6th Interna- tional Symposium, pages 207-226, 1999.
- [Ansary et al., 2007] Tarik Filali Ansary, Mohamed Daoudi, and Jean-Philippe Vandeborre. A bayesian 3-d search en- gine using adaptive views clustering. TMM, 9(1):78-88, 2007.
- [Bai et al., 2016] Song Bai, Xiang Bai, Zhichao Zhou, Zhaoxiang Zhang, and Longin Jan Latecki. GIFT: A real- time and scalable 3d shape search engine. In CVPR, pages 5023-5032, 2016.
- [Chen et al., 2003] Ding-Yun Chen, Xiao-Pei Tian, Yu-Te Shen, and Ming Ouhyoung. On visual similarity based 3d model retrieval. In Computer graphics forum, volume 22, pages 223-232, 2003.
- [Daras and Axenopoulos, 2010] Petros Daras and Apostolos Axenopoulos. A 3d shape retrieval framework supporting multimodal queries. IJCV, 89(2-3):229-247, 2010.
- [Gao and Dai, 2014] Yue Gao and Qionghai Dai. View- based 3d object retrieval: Challenges and approaches. IEEE MultiMedia, 21(3):52-57, 2014.
- [Gao et al., 2011] Yue Gao, Qionghai Dai, Meng Wang, and Naiyao Zhang. 3d model retrieval using weighted bipartite graph matching. Sig. Proc.: Image Comm., 26(1):39-47, 2011.
- [Gao et al., 2012a] Yue Gao, Jinhui Tang, Richang Hong, Shuicheng Yan, Qionghai Dai, Naiyao Zhang, and T-S Chua. Camera constraint-free view-based 3-d object re- trieval. TIP, 21(4):2269-2281, 2012.
- [Gao et al., 2012b] Yue Gao, Meng Wang, Dacheng Tao, Rongrong Ji, and Qionghai Dai. 3-d object retrieval and recognition with hypergraph analysis. TIP, 21(9):4290- 4303, 2012.
- [Gao et al., 2016] Zan Gao, Deyu Wang, Hua Zhang, Yan- bing Xue, and Guangping Xu. A fast 3d retrieval algorithm via class-statistic and pair-constraint model. In ACM MM, pages 117-121, 2016.
- [Gao et al., 2018] Zan Gao, Deyu Wang, Xiangnan He, and Hua Zhang. Group-pair convolutional neural networks for multi-view based 3d object retrieval. In AAAI, 2018.
- [Hilaga et al., 2001] Masaki Hilaga, Yoshihisa Shinagawa, Taku Komura, and Tosiyasu L. Kunii. Topology match- ing for fully automatic similarity estimation of 3d shapes. In SIGGRAPH, pages 203-212, 2001.
- [Krizhevsky et al., 2012] Alex Krizhevsky, Ilya Sutskever, and Geoffrey E. Hinton. Imagenet classification with deep convolutional neural networks. In NIPS, pages 1106- 1114, 2012.
- [Leibe and Schiele, 2003] Bastian Leibe and Bernt Schiele. Analyzing appearance and contour based methods for ob- ject categorization. In CVPR, pages 409-415, 2003.
- [Li and An, 2017] Wenhui Li and Yang An. View-wised dis- criminative ranking for 3d object retrieval. Multimedia Tools and Applications, 1:1-15, 2017.
- [Liu et al., 2015] Anan Liu, Zhongyang Wang, Weizhi Nie, and Yuting Su. Graph-based characteristic view set extrac- tion and matching for 3d model retrieval. IS, 320:429-442, 2015.
- [Liu et al., 2016] Anan Liu, Weizhi Nie, Yue Gao, and Yut- ing Su. Multi-modal clique-graph matching for view- based 3d model retrieval. IEEE Trans. Image Processing, 25(5):2103-2116, 2016.
- [Liu et al., 2017] AnAn Liu, Weizhi Nie, Yue Gao, and Yut- ing Su. View-based 3-d model retrieval: A benchmark. IEEE Transactions on Cybernetics, 2017.
- [Nie et al., 2013] Liqiang Nie, Meng Wang, Yue Gao, Zheng-Jun Zha, and Tat-Seng Chua. Beyond text QA: multimedia answer generation by harvesting web informa- tion. IEEE Trans. Multimedia, 15(2):426-441, 2013.
- [Nie et al., 2016] Liqiang Nie, Xuemeng Song, and Tat-Seng Chua. Learning from Multiple Social Networks. Synthe- sis Lectures on Information Concepts, Retrieval, and Ser- vices. Morgan & Claypool Publishers, 2016.
- [Savva et al., 2016] Manolis Savva, Fisher Yu, Hao Su, Masaki Aono, Baoquan Chen, and et al. Large-scale 3d shape retrieval from shapenet core55. In 9th Eurographics Workshop on 3D Object Retrieval, 3DOR, 2016.
- [Su et al., 2015] Hang Su, Subhransu Maji, Evangelos Kalogerakis, and Erik G. Learned-Miller. Multi-view con- volutional neural networks for 3d shape recognition. In ICCV, pages 945-953, 2015.
- [Webber et al., 2010] William Webber, Alistair Moffat, and Justin Zobel. A similarity measure for indefinite rankings. ACM Trans. Inf. Syst., 28(4):20:1-20:38, 2010.
- [Yang et al., 2018] Jianbai Yang, Jian Zhao, and Qiang Sun. 3d model retrieval using constructive-learning for cross- model correlation. Neurocomputing, 275:1-9, 2018.
References were extracted automatically from the PDF and may contain errors.
Full text extracted automatically from the PDF; figures, tables and equations may differ. The PDF is the version of record.
1 Introduction
The rapid development of graphics hardware and computing techniques has led to the wide application of 3D models, such as digital entertainment, CAD and virtual reality. Confronting with the huge and ever-increasing 3D data, effective 3D model retrieval algorithms have become mandatory.
∗Corresponding Author.
3D model retrieval techniques aim to find the relevant models from the 3D model dataset for the query model. The existing approaches can be grouped into two paradigms, namely, model-based and view-based methods. In early stage, a lot of works [Ankerst et al., 1999; Hilaga et al., 2001] utilized the spatial structure information to represent 3Dmodels. The limitation of these methods is that the performance is seriously restricted by the low-quality models and expensive computation. The view-based methods usually learn to describe 3D objects based upon their 2D appearances from different viewpoints. The literatures report that view-based methods can usually get better performances than model-based methods [Daras and Axenopoulos, 2010]. Consequently, view-based methods have attracted much more attention in recent years.
View-based methods usually select the characteristic views [Ansary et al., 2007; Gao et al., 2012a; Nie et al., 2013; Liu et al., 2015], by using one of the multiple views [Gao and Dai, 2014] or pooling the multiple views into one view [Su et al., 2015; Li and An, 2017] to represent the discriminative characteristics of individual models. Therefore, the retrieval performance mainly depends on the ability of representative view selection, which is usually accomplished by view clustering and center selection with visual features. However these methods can loss the spatial structure information of multiple views and are sensitive to redundant information. To leverage the structural information to measure the similarity between pairwise models, the graph-based framework is used to explore the many-to-many similarity measure between pairwise sets of views belonging to two different 3D models [Gao et al., 2011; Nie et al., 2016; Liu et al., 2016; Yang et al., 2018]. However, these methods usually face several critical problems: 1) it might loss important information of individual models by only selecting parts of views to reduce expensive computational complexity. 2) it is not easy and intuitive to define the similarity between pairwise nodes in many-to-many graphs matching. 3) it is difficult to explore the relation between nodes in high-order graph, which might lead to the variation of the similarity between pairwise nodes and directly has the negative influence on the robustness of similarity measure between models.
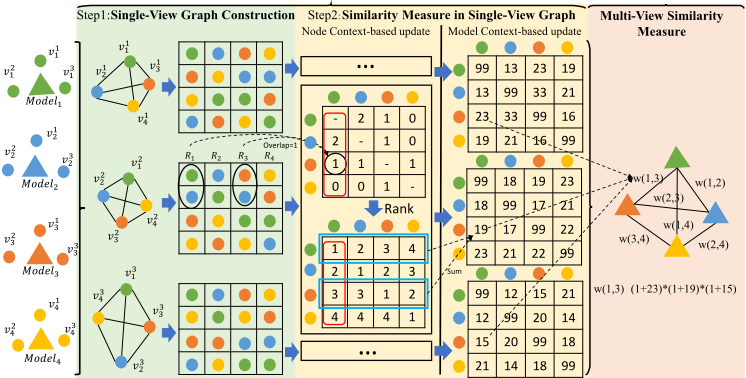
To address the aforementioned problems, we propose an hierarchical graph structure learning method (HGS) (Figure 1). This method contains two hierarchies. In the bottom hierarchy, we present the method for single-view graph gen- Bottom Hierarchy Top Hierarchy eration and further propose the novel method for similarity measure in single-view graph by discovering and leveraging both node-wise and model-wise context. In the top hierarchy, we fuse the similarities by single-view graphs with respect to different viewpoints to get the multi-view similarity between pair-wise models. In this way, the proposed method can effectively avoid the difficulty in definition and computation in the traditional high-order graph. In particular, this paper targets on developing the unsupervised method for 3D model retrieval since currently there is seriously lack of large-scale 3D model datasets, which seriously constrain the implementation of supervised methods for real applications.
The contributions of this paper are summarized as follow:
- We propose a novel hierarchical graph structure learning solution for multi-view 3D model retrieval. It can decompose the complicated multi-view graph-based similarity measure into multiple single-view graph-based similarity measure and fusion. Consequently, it can significant simplify the computation of many-to-many graph matching for similarity measure.
- For similarity measure in the single-view graph, we propose two novel strategies, the node context-based strategy and the model context-based strategy, to enhance the robustness for similarity measure in diverse subspaces.
- We conduct extensive experiments on three popular 3D model datasets. The experimental results demonstrate the superiority of this method compared with the state of the arts. Especially, this unsupervised method can achieve competing performance against the most recent supervised & deep learning method [Gao et al., 2018].
The remainder of this paper is organized as follows. In Section 2, we introduce the related work of view-based 3D model retrieval. Section 3 presents the proposed approach in detail. Experimental results are introduced in Section 4. Finally, we conclude the paper in Section 5.
2 RelatedWork
According to the type of model learning for view-based methods, they can be grouped into two classes, unsupervised and supervised methods.
Unsupervised Methods. Adaptive Views Clustering [Ansary et al., 2007] provided the optimal selection of 2D views from a 3D model. Then it utilized a probabilistic Bayesian method for 3D model retrieval. Weighted Bipartite Graph Matching [Gao et al., 2011] was built with representative views and the matching result was used to measure the similarity between two different 3D models. [Gao et al., 2012b] addressed the model retrieval task by constructing multiple hypergraphs for a set of 3D models based on 2D views. This method can explore the higher order relationship among 3D models. [Gao and Dai, 2014] implemented the hierarchical agglomerative clustering to cluster views and the view with the shortest distance to the views in each cluster is selected as the characteristic view. A graph-based characteristic view set extraction and matching for 3D model retrieval is proposed in [Liu et al., 2015]. They used the graph clustering method for view grouping and the random-walk algorithm was applied for constructing a view-graph model. MultiModal Clique Graph Matching [Liu et al., 2016] replaced individual node of the classic graph by one clique, which consists of k nearest neighbors in the feature subspace to convey local structural attributes and the similarity of both cliquegraph was computed by considering their structural characteristics.
Supervised Methods. Unlike the unsupervised methods, without label information, the supervised methods can utilize the class information during the training stage to benefit model learning. [Gao et al., 2012a] proposed the Camera Constraint-Free View-based method which combined the positive matching model and the negative matching model trained based on the classic Gaussian model. A ClassStatistics and Pair-Constraint method is originally proposed for 3Dmodel retrieval in [Gao et al., 2016]. It was composed of the supervised class-based statistics model and the pairconstraint object retrieval model. Group-Pair Convolutional Neural Networks [Gao et al., 2018] utilized the pair-wise learning scheme to train the deep model to solve the problem caused by the insufficient training samples.
3 Methodology
In this section, we first overview the hierarchical graph structure learning (HGS) method. Then we will illustrate each step in detail.
3.1 Overview
The proposed hierarchical graph structure method consists of two hierarchies as shown in Figure 1:
BottomHierarchy: This module aims to discover the correlation among multiple 3D models with respect to individual viewpoints. It consists of two key steps and both steps will be detailed in Section 3.2 & 3.3, respectively.
1) Single-View Graph Construction: This step uses the corresponding views of individual models, captured from the same viewpoint, as the nodes to initialize multiple singleview graphs. In each single-view graph, we compute the similarity between all pairwise nodes and get the ranked neighbor set of each model.
2) Similarity Measure in Single-View Graph: This step aims to enhance the robustness of similarity measure between pair-wise nodes in the single-view graph. Specifically, we develop two strategies to strengthen the robustness of similarity measure in the single-view graph, including the node contextbased strategy and the model context-based strategy.
Top Hierarchy: This module aims to fuse the similarities in single-view graphs with respect to different viewpoints to get the multi-view similarity between pair-wise models. The similarity among 3D models can be utilized to generate the ranking list for retrieval. The method for multi-view similarity measure will be detailed in Section 3.4.
3.2 Single-ViewGraph Construction
Different from the traditional graph matching, which utilizes 2D images of one individual 3D model together to build a multi-view graph G = (V,E) for 3D model representation, we decompose it into multiple single-view graph construction and fusion. We first build the single-view graph to measure the similarity of different models from single viewpoint. We use Fi = {f 1 i , f 2 i , f 3 i , ..., f s i } to represent the multi-view visual features of the ith 3D model, where i ∈ [1, N] means the index of the 3D model and t ∈ [1, s] means the index of the viewpoint with respect to the tth viewpoint. For the construction of the single-view graph, we consider f t i (i ∈ [1,N]) of individual 3D models as nodes 1 . The weight of the edge between the ith and j th models in the single-view graph with respect to the tth viewpoint can be computed by:
1 The other view selection methods and related evaluation will be presented in Section 4.2
We can use D(i, j, t)(j ∈ [1,N]) to measure the similarity between pair-wise models and generate the ranked neighbors of the ith model, Ri = (M1,M2, ...,MN). M1 in Ri indicates the nearest neighbor of the ith model. For all models, we can compute the ranked neighbor set R = {R1,R2, ...,RN}. Consequently, we can utilize the views of different models as nodes and the ranked neighbor set R as the weights to construct single-view graphs, which correspond to individual viewpoints for view selection.
3.3 SimilarityMeasure in Single-ViewGraph
Intuitively it is very sensitive to directly use the edge weight of the constructed single-view graph as the similarity between two 3D models with respect to one viewpoint since each 3D model has complicated spatial structure and multiview appearances. In this section, we propose two strategies to enhance the robustness of similarity measure in singleview graph, including the node context-based strategy and the model context-based strategy.
a. Node Context-Based Strategy
Considering there exist multiple feature subspaces with respect to different viewpoints, it is not reasonable to directly fuse multiple single-view graphs with the edge weights computed in isolated feature subspace as introduced in Section 3.2. To tackle this problem, we first utilize the indexes of neighbors in R for similarity measure. Rq(i) is used to denote the index of the ith model in the ranked neighbor set Rq. Obviously, if the index of the ith model is ahead of the j th model in Rq (Rq(i) < Rq(j)), the ith model is more similar to the qth model than the j th model .
Intuitively, the similar 3D models can have similar neighbor sets. Therefore, the context in the neighbor sets can benefit enhancing similarity measure. We define the k order neighbor set as N(i, k) to denote the top k neighbors in Ri:
where ∀x ∈ ¯ Ri, y ∈ Ri - ¯R. Motivated by the distance between two top k neighbor sets N(i, k) and N(j, k) defined in [Webber et al., 2010], we define the similarity between N(i, k) and N(j, k) as:
Eq.3 compares the overlap of two ranked neighbor sets with k neighbors. We can use Q(i, j, k) to replace the edge weight between the ith&j th node in the single-view graph. Then we rank the weights in each neighbor set. We update the edge weight between the ith and j th models, w(i, j), with the index of the j th model in the neighbor set of the ith model.
b. Model Context-Based Strategy
With the aforementioned strategy, we can fully leverage the correlation between pair-wise models for similarity measure.
However, it losses the context among the 3D models in the datasets. Therefore, we further leverage the correlation among multiple models as the model-level context to enhance similarity measure.
Given models p, x, y, the distance between the xth model and the yth model with respect to the pth model can be computed as follow:
w(p, x) & w(p, y) denote the index value of model x & y in the neighbor set of model p, respectively. The pth model is an anchor to compare the similarity between the xth&yth model. Intuitively, the edge weight w(x, y) between two models can be affected by both the model p and all the models in the dataset. Consequently, Eq. 4 can be rewritten as:
Where k denotes the top k neighbor models selected as the anchors. We can use the computed weights in Eq.5 as the similarity to re-rank the neighbors of each 3D model and get the updated similarity between model x and model y.
3.4 Multi-View SimilarityMeasure
Each 3D model is usually represented by a set of 2D view images, which are captured from different viewpoints. With the aforementioned methods in Section 3.2 and 3.3, we can construct single view-based graph to measure the similarity between pair-wise 3D model with respect to specific viewpoint. Therefore, we need to fuse the similarities by multiple single-view graphs with respect to different viewpoints to get the multi-view similarity between pair-wise models, ˆ d(i, j). ˆ d(i, j) can be utilized to re-rank the neighbor set and get the final retrieval results. We define ˆ d(i, j) between the ith&j th models as:
where s is the number of viewpoints. We add 1 to the weight between two nodes to avoiding that they have no overlap neighbor set and consequently w equals to 0.
4 Experiment
4.1 Dataset and Evaluation Criteria
Three popular 3D model datasets are utilized for evaluation, including ETH [Leibe and Schiele, 2003], MV-RED [Liu et al., 2017] and NTU [Chen et al., 2003].
To evaluate the performance of 3D model retrieval, we employ seven popular criteria, including NN, FT, ST, FMeasure, DCG, ANMRR and AUC as [Liu et al., 2017]. The higher value means the better performance while the lower value of ANMRR indicates the better performance.
4.2 Experiment Setting
For visual feature extraction, we adopt the AlexNet model [Krizhevsky et al., 2012], which was pre-trained on the ImageNet dataset, and use the output of the second last fullyconnected layers as visual representation. In our experiment, the initialized view number is set with 41, 73, 60 on ETH, MVRED and NTU datasets, respectively. We further analyze the sensitivity caused by s (the view number ), k (the neighbor number) and T (iteration num) in Section 4.3.
According to the order of view selection, we evaluated the proposed method under three scenarios: 1) Original view ranking (HGS-O): The view selection is fixed based on the camera locations. Under this scenario, the selected views can capture spatial structure information of individual 3D model. Since it requires strict viewpoint selection, this scenario can be regarded as the easiest one. 2) Random view ranking (HGS-R): We randomly select the view indexes from the set of view images of individual 3D model. This scenario imitates the real application when a person randomly takes several pictures of one model and retrieves it in the dataset with these pictures. Since this scenario does not impose any constraint on viewpoint selection, it can be regarded as the most difficult one for real application. 3) Sorted view ranking (HGS-S): We re-rank all views by computing the distance between each view and the center of all views in specific feature space. Compared with the former two scenarios, this one only request loose constraint on view selection.
To show the superiority of the proposed method, several representative methods are used for comparison. They can be grouped into two groups:
- Unsupervised methods: AVC [Ansary et al., 2007], HAUS [Gao and Dai, 2014], NN [Gao and Dai, 2014], WBGM [Gao et al., 2011], MCG [Liu et al., 2016]. The experiment results are shown in Section 4.3.
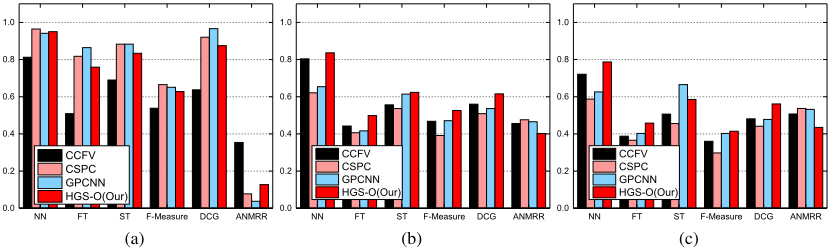
- Supervised methods: CCFV [Gao et al., 2012a], CSPC [Gao et al., 2016], GPCNN [Gao et al., 2018]. The experiment results are shown in Section 4.4.
4.3 Comparison with UnsupervisedMethods
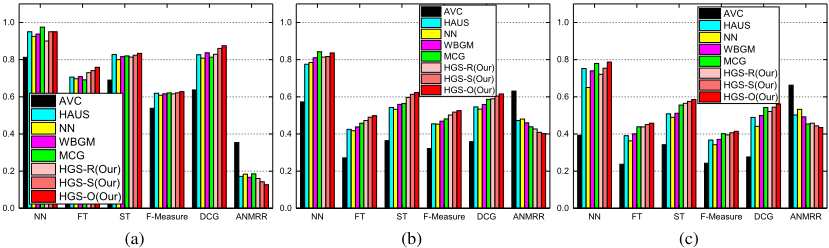
The comparison of the proposed method against the unsupervised methods are shown in Figure 2. It is obvious that the proposed method can generally outperform the competing methods. Especially, HGS-O can get the best performances on all datasets under three scenarios.
From Figure 2 (a), on ETH, HGS-O can achieve the gain of 3.3% - 25%, 0.4% - 14.4%, 0.2% - 8.9%, 3.4% - 23.8% in terms of FT, ST, F-measure, DCG, and the decline of 2.4% - 22.7% in terms of ANMRR. Comparing to MCG, one of the best state-of-the-art methods on this task, HGS-O is worse than MCG in terms of NN while it can outperform MCG in terms of all the other criteria by 0.7% - 6.8%.
Figure 2 (b), on MVRED, HGS-O can achieve the gain of 2.6% - 26.4%, 4% - 22.7%, 6% - 25.9%, 4.5% - 20.4%, 2.9% - 25.7% in terms of NN, FT, ST, F-measure, DCG, and the decline of 3.6% - 22.9% in terms of ANMRR.
Figure 2 (c), on NTU, HGS-O can achieve the gain of 0.2% - 39.3%, 2% - 22.1%, 3% - 24.4%, 1.3% - 17.1%, 1.2% - 28.5% in terms of NN, FT, ST, F-measure, DCG, and the decline of 1.9% - 22.8% in terms of ANMRR.
Comparing HGS-R, HGS-O and HGS-S, we have three key observations: 1) HGS-O can generally get the best performances with the prior knowledge of the view order. 2) HGS-S can not only achieve approximated performances to HGS-O but also relax the requirement of viewpoint selection by HGSO. 3) It is not quite surprised to see that HGS-R works worst by eliminating any requirement of viewpoint selection. However, it can still produce the competing results on all datasets comparing to the state of the arts.
GIFT [Bai et al., 2016] is a very popular method for 3D model retrieval and ranked 1st on the perturbed dataset in SHREC2016 large-scale 3D shape retrieval contest [Savva et al., 2016]. We further compare HGS and GIFT in the setting of original view ranking (12 views). For fair comparison, we extracted the CNN features by AlexNet for both methods. We implemented the source code of GIFT by [Bai et al., 2016]. HGS can achieve 83.7%, 31.6%, 40.1%, 4.1%, 37.7%, 22.6%, 65.9% against 77.7%, 31.4%, 39.8%, 3.7%, 36.8%, 22.3%, 66.2% by GIFT in terms of NN, FT, ST, F-measure, DCG, AUC and ANMRR. Obviously, HGS can achieve competing performances against GIFT.
Sensitivity Analysis on Neighbor Number
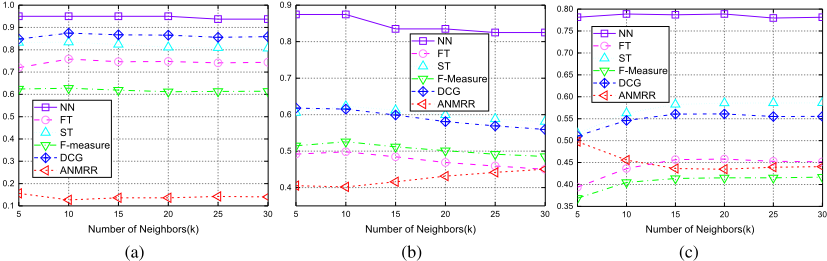
In our experiment, we vary k from 5 to 30 with a step size of 5 to evaluate its effect on the performance. The performances on three datasets are shown in Figure 3. From Figure 3, we can observe that the performances increase with the change of k. The upper bound performance can be obtained when k is optimal. When k is smaller or bigger than the optimal one, the performance will be degraded. It is obvious that too few neighbors might not provide enough context information and too many neighbors might add noise information. Besides, when k increases beyond the optimal one, our method can still be stable with only little decline. It demonstrates the proposed method is stable with respect to this parameter. According to this evaluation, we can choose the optimal k for three datasets (10, 10, and 20 for ETH, MVRED, and NTU, respectively).
Sensitivity Analysis on View Number
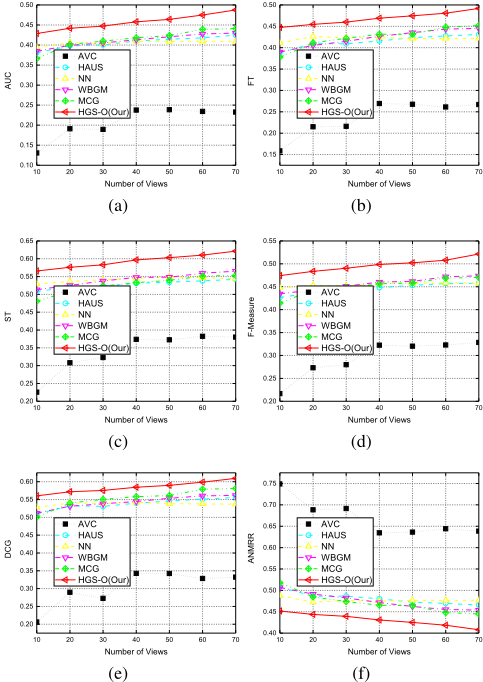
For 3D model retrieval in real applications, it is always expected that we only capture the view images of query 3D model as few as possible. For the sensitivity analysis on the view number, we vary it to explore the robustness of the proposed method. Specifically, we tune the view number from 10 to 70 with a step size of 10 on MVRED, the most challenging 3D dataset for real objects in our daily life. By the comparison in Figure 4, we have the 3 key observations:
1) All methods can improve the performances by increasing view numbers. This trend is reasonable since more views can provider more structural and visual information for both visual representation and similarity measure.
2) HGS-O can outperform all the competing methods in terms of AUC, FT, ST, F-measure, DCG and ANMRR when increasing the view number. Comparing with the second best method, HGS-O can still achieve the gain of 4.7%, 4.0%, 6.9%, 5.2%, 2.8%, 3.7% in terms of AUC, FT, ST, F-measure, DCG and ANMRR, respectively. Moreover, the performance of HGS-O increases stably when varying the view numbers from 10 to 70.
3) HGS-O can achieve the best performance only with the fewest views. As shown in Figure 4, HGS-O with 40 views can outperform all the competing methods even with 70 views. In particular, HGS-Owith 40 views can outperform the second best method with 70 views by 1.7%, 1.7%, 4.4%, 2.8%, 0.3% and 1.4% in terms of AUC, FT, ST, F-measure, DCG and ANMRR.
| T | NN | FT | ST | F-measure | DCG | ANMRR |
| 1 | 0.787 | 0.458 | 0.586 | 0.414 | 0.561 | 0.435 |
| 2 | 0.790 | 0.461 | 0.591 | 0.422 | 0.570 | 0.423 |
| 3 | 0.796 | 0.463 | 0.594 | 0.436 | 0.576 | 0.422 |
| 4 | 0.796 | 0.463 | 0.594 | 0.436 | 0.576 | 0.422 |
Sensitivity Analysis on Iteratively Weight Updating
To refine the distance among models, the new weights w can be updated based on Eq. 5 in an iterative manner. We evaluate the performance according to variations of iteration (T) on NTU dataset. From Table 1, the performance can get saturated when T=3, which demonstrates the robustness of our method in achieving high effectiveness.
4.4 Comparison with SupervisedMethods
In this section, we compare the proposed method with three popular supervised methods, including CCFV [Gao et al., 2012a], CSPC [Gao et al., 2016] and GPCNN [Gao et al., 2018]. From Figure 5, it is obvious that HGS-O outperforms all three supervised methods on MVRED and NTU and achieve competing results on ETH. For example, HGS-O can achieve the gain of 16.1%, 5.6%, 1.2%, 8.3% in terms of NN, FT, F-measure, DCG and decline the ANMRR by 9.7% comparing with GPCNN on NTU. To our knowledge, GPCNN achieved the best performance on ETH by designing a new deep convolutional architecture for feature learning. Comparing with HGS-O, GPCNN can only get insignificant improvement on ETH, which only contains 80 objects. However, it costs expensive computational complexity for deep network training. From our viewpoint, GPCNN can be considered as overfitting since training the complicated deep network of GPCNN is highly dependent on large-scale 3D data. It is extremely challenging to collect the large-scale 3Dmodel dataset at present. Comparatively, the proposed method can achieve competing performance in the unsupervised manner. Therefore, it is more practical for real applications.
5 Conclusion
This paper proposes an hierarchical graph structure learning method for 3Dmodel retrieval. First, the single-view graph is constructed and the similarity in the single-view graph can be computed by leveraging both node-wise context and modelwise context. Then, the similarities by single-view graphs with respect to different viewpoints can be fused to get the multi-view similarity between pair-wise models. The proposed method can effectively avoid the difficulty in solving the many-to-many graph matching problem in the traditional high-order graph. Moreover, this method is unsupervised and is independent to large-scale 3D dataset for model learning. Extensive comparison demonstrates its superiority and effectiveness.
Acknowledgements
This work was supported in part by the National Natural Science Foundation of China (61772359, 61472275, 61502337).
@inproceedings{ijcai2018p127,
  title     = {Hierarchical Graph Structure Learning for Multi-View 3D Model Retrieval},
  author    = {Su, Yuting and Li, Wenhui and Liu, Anan and Nie, Weizhi},
  booktitle = {Proceedings of the Twenty-Seventh International Joint Conference on
               Artificial Intelligence, {IJCAI-18}},
  publisher = {International Joint Conferences on Artificial Intelligence Organization},
  editor    = {Jérôme Lang},
  pages     = {913--919},
  year      = {2018},
  month     = {7},
  note      = {Main track},
  doi       = {10.24963/ijcai.2018/127},
  url       = {https://doi.org/10.24963/ijcai.2018/127},
}
TY - CPAPER TI - Hierarchical Graph Structure Learning for Multi-View 3D Model Retrieval AU - Su, Yuting AU - Li, Wenhui AU - Liu, Anan AU - Nie, Weizhi T2 - Proceedings of the Twenty-Seventh International Joint Conference on Artificial Intelligence, IJCAI-18 PB - International Joint Conferences on Artificial Intelligence Organization PY - 2018 SP - 913 EP - 919 DO - 10.24963/ijcai.2018/127 UR - https://doi.org/10.24963/ijcai.2018/127 ER -Copied
Machine-readable versions of this paper, for tools and AI agents:





