
Who to Invite Next? Predicting Invitees of Social Groups
Proceedings of the Twenty-Sixth International Joint Conference on Artificial Intelligence. Main track. Pages 3714-3720.
https://doi.org/10.24963/ijcai.2017/519
Keywords
- Multidisciplinary Topics and Applications: AI and Social Sciences
- Multidisciplinary Topics and Applications: Personalization and User Modeling
Abstract
Social instant messaging services (SMS) such as WhatsApp, Snapchat and WeChat, have significantly changed the way people work, live, and communicate, attracting increasing attention from multiple disciplinary including computer science, sociology, psychology, and physics. In SMS, social groups play a very important role in supporting communication among multiple users. An interesting question arises: what are the dynamic mechanisms underlying the group evolution? Or more specifically, in an existing group, who should be invited to join? In this paper, we formalize a novel problem of predicting potential invitees of groups.
Employing WeChat, the largest social messaging service in China, as the source for our experimental data, we develop a probabilistic graph model to capture the fundamental factors that determine the probability of a user to be invited to a specific social group. Our results show that the proposed model indeed lead to statistically significant prediction improvements over several state-of-the-art baseline methods.
- [Adamic and Adar, 2003] Lada A Adamic and Eytan Adar. Friends and neighbors on the web. Social networks, 25(3):211-230, 2003.
- [Asur et al., 2009] Sitaram Asur, Srinivasan Parthasarathy, and Duygu Ucar. An event-based framework for characterizing the evolutionary behavior of interaction graphs. ACM Transactions on Knowledge Discovery from Data (TKDD), 3(4):16, 2009.
- [Backstrom et al., 2006] Lars Backstrom, Dan Huttenlocher, Jon Kleinberg, and Xiangyang Lan. Group formation in large social networks: membership, growth, and evolution. In Proceedings of the 12th ACM SIGKDD international conference on Knowledge discovery and data mining, pages 44-54. ACM, 2006.
- [Barabási and Albert, 1999] Albert-László Barabási and Réka Al- bert. Emergence of scaling in random networks. science, 286(5439):509-512, 1999.
- [Barabâsi et al., 2002] Albert-Laszlo Barabâsi, Hawoong Jeong, Zoltan Néda, Erzsebet Ravasz, Andras Schubert, and Tamas Vic- sek. Evolution of the social network of scientific collabora- tions. Physica A: Statistical mechanics and its applications, 311(3):590-614, 2002.
- [Chakrabarti et al., 2006] Deepayan Chakrabarti, Ravi Kumar, and Andrew Tomkins. Evolutionary clustering. In Proceedings of the 12th ACM SIGKDD international conference on Knowledge discovery and data mining, pages 554-560. ACM, 2006.
- [Church and de Oliveira, 2013] Karen Church and Rodrigo de Oliveira. What's up with whatsapp?: comparing mobile instant messaging behaviors with traditional sms. In Proceed- ings of the 15th international conference on Human-computer interaction with mobile devices and services, pages 352-361. ACM, 2013.
- [Donath and Hoffman, 1973] William E Donath and Alan J Hoff- man. Lower bounds for the partitioning of graphs. IBM Journal of Research and Development, 17(5):420-425, 1973.
- [Ducheneaut et al., 2007] Nicolas Ducheneaut, Nicholas Yee, Eric Nickell, and Robert J. Moore. The life and death of online gaming communities:a look at guilds in world of warcraft. In Conference on Human Factors in Computing Systems, CHI 2007, San Jose, California, Usa, April 28 -May, pages 839-848, 2007.
- [Glass and Li, 2010] R. Glass and S. Li. Social influence and in- stant messaging adoption. j comput inf syst. Journal of Computer Information Systems, 51(2):24-30, 2010.
- [Hammersley and Clifford, 1971] John M Hammersley and Peter Clifford. Markov fields on finite graphs and lattices. 1971.
- [Han and Tang, 2015] Yu Han and Jie Tang. Probabilistic com- munity and role model for social networks. In Proceedings of the 21th ACM SIGKDD International Conference on Knowledge Discovery and Data Mining, pages 407-416. ACM, 2015.
- [Hopcroft et al., 2004] John Hopcroft, Omar Khan, Brian Kulis, and Bart Selman. Tracking evolving communities in large linked networks. Proceedings of the National Academy of Sciences, 101(suppl 1):5249-5253, 2004.
- [Kairam et al., 2012] Sanjay Ram Kairam, Dan J. Wang, and Jure Leskovec. The life and death of online groups:predicting group growth and longevity. In International Conference on Web Search and Web Data Mining, WSDM 2012, Seattle, Wa, Usa, February, pages 673-682, 2012.
- [Kim and Leskovec, 2013] Myunghwan Kim and Jure Leskovec. Nonparametric multi-group membership model for dynamic net- works. In Advances in Neural Information Processing Systems, pages 1385-1393, 2013.
- [Kschischang et al., 2001] Frank R Kschischang, Brendan J Frey, and Hans-Andrea Loeliger. Factor graphs and the sum- product algorithm. Information Theory, IEEE Transactions on, 47(2):498-519, 2001.
- [Leskovec and Horvitz, 2008] Jure Leskovec and Eric Horvitz. Planetary-scale views on a large instant-messaging network. In International Conference on World Wide Web, pages 915-924, 2008.
- [Murphy et al., 1999] Kevin P Murphy, Yair Weiss, and Michael I Jordan. Loopy belief propagation for approximate inference: An empirical study. In Proceedings of the Fifteenth conference on Uncertainty in artificial intelligence, pages 467-475.
- [Newman, 2001] Mark EJ Newman. Clustering and preferential at- tachment in growing networks. Physical review E, 64(2):025102, 2001.
- [O'Hara et al., 2014] Kenton P O'Hara, Michael Massimi, Richard Harper, Simon Rubens, and Jessica Morris. Everyday dwelling with whatsapp. In Proceedings of the 17th ACM conference on Computer supported cooperative work & social computing, pages 1131-1143. ACM, 2014.
- [Palla et al., 2007] Gergely Palla, Albert-László Barabási, and Tamás Vicsek. Quantifying social group evolution. Nature, 446(7136):664-667, 2007.
- [Qiu et al., 2016] Jiezhong Qiu, Yixuan Li, Jie Tang, Zheng Lu, Hao Ye, Bo Chen, Qiang Yang, and John E Hopcroft. The lifecy- cle and cascade of wechat social messaging groups. In Interna- tional Conference on World Wide Web, pages 311-320, 2016.
- [Sun et al., 2007] Jimeng Sun, Christos Faloutsos, Spiros Papadim- itriou, and Philip S Yu. Graphscope: parameter-free mining of large time-evolving graphs. In Proceedings of the 13th ACM SIGKDD international conference on Knowledge discovery and data mining, pages 687-696. ACM, 2007.
- [Tang et al., 2009] Jie Tang, Jimeng Sun, Chi Wang, and Zi Yang. Social influence analysis in large-scale networks. In KDD'09, pages 807-816, 2009.
- [Tang et al., 2013] Jie Tang, Sen Wu, and Jimeng Sun. Confluence: Conformity influence in large social networks. In KDD'13, pages 347-355, 2013.
- [Yang et al., 2010] Jiang Yang, Xiao Wei, Mark S. Ackerman, and Lada A. Adamic. Activity lifespan: An analysis of user survival patterns in online knowledge sharing communities. 2010.
References were extracted automatically from the PDF and may contain errors.
Full text extracted automatically from the PDF; figures, tables and equations may differ. The PDF is the version of record.
1 Introduction
The emergence of social instant messaging services, such as WhatsApp and WeChat, bring a revolutionary change to the way people work, live and communicate with each other. One of the most exciting functions of social instant messaging services is that people are able to create groups, which can greatly facilitate one-to-many communication and bring people strong sense of community. Thanks to this function, a project team can form a chat group which contains all the team members to publish instant notices and coordinate schedules among members. A school class can also create a chat group to share information within the class and facilitate communication after they graduate. The advantages of chat groups are noticed by many businesses who create groups to develop their VIP customers. Social groups play a very important role in social networks, and have a significant impact on the ecological environment of the social networks. On one hand, the group can strengthen the inner relationship among users, and provide a way to know new friends. On the other hand, the members in a group can determine the life cycle of the group to a large extent, because if the members in a group do not know each other or have nothing in common, the group usually dies in less than a week, and we can predict it by the structure of the group [Qiu et al., 2016]. User's opinion in a group may also conform to the others due to the group pressure [Tang et al., 2013]. Therefore, an interesting and meaningful challenge emerges, which is how to predict who will be invited to join the groups. We refer to this challenge as invitee prediction problem.
Due to the importance of the groups, many works have been conducted to analyze and model the dynamics of groups. For example, [Hopcroft et al., 2004] investigated how groups changed over time by analysing several snapshots of a citation graph ranging from 1990 to 2001, where they investigate the emergence of new communities corresponding to new research topics. [Chakrabarti et al., 2006] introduced evolutionary clustering framework to make a tradeoff between current data and the consistency of sequential time stamps for clustering algorithms. [Palla et al., 2007] conducted an analysis of dynamic communities on two popular datasets, one is a network of phone calls between customers of a mobile phone company in a year's time, and the other is a collaboration network between scientists. [Ducheneaut et al., 2007] examined some of the factors that could explain the success or failure of a game guild based on more than a year of data collected from five World of Warcraft servers. [Kairam et al., 2012] analyzed data from several thousand online social networks built on the Ning platform with the goal of understanding the factors contributing to the growth and longevity of groups within these networks.
However, all the above works mainly focus on observing and analyzing the evolution of the whole group, but not the individual members. Furthermore, the groups in these works are very different from the groups in social messaging networks such as WeChat 1 , an online instant messaging network like WhatsApp. Let's take a look at the unique characters of the social messaging networks, which are mainly lie in three aspects:
- Definite Membership. Unlike other online social networks where the community membership of users is sometimes probabilistic or inferred by some algorithms
1 http://www.wechat.com/en/
based on analysing the distribution of edges, such as Spectral Clustering proposed by [Donath and Hoffman, 1973], in most social messaging networks, the group membership of users is definite.
- Privacy. In many social instant messaging networks, such as WeChat, the groups are invisible to their nonmembers even if they know the names of the groups. The growth of groups is in an invitation-only style, i.e., the only way for a user to join a group is being invited by one of the members of this group.
- LimitedCapacity. Inmost social instant messaging networks, the size of a group is limited. For example, in WeChat, the size of a group is maximal to 500. If the size of a group is larger than 100, the invitees must be real-name authenticated.
Due to these unique characters, the sense of community in social instant messaging networks is much stronger than other online social networks. For both reasons, we need to devise new models and algorithms to address the problem of invitee prediction in social messaging networks. [Backstrom et al., 2006] studied how the evolution of the communities relates to properties such as the structure of the underlying social networks based on DBLP and LiveJournal data sets in which the membership of users is definite, and use decision-tree technique to predict the users' probabilities of joining a group based on the user's structural features. [Qiu et al., 2016] investigated this issue on social instant messaging networks and predict invitees with Support Vector Machine. However, both two works only exploit the static features to predict invitees, ignoring the influence of other users and group constraints on the probability of invitation, leading to an unsatisfactory performance.
Unlike the previous works, we aim to focus on individual users, and develop a reasonable model that can capture all the information and factors from network structure which reflect or have correlation with the users' probabilities of being invited to the groups to predict who will be invited to join the groups in the next period. To this end, we study the invitation behavior and mine the potential factors at three levels including group level, peer level and individual level, and analyze the different ways in which these factors affect the users' probabilities of being invited to the groups. We formulate the question and carefully design a novel model based on factor graph theory, which integrates all the different potential factors into a unified framework to predict invitees of the groups. We apply our model to real-world data set, and the experimental result shows that our model significantly outperforms the baseline methods. To our best knowledge, this is the first work which investigates factors at all three levels and integrates all the potential factors from different levels into an unified model to predict invitees of social messaging groups. The contribution in this paper includes:
- We study the correlation between the probability of being invited to the groups and various factors at different levels on a real-world social instant messaging network.
- We propose a model integrating all the factors into one unified framework to predict invitees of social messaging groups. We apply our model on a real-world social
messaging network, achieving better performance than the baseline methods.
2 ProblemFormulation
The friendship between a pair of users in a social messaging network is usually reciprocal, so we use an undirected graph G = (V,E,C) to denote a snapshot of the structure of a social messaging network, where V = {v1, v2, ..., vn} is the set of all the users, and E = {e1, e2, ..., em} is the set of the edges between the users, representing the friendship between two users, and C = {c1, c2, ..., ck} is the set of all the groups. A group ci ∈ C is denoted as ci = {Vci ,Eci }, where Vci is the set of all the nodes belonging to group ci, and Eci is the set of all the edges among Vci .
Definition 1 Fringe Node(User). A fringe node of a group is a node that has at least one friend belonging to this group, that is:
Definition 2 Fringe-Group Pair. A fringe-group pair consists of a group and one of its fringe nodes, denoted as y = (v, c), which is a data point in our model. We can extract all these data points forming a set denoted as Y .
Definition 3 Invitation. For a data point yi = (v, c) and a time stamp t, let yt i = 1 denote that v is invited into c at time stamp t, and yt i = 0 denote that user v is not invited into c.
Problem 1 Invitee Prediction. Let < 1, ..., t > be a sequence of time stamps. Please note that the intervals between these time stamps do not need to be equal. We use < G1 , ..., Gt > to denote the snapshots of the network structure, and < Y 1 , ..., Y t > to denote the invitation behaviors at all the time stamps. Our goal is to learn a prediction function
to infer the invitation behaviors and invitees at time t + 1.
3 Observations: Who would be invited?
3.1 Data
All the research work in this paper is based on the daily usage logs from WeChat messaging platform, which is one of the largest standalone messaging services, having over a billion created accounts and 938 million active users as of 2017.We collect all the valid chat groups with names created during half an hour. We only use non privacy data such as network structural information for research. We analyze all the dynamic information about these groups from their births to one year later, involving more than 3 millions users, 4 millions edges and almost 1 million invitation records.
3.2 Observation
The users' probabilities of being invited to join the groups could be affected by many factors from the groups, the other users and themselves. We try to quantitatively capture these factors. In this subsection, we investigate all the three kinds of factors, i.e., group constraint, peer correlation and individual structure attributes, which are at three levels separately.
- (c) Probability of being invited
- (d) Probabilities of being invited
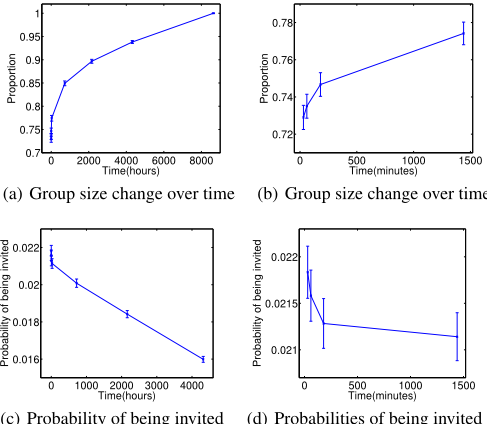
Figure 1: Size of groups and probabilities of being invited change with time. (b) and (d) are the zoomed versions with respect to the time period from 0 to 24 hours. All the probabilities are observed at a 0.95 confidence interval.
Group Constraint
The groups change all the time, and the fringe users' probabilities of being invited to the groups change accordingly. In this subsection, we investigate this correlation qualitatively. To clearly illustrate the process of the groups evolve in one year, we set 7 observation points between their births and one year later, which are half an hour after their births, one hour after their births, three hours after their births, twenty-four hours after their births, one month after their births, three months after their births, six months after their births, nine months after their births and the end of the observation window, i.e. one year later after their births. We take the size of each group at the end of the observation window as the denominator, and calculate the percentage of each group's size at each observation point. We plot the results in Figure 1, where we can see that the chat groups grow at different velocities at different stages in their life cycles. They grow fast in the early stage after their births, and grow slower as the time passes, as shown in Fig.1(a). With the size of groups get bigger, the fringe users of groups get more, and the probabilities of being invited into the group get smaller accordingly, as shown in Fig.1(c). To distinctly illustrate the development in the first twenty-four hours, we zoom it in Fig.1(b) and Fig.1(d). Both two metrics are observed at a 95% confidence interval.
Peer Correlation
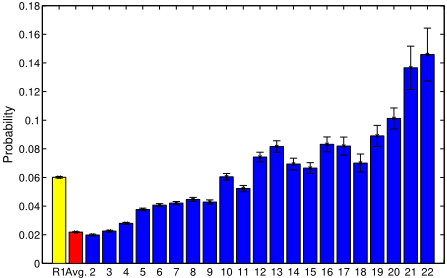
We think that the two fringe users' probability of being invited to a group have some kinds of correlation if they are similar enough with regard to this group. In other words, if one fringe user is invited to join the group, her/his similar fringe user with regard to this group, which we name as fellow fringe user, is probably invited to this group later. We define this kind of similarity, or fellowship, in two ways. First, if two fringe users of a group are friends, we take them as fellow fringe users of this group. The other case is that if two fringe users of a group have more than two common friends already in this group, they are also regarded as fellow fringe users. The left part of Fig.2 is a toy example of a social messaging network, v4 and v5 are the first kind of fellow fringe users, while v1 and v2, v3 and v4 are both the second kind of fellow fringe users. We plot the fringe users' probabilities of being invited into the groups in the case that one of their fellow fringe users have been invited to the groups in Fig.3. The yellow bar represents the first kind of fellowship, while the blue bars represent the second kind. The X-axis numbers under blue bars stand for the numbers of common friends already in the group which the fellow fringe users share with each other. For comparison, we plot the average probability of all the fringe users with a red bar. Obviously, the more common friends they share, the stronger correlation their probabilities of being invited to the groups have.
Closeness Between Fringes and Groups
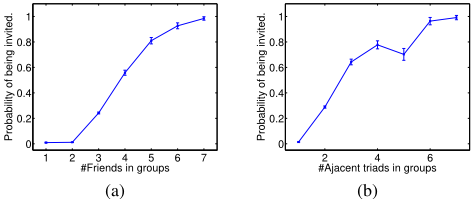
Social messaging groups are usually created with a subject, such as a school class, a project team, or a big family, etc, so there is an intuition that the closer a fringe user to the subject of the group, the more likely she/he gets an invitation into the group. We can measure this kind of closeness between a user and a group based on the structure of the network. We study the effect of the closeness on the probability of being invited to the groups. The way to examine and measure the closeness between the fringe users and the chat groups can be defined from many aspects. To demonstrate this issue, we take structure attributes for example, which are the number of the fringe users' friends already in this group and the number of the fringe users' adjacent triads in this group 2 . For both metrics, the larger the numbers, the closer the fringe users to the groups. Figure 4 is the probabilities of being invited to a chat group as a function of the two metrics, showing that the closer the fringe users to the chat groups, the more likely for fringe users to be invited to the groups, which is in accord with our intuition.
2 The adjacent triads of a node is the triads it take part in. The number of a fringe user's adjacent triads in the group is the number of its adjacent triads with the other two nodes both in this group.
4 Invitees Prediction
From the above observation we can see that the fringe nodes' probabilities of being invited to the group have correlation with factors from all the three levels, i.e. the group level, the peer level and the individual level. So how to reasonably incorporate and utilize all these factor to predict invitees is a challenge. In this section, we propose an unified model, Multi-Level Factor Graph Model (ML-FGM), to capture all these correlations and predict invitees.
4.1 Model Description
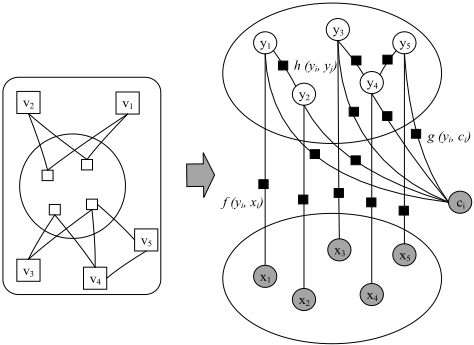
Fig. 2 represents the graphical structure of ML-FGM. The left part of Fig. 2 represents the input social instant messaging network which can be transformed to a graphical model as shown in the right part. In ML-FGM, each fringe-group pair (v, c) is mapped to a variable node y, and the correlations between the label of y and all kinds of factors are modeled as factor nodes. Corresponding to the three levels, we design the following three kinds of factor nodes.
- Group factor. g(yi, ci) represents the correlation between yi and the corresponding group, where ci denotes the corresponding group of yi.
- Peer factor. h(yi,R(yi)) represents the correlation between yi and the fellow fringe nodes, where R(yi) denotes the set of the fellow fringe nodes of yi.
- Individual factor. f(yi, xi) represents the correlation between yi and its structural attributes, where xi denotes the attributes set of yi.
Let θ be the parameters set of our model. Then our task can be described as to find a θ∗ so as to maximize the posterior probability of Y t+1 , i.e. P(Y t+1 |G1,...,t , Y 1,...,t ). Calculating the posterior probability directly is intractable in such an social messaging network. However, we can simplify the maximization by factorizing the "global" probability as a product of "local" factors on the basis of factor graph theory proposed by [Kschischang et al., 2001]. Given G1,...,t and Y 1,...,t , we get the posterior probability of Y t+1 :
The three factors can be instantiated in different ways. To reflect the way that the factors affect or have correlation with the posterior probability we want to maximize, we define the group factor and the individual factor as:
where g′ (·) represents the group's attributes, and f ′ (·) is a vector of features measuring the intimate degree between a fringe node and its group; α and γ are their weighting vectors. For the peer factor, we model it in a Markov random field. By the Hammersley-Clifford theorem[Hammersley and Clifford, 1971], we can define it as:
where h′ (·) is a indicator function to indicate whether the two fringe nodes have a fellowship, and β is the weighting vector for all the cases.
4.2 Model Learning
Given the model, we need to estimate its parameters θ = {α, β, γ}, which can be solved by two steps. First we figure out the objective function of this problem. Second, we find a configuration for the free parameters that maximize the log-likelihood of the objective function, i.e.,
Combining Eqs.2, 3 and 4 into Eq.1, we can get the loglikelihood objective function as follows.
where Z = ZαZβZγ is a normalization factor, and R is the set of all the fellow relationships among fringe nodes. To solve the optimization problem, we adopt a gradient decent method (or a Newton-Raphson method). Specifically, we compute the partial derivatives of the objective function(Eq.5) with regard to each parameter, and get their gradients, which are follows: (Please note that in the following equations, without ambiguity, we use Y ′ , G, and Y to replace Y t+1 , G1,...,t and Y 1,...,t in Eq.1 respectively for simplicity.)
In the first equation, E[∑Ni=1 g′ (yi, ci)] is the expectation of the group factor functions given the data distribution over Y ′ , G and Y in the training set, while EPα(Y ′ |G,Y )[∑Ni=1 g′ (yi, ci)] is the expectation of the group factor functions under the distribution Pα(Y ′ |G, Y ) given by the estimated model. Similar meaning can be drawn for the other two equations. To solve the problem of the intractability of the marginal distribution Pθ(Y ′ |G, Y ), which is caused by the circles in the structure of our graphical model, we adopt Loopy Belief Propagation(LBP), proposed by [Murphy et al., 1999]. Then the maximization of log-likelihood of the objective function can be achieved in two steps. First, we use LBP to compute marginal distribution of unknown variables Pθ(Y ′ |G, Y ) and the gradient of θ. Second, we update θ with a learning rate η:
4.3 Inferring Invitees
With the estimated parameter θ, we can infer the labels of variable nodes by finding a label configuration which maximizes the log-likelihood of the objective function, i.e.
5 Experiments
Having introduced ML-FGM and the algorithm to estimate the parameters, we now apply the model to real world data to predict invitees of the chat groups. A tricky and delicate task is how to set the time interval between time stamps
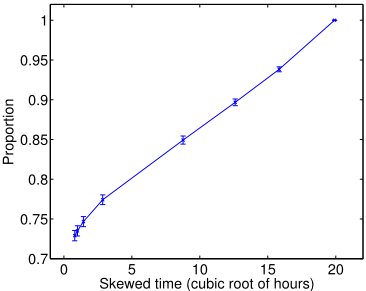
(1, ..., t, t + 1). Most previous works on behavior prediction usually take a fixed time unit, such as one day, one week, etc, as the time interval. However, from Fig.1 we can see that the size of groups increases faster in the early stage and slower in the later stage, so it is obviously not reasonable to set an equal time interval for every two adjacent time stamps. In this paper, we adopt an elastic time interval strategy that we take the length of time interval as the cubic function of the sequence number of the time stamps. Specifically, based on the observation, we set 1 hour as the time unit, so the first time stamp is 1 hour later after the births of the groups, and the second time stamp is 23 = 8hrs later after the births of the groups, and the next time stamp is 33 = 27hrs later, and so on. This method is inspired by the phenomenon that if we skew time axis by extraction of cubic root, we can get a "linear"-like increment of size of groups as shown in Fig.5. We predict invitees at the third time stamp, i.e. Y 3 , based on the information of the former two time intervals, i.e. < G1 , G2 > and < Y 1 , Y 2 >.
To evaluate the effectiveness of our model, we use two types of baseline methods. The previous works in this field usually utilize existing classification algorithms to solve such kind of issue as stated in Section 1. They take attributes of the nodes as their features to train a model, and use this model to predict whether a fringe node could be invited to join the group. We adopt this kind of methods as our first kind of baselines. Specifically, we choose Support Vector Machine (SVM) and C4.5 to be the representatives of this line of methods. In addition, we found that this question can be converted into another form and addressed by the algorithms for link prediction. Concretely, we can take the groups as a special kind of nodes, named as virtual nodes. There will be a link between an ordinary node and a virtual node if the node is a member of the corresponding group represented by the virtual node. Therefore predicting whether a fringe node could be invited to the group is equivalent to predicting whether a link could be established between an ordinary node and a virtual node. The mainstream ideas of link prediction with only topological information are measuring the proximity between the two nodes, denoted as x, y, with their sets of neighbors, denoted as Γ(x), Γ(y). In this case, if x represents a group, Γ(x) actually represents the set of members of this group. Here, we choose two popular predictor Adamic/Adar [Adamic and Adar, 2003] and Preferential Attachment [Barab´asi and Albert, 1999; Newman, 2001; Barabˆasi et al., 2002] as the baseline methods in which the scores between x and y are defined as:
| Models | Precision | Recall | F1-measure |
|---|---|---|---|
| SVM | 0.502 | 0.269 | 0.351 |
| C4.5 | 0.482 | 0.269 | 0.346 |
| Adamic/Adar | 0.403 | 0.237 | 0.298 |
| Preferential Attachment | 0.395 | 0.239 | 0.298 |
| ML-FGM | 0.639 | 0.303 | 0.411 |
- Adamic/Adar: score(x, y) = Σz∈Γ(x)∩Γ(y) 1 log |Γ(z)| .
- Preferential Attachment: score(x, y) = |Γ(x)| · |Γ(y)|.
We compute Precision, Recall and F1-measure for each algorithm, and compare the performance of ML-FGM with the baseline methods. For the first kind of baseline algorithms and our algorithms, this is a straightforward task. However, there is a little trouble with link predictor, as they only rank the potential links, and are usually evaluated by Precision@top K. To make a relatively fair comparison, we set K to be the number of positive cases that our algorithm infers. To achieve better generality, all the features and factors fed into ML-FGM and baseline models only involve topological structure information of the network but not other information such as demographics in case there is no such information in some networks. From the results demonstrated in Table 1, we can see ML-FGM has a significant advantage in terms of all the metrics, through catching all the factor from fellow invitees and group information in addition to individual features.
Discussion
The link predictors and the classifiers can only handle the fringe users' features to predict invitees, failing to well capture the other factors which can reflect the natural reason that a fringe user can be invited to the group. The link predictors only measure the proximity between a group and a fringe user by the number of the fringe user's friends already in the group, which is actually a feature of the fringe user. Our approach successfully captures all the factors that we can exploit and combined them into a carefully designed framework, achieving better performance.
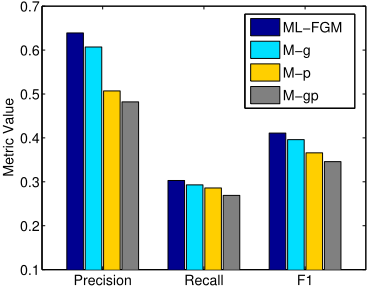
To analyze the contribution of each factor, we remove group factor and peer factor in ML-FGM, and evaluate the decrease in the prediction performance, as shown in Fig.6. M-g, M-p, M-gp stand for the removing of group factor, peer factor and both respectively.
6 RelatedWork
There are two lines of research related to this work: group evolution and social instant messaging networks.
Group Evolution. [Sun et al., 2007] applied the Minimum Description Length principle to find the best partitions in a time sequence of graphs. [Han and Tang, 2015] presented a unified probabilistic framework called Community Role Model (CRM) to model the social network. [Asur et al., 2009] studied the dynamic relationship between nodes and communities. They defined four measures to catch the behavioral tendencies of nodes contributing to the evolution of the graph. [Kim and Leskovec, 2013] proposed a nonparametric multi-group membership model for dynamic networks wherein the present groups can vanish and new groups can emerge as the network evolves. [Yang et al., 2010] conducted a longitudinal comparison of the communities evolvement between two distinct stages.
Social Instant Messaging. [Leskovec and Horvitz, 2008] studied the data capturing a month of high-level communication activities within the whole of the Microsoft Messenger. [Glass and Li, 2010] investigated the influence of technology acceptance model, social influence [Tang et al., 2009] and demographics on instant messaging adoption in the workplace. [Church and de Oliveira, 2013] provided a deeper understanding of the motives and perceptions of WhatsApp and learn more about what it offers above and beyond traditional SMS. [O'Hara et al., 2014] studied the sociality in WhatsApp.
7 Conclusion
We study the problem of predicting invitees of social groups by investigating a real-world social messaging network. We propose a probabilistic graphical model integrating various factors which can affect and have correlation with the fringe users' probabilities of being invited to join the groups from three levels, including group level, peer level and individual level, to predict invitees of social groups. The experimental results on the real world data set demonstrate the advantages of the proposed model.
Acknowledgments
The other authors include Hao Ye and Bo Chen from Tencent Inc. Jie Tang is the corresponding author of this manuscript. The work is supported by the 863 Project (2015AA124102), NSFC (61631013,61561130160), and the Royal SocietyNewton Advanced Fellowship Award.
@inproceedings{ijcai2017p519,
  title     = {Who to Invite Next? Predicting Invitees of Social Groups},
  author    = {Han, Yu and Tang, Jie},
  booktitle = {Proceedings of the Twenty-Sixth International Joint Conference on
               Artificial Intelligence, {IJCAI-17}},
  publisher = {International Joint Conferences on Artificial Intelligence Organization},
  editor    = {Carles Sierra},
  pages     = {3714--3720},
  year      = {2017},
  month     = {8},
  note      = {Main track},
  doi       = {10.24963/ijcai.2017/519},
  url       = {https://doi.org/10.24963/ijcai.2017/519},
}
TY - CPAPER TI - Who to Invite Next? Predicting Invitees of Social Groups AU - Han, Yu AU - Tang, Jie T2 - Proceedings of the Twenty-Sixth International Joint Conference on Artificial Intelligence, IJCAI-17 PB - International Joint Conferences on Artificial Intelligence Organization PY - 2017 SP - 3714 EP - 3720 DO - 10.24963/ijcai.2017/519 UR - https://doi.org/10.24963/ijcai.2017/519 ER -Copied
Machine-readable versions of this paper, for tools and AI agents:





