
Radar: Residual Analysis for Anomaly Detection in Attributed Networks
Proceedings of the Twenty-Sixth International Joint Conference on Artificial Intelligence. Main track. Pages 2152-2158.
https://doi.org/10.24963/ijcai.2017/299
Keywords
- Machine Learning: Unsupervised Learning
- Machine Learning: Data Mining
- Machine Learning: Relational Learning
Abstract
Attributed networks are pervasive in different domains, ranging from social networks, gene regulatory networks to financial transaction networks. This kind of rich network representation presents challenges for anomaly detection due to the heterogeneity of two data representations. A vast majority of existing algorithms assume certain properties of anomalies are given a prior. Since various types of anomalies in real-world attributed networks co-exist, the assumption that priori knowledge regarding anomalies is available does not hold. In this paper, we investigate the problem of anomaly detection in attributed networks generally from a residual analysis perspective, which has been shown to be effective in traditional anomaly detection problems. However, it is a non-trivial task in attributed networks as interactions among instances complicate the residual modeling process. Methodologically, we propose a learning framework to characterize the residuals of attribute information and its coherence with network information for anomaly detection. By learning and analyzing the residuals, we detect anomalies whose behaviors are singularly different from the majority. Experiments on real datasets show the effectiveness and generality of the proposed framework.
- [Aggarwal and Yu, 2001] Charu C Aggarwal and Philip S Yu. Outlier detection for high dimensional data. 2001.
- [Aggarwal, 2015] Charu C Aggarwal. Outlier analysis. In Data Mining, 2015.
- [Akoglu et al., 2014] Leman Akoglu, Hanghang Tong, and Danai Koutra. Graph based anomaly detection and de- scription: A survey. DMKD, 2014.
- [Breunig et al., 2000] Markus M Breunig, Hans-Peter Kriegel, Raymond T Ng, and Jörg Sander. Lof: identify- ing density-based local outliers. In ACM Sigmod Record, 2000.
- [Chandola et al., 2009] Varun Chandola, Arindam Banerjee, and Vipin Kumar. Anomaly detection: A survey. ACM CSUR, 2009.
- [Chen et al., 2015] Chen Chen, Jingrui He, Nadya Bliss, and Hanghang Tong. On the connectivity of multi-layered net- works: Models, measures and optimal control. In ICDM, 2015.
- [Gao et al., 2010] Jing Gao, Feng Liang, Wei Fan, Chi Wang, Yizhou Sun, and Jiawei Han. On community out- liers and their efficient detection in information networks. In KDD, 2010.
- [He et al., 2017] Yuan He, Cheng Wang, and Changjun Jiang. Modeling document networks with tree-averaged copula regularization. In WSDM, 2017.
- [Huang et al., 2017a] Xiao Huang, Jundong Li, and Xia Hu. Accelerated attributed network embedding. In SDM, 2017.
- [Huang et al., 2017b] Xiao Huang, Jundong Li, and Xia Hu. Label informed attributed network embedding. In WSDM, 2017.
- [Jian et al., 2016] Ling Jian, Jundong Li, Kai Shu, and Huan Liu. Multi-label informed feature selection. In IJCAI, 2016. IJCAI
- [Lazarevic and Kumar, 2005] Aleksandar Lazarevic and Vipin Kumar. Feature bagging for outlier detection. In KDD, 2005.
- [Li et al., 2016a] Jundong Li, Xia Hu, Ling Jian, and Huan Liu. Toward time-evolving feature selection on dynamic networks. In ICDM, 2016.
- [Li et al., 2016b] Jundong Li, Xia Hu, Liang Wu, and Huan Liu. Robust unsupervised feature selection on networked data. In SDM, 2016.
- [Li et al., 2017] Jundong Li, Liang Wu, Osmar R Zaïane, and Huan Liu. Toward personalized relational learning. In SDM, 2017.
- [Liu et al., 2017] Ninghao Liu, Xiao Huang, and Xia Hu. Accelerated local anomaly detection via resolving at- tributed networks. In IJCAI, 2017. IJCAI
- [McPherson et al., 2001] Miller McPherson, Lynn Smith- Lovin, and James M Cook. Birds of a feather: Homophily in social networks. ARS, 2001.
- [Muller et al., 2013] Emmanuel Muller, Patricia Iglesias Sánchez, Yvonne Mulle, and Klemens Bohm. Ranking outlier nodes in subspaces of attributed graphs. In ICDM Workshop, 2013.
- [Nie et al., 2010] Feiping Nie, Heng Huang, Xiao Cai, and Chris H Ding. Efficient and robust feature selection via joint l2, 1-norms minimization. In NIPS, 2010.
- [Noble and Cook, 2003] Caleb C Noble and Diane J Cook. Graph-based anomaly detection. In KDD, 2003.
- [Bryan Perozzi and Leman Akoglu. Scalable anomaly ranking of attributed neighbor- hoods. In SDM, 2016. Perozzi et al., 2014] Bryan Perozzi, Leman Akoglu, Patri- cia Iglesias Sánchez, and Emmanuel Müller. Focused clus- tering and outlier detection in large attributed graphs. In KDD, 2014.
- [Sahoo et al., 2017] Doyen Sahoo, Chenghao Liu, and Steven CH Hoi. Malicious url detection using machine learning: A survey. arXiv preprint arXiv:1701.07179, 2017.
- [Sánchez et al., 2013] Patricia Iglesias Sánchez, Emmanuel Muller, Fabian Laforet, Fabian Keller, and Klemens Bohm. Statistical selection of congruent subspaces for mining attributed graphs. In ICDM, 2013.
- [Sánchez et al., 2014] Patricia Iglesias Sánchez, Emmanuel Müller, Oretta Irmler, and Klemens Böhm. Local context selection for outlier ranking in graphs with multiple nu- meric node attributes. In SSDBM, 2014.
- [She and Owen, 2011] Yiyuan She and Art B Owen. Out- lier detection using nonconvex penalized regression. JASA, 2011.
- [Tang and Liu, 2013] Jiliang Tang and Huan Liu. Coselect: Feature selection with instance selection for social media data. In SDM, 2013.
- [Tong and Lin, 2011] Hanghang Tong and Ching-Yung Lin. Non-negative residual matrix factorization with applica- tion to graph anomaly detection. In SDM, 2011.
- [Wang et al., 2017] Xin Wang, Steven CH Hoi, Martin Ester, Jiajun Bu, and Chun Chen. Learning personalized prefer- ence of strong and weak ties for social recommendation. In WWW, 2017.
- [Wu et al., 2017] Liang Wu, Jundong Li, Xia Hu, and Huan Liu. Gleaning wisdom from the past: Early detection of emerging rumors in social media. In SDM, 2017.
- [Xu et al., 2007] Xiaowei Xu, Nurcan Yuruk, Zhidan Feng, and Thomas AJ Schweiger. Scan: a structural clustering algorithm for networks. In KDD, 2007.
- [Yu et al., 2006] Kai Yu, Jinbo Bi, and Volker Tresp. Active learning via transductive experimental design. In ICML, 2006.
- [Zhou et al., 2015] Dawei Zhou, Jingrui He, K Seluk Can- dan, and Hasan Davulcu. Muvir: Multi-view rare category detection. In IJCAI, 2015. IJCAI
References were extracted automatically from the PDF and may contain errors.
Full text extracted automatically from the PDF; figures, tables and equations may differ. The PDF is the version of record.
1 Introduction
Networks are widely used to represent various types of information systems where nodes represent entities such as users, web pages, genes and edges represent interactions between entities such as friendships, hyperlinks, gene interactions [Chen et al., 2015; He et al., 2017; Wang et al., 2017; Li et al., 2017]. In many network representations, each node is also associated with a rich set of attributes or features. For example, in social networks, users have a set of user interests; in paper citation networks, papers are on different topics. These types of networks are called attributed networks [Huang et al., 2017a; 2017b].
Anomaly detection (a.k.a. outlier detection) [Chandola et al., 2009; Aggarwal, 2015] aims to discover rare instances that do not conform to the patterns of majority. Recently, there is a growing interest to perform anomaly detection in attributed networks [Gao et al., 2010; S´anchez et al., 2014; Perozzi et al., 2014; Perozzi and Akoglu, 2016; Liu et al., 2017]. A straightforward way is to assume that some properties of anomalies are known in advance. For example, a vast majority of methods rely on some pre-defined measures to identify anomalies in a specific context, such as structural anomaly, contextual anomaly and community anomaly. Figure 1 shows a toy example of these three types of anomalies using different contexts. When only considering the network information, node 12 is considered as a structural anomaly as it does not belong to any communities. On the other hand, if only attribute information is available, node 7 is taken as a contextual anomaly since its second attribute (f2) value, deviates significantly from the other nodes. Considering both network and attribute information, node 2 is anomalous. Although its attribute values on f1, f2 and f3 are normal over the entire dataset, its attribute value on f1 is relatively higher than the other nodes in the same community (node 1, 3, 4 and 5), therefore, it is referred as a community anomaly.
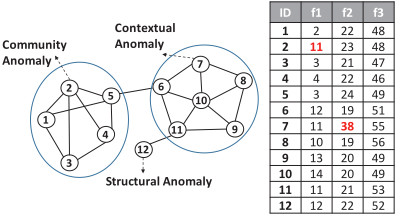
In many cases, the widely used assumption that some properties of anomalies are known in advance might not be true. In real-world attributed networks, different types of anomalies are often mixed together, it is hard to identify all of them when we have no prior knowledge of data. Besides, people can always develop a new type of anomaly as long as some natures of data are exploited. Therefore, it is beneficial and desirable to explore and spot anomalies in a general sense.
Residual analysis [She and Owen, 2011], which is initiated to study the residuals between true data and estimated data for regression problems, is able to help us understand anomalies generally. Instances with large residual errors are more likely to be anomalies, since their behaviors do not conform to the patterns of majority reference instances. Although it provides a general way to find anomalies, it is a non-trivial task in attributed networks: (1) we have heterogeneous data sources in attributed networks, it is insufficient to consider residuals from a only single data source; (2) instances in attributed networks are not independent and identically distributed (i.i.d.), the interactions among them further complicate the residual modeling process.
Therefore, in this paper, we provide a principled way to identify and detect anomalies via residual analysis. In particular, we investigate: (1) how to characterize the residuals of attribute information to spot anomalies when there is no prior knowledge of anomalies; and (2) how to exploit coherence between attribute residuals and network information to identify anomalies in a general way. The main contributions of this work are as follows:
- Providing a principled learning framework to model the residuals of attribute information and its coherence with network information for anomaly detection;
- Proposing a novel anomaly detection framework radar for attributed networks by analyzing the residuals (residual analysis for anomaly detection in attributed networks);
- Evaluating the effectiveness of the proposed radar framework on real-world datasets.
2 Anomaly Detection in Attributed Networks
In this section, we first give some notations and formally define the problem of anomaly detection in attributed networks. Then we introduce how to model attribute information and network information to detect anomalies generally from a residual analysis perspective.
2.1 Problem Statement
We first summarize some notations used in this paper. Following the standard notation, we use bold uppercase characters for matrices (e.g., A), bold lowercase characters for vectors (e.g., b), normal lowercase characters for scalars (e.g., c), calligraphic fonts for sets (e.g., F). Also, we follow the convention of Matlab to represent i-th row of matrix A as A(i, :), j-th column as A(:, j), (i, j)-th entry as A(i, j), transpose of A as A′ , trace of A as tr(A) if it is a square matrix. The ℓ2-norm of a vector a ∈ Rn is ||a||2 = √a′a. The ℓ2,1-norm a matrix A ∈ Rn×d is ||A||2,1 = ∑ni=1 √∑dj=1 A(i, j)2 , its ℓ2,0-norm is the number of nonzero rows in A, and the Frobenius norm is defined as ||A||F = √∑ni=1 ∑dj=1 A(i, j)2 .
Let U = {u1, u2, ..., un} denote a set of n instances, these n instances are interconnected with each other to form a network, we use the adjacency matrix A ∈ Rn×n to represent their link relationships. Each instance is associated with a set of d-dimensional attributes (features) F = {f1, f2, ..., fd}, and we use X ∈ Rn×d to denote the attribute information of all n instances.
With these notations, the task of anomaly detection in attributed networks can be summarized as follows: given the attribute information X and network information A of all n instances, find a set of instances that are rare and differ singularly from the majority reference instances.
2.2 Modeling Attribute Information
We start from the situation when only attribute information are available. Let ˜X denotes the estimated attribute information, then the approximation error X- ˜X, i.e, residuals, can be exploited to determine contextual anomaly as content patterns of anomalies deviate significantly from majority normal instances [Tong and Lin, 2011]. One natural way to build ˜X is by using some representative instances [Yu et al., 2006]. For a certain instance, if its attribute information can be approximated by some representative instances, it is of low probability to be anomalous. On the opposite side, if the instance cannot be well represented by some representative instances, its attribute information do not conform to the patterns of majority reference instances. In other words, we would like to use the attribute information of some representative instances to reconstruct X. Mathematically, it is formulated as:
where W ∈ Rn×n is a coefficient matrix such that the attribute information of each instance (a row of X) can be reconstructed by a linear combination of other instances; the row sparsity constraint ||W||2,0 ensures that only the attribute information of a few representative instances are employed to reconstruct X, α is a parameter to control the row sparsity. However, the problem in Eq. (1) is NP-hard due to the ℓ2,0norm term. ||W||2,1 is the minimum convex hull of ||W||2,0 and we can minimize ||W||2,1 to obtain the same results as ||W||2,0, and it is also widely used in other learning tasks such as feature selection [Jian et al., 2016]. In this way, we reformulate Eq. (1) as:
Let Θ = X -W′X - R be a random error matrix. Θ is usually assumed to follow a multi-dimensional normal distribution. R is the residual matrix from the reconstruction process in Eq. (2). The residual matrix R can be used to determine anomalies since the attribute patterns of anomalous instances and normal instances are quite different, a large norm of R(i, :) indicates the instance has a higher probability to be an anomaly [Tang and Liu, 2013]. In addition, in many applications like rumor detection [Wu et al., 2017], malicious URL detection [Sahoo et al., 2017] and rare category detection [Zhou et al., 2015], the number of anomalies is much smaller than the number of normal instances, therefore we add a ||R||2,1 regularization term on the basis of Eq. (2) to achieve row sparsity to constrain the number of abnormal instances. The objective function can be reformulated as:
where β controls the row sparsity of residual matrix R.
2.3 Modeling Network Information
We model the residuals of attribute information to spot anomalies in Eq. (3). However, in attributed networks, some types of anomalies are not solely described at a contextual level. Therefore, we need to exploit the correlation between attribute and network information to detect anomalies in a more general way. According to well-received social science theories such as Homophily [McPherson et al., 2001], instances with similar patterns are more likely to be linked together in attributed networks. Similarly, when we reconstruct X by the attribute information of some representative instances, the homophily effect should also hold. It indicates that if two instances are linked together in the network, after attribute reconstruction by representative (normal) instances, their attribute patterns in the residual matrix R should also be similar. If the attributed network is an undirected network, it can be mathematically formulated by minimizing the following term:
where D is a diagonal matrix with D(i, i) = ∑nj=1 A(i, j), L is a Laplacian matrix. If the attributed network is a directed network, the graph regularization term in Eq. (4) cannot be used directly since the adjacency matrix A is not symmetric. To model the network information on directed networks, we follow [Li et al., 2016b] to use A = max(A,A′ ). Then the Laplacian matrix is in the same form as the undirected networks.
2.4 Anomaly Detection Framework: Radar
The objective function in Eq. (3) is based on a strong assumption that instances are independent and identically distributed (i.i.d.). However, it is not the case in networks such that instances are interconnected with each other, the interactions among instances also complicate the residual modeling process. Therefore, we propose to integrate the network modeling term in Eq. (4) on the basis of Eq. (3) to capture the coherence between attribute residual information and network information, the objective function of the radar framework can be formulated as follows:
where γ is a parameter to balance the contribution of attribute reconstruction and network modeling.
It can be observed that without any prior knowledge about anomalies, we build a general learning framework (Eq. (5)) to detect anomalous instances generally by exploiting both attribute and network information as well as their correlations. By learning and analyzing the residual matrix R, it enables the ranking of anomalies according to their residual values. Different from making a binary decision of anomalies, anomaly ranking is easier to be interpreted. It makes further exploration possible as decision markers can check the degrees of deviation manually.
3 Optimization Algorithm
In this section, we first introduce the optimization algorithm for the radar framework. Then we will give a convergence analysis and a time complexity analysis of the proposed optimization process.
The objective function in Eq. (5) is not convex in terms of bothWand R simultaneously. Besides, it is also not smooth due the existence of ℓ2,1-norm regularization term. We use an alternating way to optimize this problem.
Update R
WhenW is fixed, Eq. (5) is convex w.r.t. R. Therefore, we first fix W to update R, and we remove the terms that are irrelevant to R, then the objective function in Eq. (5) can be reformulated as:
We take the derivative of J (R) w.r.t. R and set it to zero, then we have:
where DR is a diagonal matrix with the i-th diagonal element as DR(i, i) = 1 2||R(i,:)||2 1 . The Laplacian matrix L is a positive semidefinite matrix; I and βDR are two diagonal matrices with positive diagonal entries, they are both positive semidefinite. Therefore, the summation of three positive semidefinite matrices I+βDR+γL is also a positive semidefinite matrix. Hence, R has a closed form solution:
Update W
When R is fixed, Eq. (5) is convex w.r.t. W. Next, we fix R to updateW. We remove the terms that are irrelevant toW, the objective function in Eq. (5) is formulated as:
Similarly, we set the derivative of J (W) w.r.t. W to zero
where DW is a diagonal matrix with the i-th diagonal element as DW(i, i) = 1 2||W(i,:)||2 . XX′ is a positive semidefinite matrix, αDW is a diagonal matrix with positive entries, it is also positive semidefinite. Their summation XX′ + αDW is also positive semidefinite. W has a closed form solution, which is:
Based on Eq. (8) and Eq. (11), the detailed radar framework that detects anomalies in attributed networks via residual analysis is presented in Algorithm 1. We first initialize DR, DW to be identity matrix and initialize R to be
1 In practice, ||R(i, :)||2 and ||W(i, :)||2 could be very close to zero but not zero. However, it could be zero theoretically. Therefore, we defineDR(i, i) = 1 2||R(i,:)||2+ϵ andDW(i, i) = 1 2||W(i,:)||2+ϵ , respectively, where ϵ is a very small constant.
(I + βDR + γL)-1X (line 2-3). Then we fix R to update W (line 5) and fix W to update R (line 7) iteratively until the objective function in Eq. (5) converges. After the iteration terminates, we compute the anomaly score for each instance according to its norm in the residual matrix R, i.e., ||R(i, :)||2 (line 10). Instances with large anomaly scores are more likely to be abnormal. We then sort these instances by their anomaly scores in a descending order and return the top m ranked instances which are considered to be the most abnormal instances (line 11).
Algorithm 1 Anomaly detection in attributed networks via residual analysis (radar)
Input: Attribute matrix X, adjacency matrix A, parameters α, β, γ.
Output: Top m instances with the highest anomaly scores.
- 1: Build Laplacian matrix L from the adjacency matrix A;
- 2: Initialize DR and DW to be identity matrix;
- 3: Initialize R= (I +βDR +γL)-1X;
- 4: while objective function in Eq. (5) not converge do
- 5: UpdateWby Eq. (11);
- 6: Update DW by setting DW(i, i) = 1 2||W(i,:)||2 ;
- 7: Update R by Eq. (8);
- 8: Update DR by setting DR(i, i) = 1 2||R(i,:)||2 ;
- 9: end while
- 10: Calculate the anomaly score for the i-th instance as ||R(i, :)||2;
- 11: Return top m instances with the highest anomaly score.
3.1 Convergence Analysis
We show the alternating way to update R and W in Algorithm 1 decreases the objective function value in Eq. (5) each iteration monotonically and the objective function value is guaranteed to converge. In practice, our experimental results show that the iteration process usually converges within 50 iterations for all datasets used in this paper.
Lemma 1. The following inequality holds if Wt(i, :) and Wt+1(i, :) are non-zero vectors [Nie et al., 2010]:
whereWt denotes the update ofWat the t-th iteration.
Theorem 1. The alternating procedure to update W and R iteratively will monotonically decrease the objective function value of Eq. (5) at each iteration.
Proof. When Rt is fixed, we update Wt+1 according to Eq. (11), Wt+1 is the solution of the following objective function:
Therefore, the following inequality holds:
It is also equivalent to:
Integrating the inequality condition in Lemma 1, we have:
Similarly, we can prove that J(Wt+1,Rt+1) ≤ J(Wt+1,Rt). Therefore, we have J(Wt+1,Rt+1) ≤ J(Wt+1,Rt) ≤ J (Wt,Rt), it indicates the alternating update rule in Algorithm 1 decreases the objective function at each iteration and it finally converges.
3.2 Time Complexity Analysis
At each iteration, we update R and W iteratively, the most cost operation are the matrix inverse operations (I + βDR + γL)-1 and (XX′ + αDW)-1 which both require O(n3 ). However, we can speed up the update of R by solving the following linear equation system: (I+βDR+γL)R=XW′X, which only needs O(n2d) (d is usually smaller than n). Therefore, the total time complexity is #iterations ∗ (O(n2d) + O(n3 )).
4 Experiments
In this section, we conduct experiments to evaluate the effectiveness of the proposed framework radar. In particular, we investigate the following two questions: (1) How is the anomaly detection performance of the proposed radar framework when measured against other representative anomaly detection methods? (2) Does the utilization of coherence between attribute residuals and network information help find anomalous instances otherwise remain undiscovered? Before discussing about details of the experiments, we first introduce the datasets and the experimental settings.
4.1 Datasets
We use three real-world attributed network datasets for the evaluation of the proposed anomaly detection method. Among them, Disney dataset and Books dataset 2 come from Amazon co-purchase networks. Disney is a co-purchase network of movies, the attributes include prices, ratings, number of reviews, etc. The ground truth (anomalies) are manually labeled by high school students. The second dataset, Books, is a co-purchase network of books, it has similar attributes as Disney dataset. The ground truth (anomalies) are obtained by amazonfail tag information. Enron 3 is an email network dataset, spammessages are taken as ground truth. The statistics of these datasets are listed in Table 1.
2 http://www.ipd.kit.edu/˜muellere/consub/
| Disney | Books | Enron | |
|---|---|---|---|
| # of Nodes | 124 | 1,418 | 13,533 |
| # of Edges | 334 | 3,695 | 176,987 |
| # of Attributes | 28 | 28 | 20 |
| ratio of anomalies | 0.048 | 0.020 | 0.004 |
4.2 Experimental Settings
The criteria of AUC (Area Under ROC Curve) is applied to evaluate the performance of anomaly detection algorithms. According to the ground truth and the results by anomaly detection algorithms, there are four possible outcomes: anomaly is recognized as anomaly (TP), anomaly is recognized as normal (FN), normal is recognized as anomaly (FP), and normal is recognized as normal (TN). Therefore, the detection rate (dr) and false alarm rate (flr) are defined as: dr = TP TP+FN , flr = FP FP+TN . Then the ROC curve is a plot of detection rate (dr) vs. false alarm rate (flr). From the statistical perspective, AUC value represents the probability that a randomly chosen abnormal instance is ranked higher than a normal instance. If the AUC value approaches 1, the method is of high quality.
We compare the proposed radar framework with four baseline methods which perform anomaly detection when some characteristics of anomalies are known in advance.
- LOF [Breunig et al., 2000]: LOF detects anomalies in a contextual level and only uses attribute information.
- SCAN [Xu et al., 2007]: SCAN detects anomalies in a structural level and only considers network information.
- CODA [Gao et al., 2010]: CODA detects anomalies within the context of communities where these instances deviate significantly from other community members.
- ConSub+CODA [S´anchez et al., 2013]: It performs subspace selection as a pre-processing step and then applies CODA to detect subspace community anomalies.
Among them, LOF, SCAN, CODA covers three types of widely defined anomalies in attributed networks (contextual anomaly, structural anomaly and community anomaly). Consub+CODA is able to find subspace community anomalies by taking subspace selection as a pre-processing step. The parameter settings of these baseline methods follow the settings of [S´anchez et al., 2013]. The proposed radar framework has three different regularization parameters, for a fair comparison, we tune these parameters by a "grid-search" strategy from {10-3 , 10-2 , ..., 102 , 103 }. Details about the effects of these parameters will be investigated later.
4.3 Performance Comparison
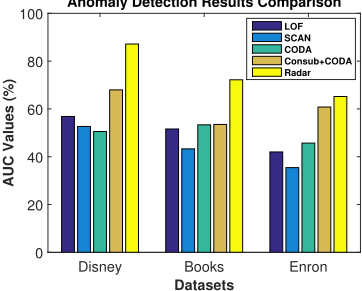
The experimental results in terms of AUC values are presented in Figure 2. By comparing the performance of different methods, we can observe that the proposed radar framework always obtains the best anomaly detection performance. The reason is that in real-world attributed networks, nodes are annotated as anomalies due to a variety of reasons. Our radar algorithm provides a general way to detect anomalies globally and does not depend on specific properties of anomalies. We also perform one tailed t-test between radar and other baseline methods and the test results show that radar is significantly better (with a 0.05 significance level).
Therefore, we can get an answer for the first question that the proposed radar framework outperforms other representative anomaly detection algorithms for attributed networks.
4.4 Coherence Between Attribute Residuals and Network Information
In this subsection, we study the second question to investigate how the coherence between attribute residuals and network information affects anomaly detection results. We compare radar with the following methods by varying γ:
- Residual-based method: We set the parameter γ to be zero, therefore, only residuals of attribute information is taken into consideration. The detected anomalies can be considered as contextual anomalies.
- Network-based method: We set the parameter γ to be a large number, therefore, the contribution from attribute residuals can be ignored. The detected anomalies can be considered as structural anomalies.
First, we compare the anomaly detection results by the proposed radar, the residual-based method and the networkbased method on Disney dataset, the AUC values are 87.1%, 77.68%, 74.29%, respectively. It indicates that by exploiting the correlation between attribute residuals and network information, the anomaly detection performance indeed improves. We only present the comparison results on Disney dataset as we have the similar observations on the other two datasets. Second, we compare the overlap of detected
3 https://www.cs.cmu.edu/˜./enron/
Overlap between Detected Anomalies
Number of Anomalies
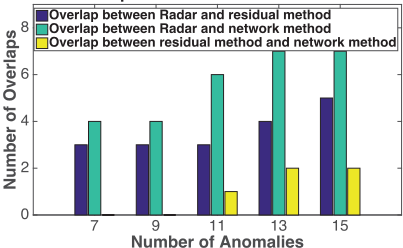
anomalies by each pair of method (radar and residual-based method, radar and network-based method, residual-based method and network-based method) in Figure 3. As can be observed, when we vary the number of detected anomalies, the overlap of anomalies between radar and residualbased method, radar and network-based method are always larger than the overlap between residual-based method and network-based method. This phenomenon shows that by exploiting the correlation between attribute residuals and network structure, we can find anomalies otherwise undiscovered by a single source of information. It also shows the potential to detect anomalies generally via residual analysis.
4.5 Effects of Parameters
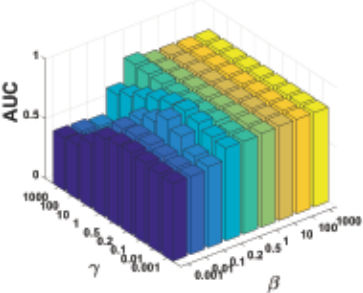
There are three parameters in the proposed framework. Among them, β and γ are relatively more important. The parameter β controls the number of anomalies, while γ balances the contribution of attribute information and network information for anomaly detection. Due to space limit, we only investigate how these two parameters affect the anomaly detection results on Disney dataset. The performance variance result is shown in Figure 4 (α is fixed to be 0.5). We observe that when β is small, the AUC values are relatively low, the anomaly detection performance is not sensitive to the parameters when β and γ are in the range of 0.1 to 1000, and 0.001 to 10, respectively. The anomaly detection performance is the best when both β and γ are around 0.2.
5 RelatedWork
Anomaly detection methods in attributed networks can be grouped into: 1) Structure-based methods 2) Communitybased methods [Akoglu et al., 2014]. Structure-based methods aim to find substructures or subgraphs that are rare or infrequent and classify them as anomalies [Noble and Cook, 2003]. Whereas, community-based methods aim to find the group of nodes which deviate significantly from other nodes in the graph. Therefore, community-based methods are more related to our work. To detect anomalous instances, LOF uses density functions to obtain "outlierness" score of each instance [Breunig et al., 2000]. SOF and RPLOF both use the subset of attributes associated with instances to detect anomalies [Aggarwal and Yu, 2001; Lazarevic and Kumar, 2005]. However, these methods are designed for flat attribute data while link information among instances are ignored. SCAN is one of the first methods that target to find structural anomalies in networks [Xu et al., 2007]. CODA adopts a generative model to simultaneously find community and anomalies using Markov random fields [Gao et al., 2010]. Recently, researchers proposed to integrate subspace selection and community anomaly detection together which proves to achieve good anomaly detection performance [S´anchez et al., 2013; Muller et al., 2013; S´anchez et al., 2014]. A focused clustering and outlier detection algorithm which allows users to steer graph clustering and anomaly detection results according to their preferences is also proposed [Perozzi et al., 2014]. A widely used assumption of above methods is that some properties of anomalies are known in advance. Afterwards, they rely on some pre-defined ad-hoc measures to find these anomalies. However, in real-world networks, properties of anomalies are usually not known in advance. Our method leverages residual analysis to detect anomalies in a general sense without prior knowledge of anomalies.
6 Conclusions and FutureWork
In this paper, we propose a novel anomaly detection framework radar for attributed networks. Methodologically, we propose a learning framework to characterize attribute reconstruction residuals and its correlation with network information to detect anomalies. Through learning and probing the residuals of the reconstruction process, we are able to spot anomalies in a global view when properties of anomalies are unknown. Experiments on real-world datasets show that our framework yields better AUC values compared to baseline methods which define anomalies in a specific context. Besides, the coherence between attribute residuals and network structure can help uncover anomalies otherwise undiscovered by a single source of information. Future work can be focused on extending the radar framework to perform anomaly detection for dynamic attributed networks [Li et al., 2016a].
Acknowledgements
This material is, in part, supported by National Science Foundation (NSF) under grant number 1614576.
@inproceedings{ijcai2017p299,
  title     = {Radar: Residual Analysis for Anomaly Detection in Attributed Networks},
  author    = {Li, Jundong and Dani, Harsh and Hu, Xia and Liu, Huan},
  booktitle = {Proceedings of the Twenty-Sixth International Joint Conference on
               Artificial Intelligence, {IJCAI-17}},
  publisher = {International Joint Conferences on Artificial Intelligence Organization},
  editor    = {Carles Sierra},
  pages     = {2152--2158},
  year      = {2017},
  month     = {8},
  note      = {Main track},
  doi       = {10.24963/ijcai.2017/299},
  url       = {https://doi.org/10.24963/ijcai.2017/299},
}
TY - CPAPER TI - Radar: Residual Analysis for Anomaly Detection in Attributed Networks AU - Li, Jundong AU - Dani, Harsh AU - Hu, Xia AU - Liu, Huan T2 - Proceedings of the Twenty-Sixth International Joint Conference on Artificial Intelligence, IJCAI-17 PB - International Joint Conferences on Artificial Intelligence Organization PY - 2017 SP - 2152 EP - 2158 DO - 10.24963/ijcai.2017/299 UR - https://doi.org/10.24963/ijcai.2017/299 ER -Copied
Machine-readable versions of this paper, for tools and AI agents:





