
Action Selection for Hammer Shots in Curling
Proceedings of the Twenty-Fifth International Joint Conference on Artificial Intelligence. Pages 561-566.
© 2016 International Joint Conferences on Artificial Intelligence
Abstract
Curling is an adversarial two-player game with a continuous state and action space, and stochastic transitions. This paper focuses on one aspect of the full game, namely, finding the optimal hammer shot, which is the last action taken before a score is tallied. We survey existing methods for finding an optimal action in a continuous, low-dimensional space with stochastic outcomes, and adapt a method based on Delaunay Triangulation to our application. Experiments using our curling physics simulator show that the adapted Delaunay Triangulation's shot selection outperforms other algorithms, and with some caveats, exceeds Olympic-level human performance.
- [Archibald et al., 2009] Christopher Archibald, Alon Alt- man, and Yoav Shoham. Analysis of a winning compu- tational billiards player. In IJCAI, volume 9, pages 1377- 1382. Citeseer, 2009. IJCAI
- [Auer et al., 2002] Peter Auer, Nicolo Cesa-Bianchi, and Paul Fischer. Finite-time analysis of the multiarmed bandit problem. Machine learning, 47(2-3):235-256, 2002.
- [Auger and Hansen, 2009] Anne Auger and Nikolaus Hansen. Benchmarking the (1+1)-CMA-ES on the BBOB-2009 function testbed. In Genetic and Evo- lutionary Computation Conference, GECCO 2009, Proceedings, Montreal, Québec, Canada, July 8-12, 2009, Companion Material, pages 2459-2466, 2009.
- [Bäck et al., 1991] Thomas Bäck, Frank Hoffmeister, and Hans-Paul Schwefel. A survey of evolution strategies. In Proceedings of the 4th International Conference on Ge- netic Algorithms, San Diego, CA, USA, July 1991, pages 2-9, 1991.
- [Bubeck et al., 2009] Sébastien Bubeck, Gilles Stoltz, Csaba Szepesvári, and Rémi Munos. Online optimization in x- armed bandits. In D. Koller, D. Schuurmans, Y. Ben- gio, and L. Bottou, editors, Advances in Neural Informa- tion Processing Systems 21, pages 201-208.
- [Denny, 1998] Mark Denny. Curling rock dynamics. Cana- dian journal of physics, 76(4):295-304, 1998.
- [Eberhart and Shi, 2011] Russell C Eberhart and Yuhui Shi. Computational intelligence: concepts to implementations. Elsevier, 2011.
- [Hansen and Ostermeier, 1996] Nikolaus Hansen and An- dreas Ostermeier. Adapting arbitrary normal mutation dis- tributions in evolution strategies: The covariance matrix adaptation. In Evolutionary Computation, 1996., Proceed- ings of IEEE International Conference on, pages 312-317. IEEE, 1996.
- [Hansen, 2016] Nikolaus Hansen. The CMA evolution strat- egy: A tutorial. arXiv:1604.00772, 2016.
- [Jensen and Shegelski, 2004] ET Jensen and Mark RA Shegelski. The motion of curling rocks: experimen- tal investigation and semi-phenomenological description. Canadian journal of physics, 82(10):791-809, 2004.
- [Kleinberg, 2004] Robert D Kleinberg. Nearly tight bounds for the continuum-armed bandit problem. In Advances in Neural Information Processing Systems, pages 697-704, 2004.
- [Lee and Schachter, 1980] Der-Tsai Lee and Bruce J Schachter. Two algorithms for constructing a delaunay triangulation. International Journal of Computer & Information Sciences, 9(3):219-242, 1980.
- [Lizotte et al., 2007] Daniel J Lizotte, Tao Wang, Michael H Bowling, and Dale Schuurmans. Automatic gait optimiza- tion with gaussian process regression. In IJCAI, volume 7, pages 944-949, 2007. IJCAI
- [Lozowski et al., 2015] Edward P Lozowski, Krzysztof Szilder, Sean Maw, Alexis Morris, Louis Poirier, Berni Kleiner, et al. Towards a first principles model of curling ice friction and curling stone dynamics. In The Twenty- fifth International Offshore and Polar Engineering Con- ference. International Society of Offshore and Polar Engi- neers, 2015.
- [Nyberg et al., 2012] Harald Nyberg, Sture Hogmark, and Staffan Jacobson. Calculated trajectories of curling stones sliding under asymmetrical friction. In Nordtrib 2012, 15th Nordic Symposium on Tribology, 12-15 June 2012, Trondheim, Norway, 2012.
- [Nyberg et al., 2013] Harald Nyberg, Sara Alfredson, Sture Hogmark, and Staffan Jacobson. The asymmetrical fric- tion mechanism that puts the curl in the curling stone. Wear, 301(1):583-589, 2013.
- [Rasmussen, 2006] Carl Edward Rasmussen. Gaussian pro- cesses for machine learning. 2006.
- [Shi and Eberhart, 1998] Yuhui Shi and Russell Eberhart. A modified particle swarm optimizer. In Evolutionary Com- putation Proceedings, 1998. IEEE World Congress on Computational Intelligence., The 1998 IEEE International Conference on, pages 69-73. IEEE, 1998.
- [Smith, 2006] Michael Smith. Running the table: An ai for computer billiards. In PROCEEDINGS OF THE NATIONAL CONFERENCE ON ARTIFICIAL INTELLI- GENCE, volume 21, page 994. Menlo Park, CA; Cam- bridge, MA; London; AAAI Press; MIT Press; 1999, 2006.
- [Smith, 2007] Michael Smith. Pickpocket: A computer bil- liards shark. Artificial Intelligence, 171(16):1069-1091, 2007.
- [Snelson and Ghahramani, 2005] Edward Snelson and Zoubin Ghahramani. Sparse gaussian processes using pseudo-inputs. In Advances in neural information processing systems, pages 1257-1264, 2005.
- [Snoek et al., 2012] Jasper Snoek, Hugo Larochelle, and Ryan P Adams. Practical bayesian optimization of ma- chine learning algorithms. In Advances in neural informa- tion processing systems, pages 2951-2959, 2012.
- [Surovik and Scheeres, 2015] David Allen Surovik and Daniel J Scheeres. Heuristic search and receding-horizon planning in complex spacecraft orbit domains. In Eighth Annual Symposium on Combinatorial Search, 2015.
- [Yamamoto et al., 2015] Masahito Yamamoto, Shu Kato, and Hiroyuki Iizuka. Digital curling strategy based on game tree search. In Computational Intelligence and Games (CIG), 2015 IEEE Conference on, pages 474-480. IEEE, 2015.
- [Yee et al., 2016] Timothy Yee, Viliam Lisy, and Michael Bowling. Monte carlo tree search in continuous action spaces with execution uncertainty. In IJCAI, 2016. IJCAI
References were extracted automatically from the PDF and may contain errors.
Full text extracted automatically from the PDF; figures, tables and equations may differ. The PDF is the version of record.
1 Introduction
Curling is an Olympic sport played between two teams. The game is played in a number of rounds (usually 8 or 10) called "ends". In each end, teams alternate sliding granite rocks down a sheet of ice towards a target. When each team has thrown 8 rocks, the score for that end is determined and added to the teams' scores from the previous ends. The rocks are then removed from the playing surface and the next end begins. The teamwith the highest score after the final end is the winner.
The last shot of an end, called the "hammer shot", is of the utmost importance as it heavily influences the score for the end. In this paper, we focus exclusively on the problem of selecting the hammer shot. This focus removes the need to reason about the opponent, while still leaving the substantial challenge of efficiently identifying a near-optimal action in a continuous state and action space with stochastic action outcomes and a highly non-convex scoring function. This work is part of a larger research project that uses search methods to select all the shots in an end [Yee et al., 2016] and, ultimately, to plan an entire game.
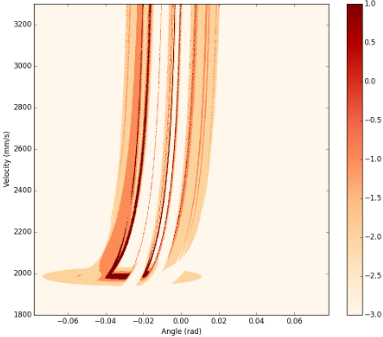
To illustrate the difficult nature of even this restricted optimization problem, Figure 1 shows a heatmap for a typical hammer shot. The shading represents the score - a darker shade is a higher score for the team throwing the hammer shot - as a function of the two main continuous action parameters, angle (✓, the x-axis) and velocity (v, the y-axis). This is a deterministic heatmap: it shows the exact score if shot (✓↪ v) is executed without error. Finding an optimal shot means finding the darkest parts of this heatmap. As can be seen they constitute a very small portion of the action space and are often surrounded by less desirable outcomes (light regions). Because action execution is stochastic, the expected value of shot (✓↪ v) is the average noise-free values of shots, (✓0 ↪ v0 ), weighted by p((✓0 ↪ v0 )♣(✓↪ v)), the probability that (✓0 ↪ v0 ) is executed given that (✓↪ v) is the intended shot. This essentially blurs the deterministic heat map, making the darkest regions even smaller (only the central region of the rectangle where ✓ ⇡ -0▷04 and v ⇡ 2000 is optimal in expected value in the situation shown in Figure 1).
This paper makes two main contributions. The first is to adapt Surovik and Scheeres [2015]'s non-convex optimization method to our problem. They use Delaunay triangulation on a set of sampled points to discretize the continuous action space and focus subsequent sampling in regions that appear promising. Our contribution is to add a final step, in which a shot is selected by treating the most promising regions as "arms" in a multi-armed bandit problem. We call our method Delaunay Sampling (DS). The second contribution is to evaluate the effectiveness, for hammer shot selection, of DS and a representative set of existing algorithms for non-convex function optimization. For this we use a curling simulator we have developed and actual hammer shot situations from the 2010 Olympic Winter Games. DS is shown to be computationally cheaper while achieving superior results to these established algorithms. We also compare DS's average expected value on the Olympic hammer shot situations with the average outcome achieved by Olympic-level curling teams themselves, showing a statistically significant improvement over these human experts, with some caveats.
2 The Hammer Shot in Curling
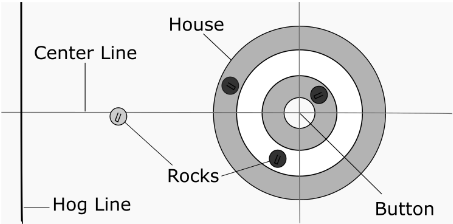
In this section we do not give a complete description of the sport of curling, we just elaborate on the aspects pertinent to understanding the final shot of the end. The state for this shot is determined by the score differential, the number of ends left to play, and the (x↪ y) positions of the rocks in play. Figure 2 is a typical state. Although 15 rocks have been thrown, only 4 remain in play (3 for the dark team, 1 for the light team).
The shot is played from the far end of the ice sheet (to the left of the figure). The rock is thrown with an initial linear and angular velocity at some angle relative to the center line. The angular velocity causes the rock to travel in an arc ("curl"), deviating from the straight line path that the rock was initially on. The direction of the curl (toward the bottom or top of the figure) is determined by the sign of the angular velocity (clockwise or counterclockwise, respectively), but is little affected by the magnitude of the angular velocity.
Two of the team's players accompany the rock as it travels down the ice, and one or both may choose to sweep the rock at any time. Sweeping affects the deceleration of the rock (it travels further if swept) and the amount it curls.
When the rock, and any rocks it hits, have come to rest, points are scored and added to the teams' running totals. The team with the rock in the scoring area (the rings in Figure 2; called the "house") that is closest to the center scores. The number of points is equal to the number of rocks in the scoring area that are closer to the center than any rock of the opposing team.
The intended outcome of a shot, though, is not always realized. There are two main reasons.
- ÷ Human error. The player throwing the stone might not perfectly deliver it at the required angle or velocity. Ad-
ditionally, the skip may incorrectly judge the rock's path or the sweepers its speed, resulting in sweeping being misapplied to achieve the desired outcome.
- ÷ Variability in the ice and rocks. Although care is taken to make the ice conditions identical along all paths, there are differences, and the ice conditions can change as a game goes on. Similarly, every rock is slightly different in how it interacts with the surface of the ice.
2.1 Modelling the Hammer Shot
We model the hammer shot using the continuous (x↪ y) coordinates for each of the previously thrown 15 rocks still in play, as well as the score differential and number of ends remaining. Our action space is based on two simplifying assumptions. First, we treat the angular velocity of the hammer shot as a binary variable (clockwise or counterclockwise). Second, we do not have any parameters related to sweeping in our action space. Instead we integrate the effects of sweeping into the execution model of our curling simulator (see next). Our action space therefore has two continuous dimensions and one binary dimension ("turn").
The result of an intended shot is determined by two main components: a physics based simulation and an execution model. Surprisingly, the physics of a curling stone is not fully understood and is an active area of research [Nyberg et al., 2013; 2012; Jensen and Shegelski, 2004; Denny, 1998; Lozowski et al., 2015]. So, a simulation based on first principles is not possible. The curling simulator used in this paper is implemented using the Chipmunk 2D rigid body physics library with an artificial lateral force that visually recreates empirically observed stone trajectories and modified collision resolution to visually match empirically observed elasticity and energy conservation when rocks collide. A rock's trajectory is modeled by a deterministic simulation given an initial linear velocity, angle, and turn.
The execution model in our curling simulator represents the variability in outcomes in the execution of an intended shot. The execution model treats this variability as a stochastic transformation. If (✓↪ v) is the intended shot, the outcome is the deterministic simulation of a perturbed shot (✓0 ↪ v0 ) sampled from a predetermined conditional probability distribution whose mode is the intended shot. The primary purpose of sweeping is to correct for human error and variability in the ice conditions. 1 This is implicitly incorporated into the execution model as a reduction in the execution noise, i.e., an increase in the likelihood the rock's actual trajectory is close to the planned trajectory. At present, we do not model ice or rock variability: we assume all shots are subject to the same execution error. The execution model used in the experiments in this paper come from perturbing the intended shot parameters with independent samples from a heavy-tailed, zero-mean, Student-t distribution whose parameters have been tuned to match Olympic-level human ability.
1 Sweeping does have effects beyond reducing execution error. Sweeping the rock near the the end of its trajectory can allow it to reach a location on the ice not possible without sweeping. Furthermore, a shot far from an intended shot can be swept to achieve an entirely different purpose, such as rolling under a different guard if the executed angle is off. The primary effect of sweeping, though, is to compensate for execution error.
3 RelatedWork
We describe the four existing approaches to non-convex optimization we explored in this work, as well as work on curling and the similar game of billiards.
3.1 Continuous Bandits
In the general bandit problem, an agent is presented with a set of arms. Each round, the agent selects an arm and receives a reward. The reward received from an arm is an i.i.d. sample from the unknown distribution associated with that arm. The objective of the agent is to select arms to maximize its cumulative reward. Upper Confidence Bounds (UCB) [Auer et al., 2002] is an arm selection policy that associate with each arm an upper bound on the estimated expected value given the entire history of interaction using the following equation:
where ¯ ri is the average reward observed by the arm i, N is the total number of samples, ni is the number of times arm i was selected, and C is a tunable constant. On each round, the agent chooses an arm i that maximizes vi. The two terms in the upper bound balance between exploiting an action with high estimated value and exploring an action with high uncertainty in its estimate.
The continuous bandit problem generalizes this framework to continuously parameterized action spaces [Bubeck et al., 2009; Kleinberg, 2004]. The agent is presented with a set of arms X, which form a topological space (or simply thought of as a compact subset of Rn where n is the size of the action parameterization). On each round, the agent selects a point x 2 X and receives a reward determined by a randomly sampled function from an unknown distribution, which is then evaluated at x. With some continuity assumptions on the mean function of the unknown distribution, one can devise algorithms that can achieve a similar exploration-exploitation tradeoff as in the finite arm setting.
One such algorithm is Hierarchical Optimistic Optimization (HOO) [Bubeck et al., 2009]. HOO creates a cover tree spanning the action space which successively divides the space into smaller sets at each depth. The nodes of the cover tree are treated as arms of a sequential bandit problem. Exploitation is done by traversing down previously-explored, promising nodes to create a finer granularity of estimates. Exploration is performed by sampling nodes higher up in the tree covering regions that have not been sampled adequately. Under certain smoothness assumptions, the average reward of HOO's sampled actions converges to the optimal action.
3.2 Gaussian Process Optimization
Gaussian Process Optimization (GPO) [Rasmussen, 2006; Snelson and Ghahramani, 2005; Snoek et al., 2012; Lizotte et al., 2007] is based on Gaussian processes, which are priors over functions, parameterized by a mean function, m(x), and a covariance kernel function, k(x↪ x0 ). Suppose there is an unknown function f and one is given N observed data points, ¶xn↪ yn♦Nn=1 , where yn ⇠ N(f(xn)↪ ⌫) with ⌫ being a noise term. The posterior distribution on the unknown function f is also a Gaussian process with a mean and covariance kernel function computable in closed form from the data. GPO seeks to find a maximum of an unknown function f through carefully choosing new points xn+1 to sample a value based on the posterior belief from previous samples. The optimal selection mechanism for a non-trivial sampling horizon and prior is intractable. However, good performance can often be had by instead choosing a point that maximizes some acquisition function as a proxy objective, e.g., choosing the point with the maximum probability of improving on the largest previously attained value.
GPO has several drawbacks. As is common with Bayesian methods, the choice of prior can have a significant impact on its performance. While a parameterized prior can be used and fit to the data, this shifts the problem to selecting hyperparameters. The second drawback is computation. Even with work on efficiently approximating the kernel matrix inverse at the heart of Gaussian processes [Snelson and Ghahramani, 2005; Snoek et al., 2012], computation to identify a new sample point is still growing with the number of previous samples, which can become intractable when allowing a large number of samples.
3.3 Particle SwarmOptimization
Particle Swarm Optimization (PSO) [Eberhart and Shi, 2011; Shi and Eberhart, 1998] is a population-based, stochastic approach to optimization. Each particle in the population keeps track of its own best score and the global best score evaluated at each time step. The particles (samples) are initially evaluated at uniform random points in the action space. At each iteration of the algorithm, the particles take a step toward the current global best. The step size depends on weight and velocity parameters, which are decided by the practitioner, and on the particle's own best score. Unlike HOO and GPO, which make a global convergence guarantee under smoothness assumptions, PSO is only expected to converge to a local optimum, and so results depend on the quality of the initial sampling of points.
3.4 Covariance Matrix Adaptation - Evolution Strategy
The final optimization method we explore is Covariance Matrix Adaption Evolution Strategy (CMA-ES) Evolution strategies [B¨ack et al., 1991] are iterative algorithms that attempt to optimize a function by introducing stochastic variations at each iteration. CMA-ES [Hansen and Ostermeier, 1996; Hansen, 2016] proceeds by drawing a set of samples from an (initially uninformed) multivariate Gaussian. A new multivariate Gaussian is then constructed. The mean is the weighted mean of the sampled points, where higher weights are given to samples with larger reward values. The covariance matrix is modified from the previous covariance so as to encourage high variance in the direction that the mean is observed to be changing. This procedure is then repeated using the new multivariate Gaussian to sample points. As with PSO, successive generations produced will lead to convergence to a local optimum of the function, with no guarantee with respect to the global optimum.
3.5 Curling and Billiards
Previous work has been done on developing strategies for curling in [Yamamoto et al., 2015]. Work in billiards, a game which is similar to curling with continuous actions and states along with stochastic outcomes, has received some attention in the literature [Archibald et al., 2009; Smith, 2007; 2006]. However, in all of this work, the authors use domain knowledge to create a finite set of discrete actions. This makes it possible for search to be employed without addressing the challenges of optimization in continuous settings. Our work seeks to forego domain knowledge as much as possible, in favor of a more domain-independent approach.
4 Delaunay Sampling
Our Delaunay Sampling (DS) algorithm consists of a sampling stage, based on the work of Surovik and Scheeres [2015], and a selection stage.
4.1 Sampling with Delaunay Triangulation
DS's first stage proceeds as follows:
- Sample the (stochastic) objective function at points distributed uniformly over the range of values of the action parameters.
- Apply Delaunay triangulation [Lee and Schachter, 1980] to the sampled points to partition the continuous action space into a set of disjoint regions.
- Assign each region a weight, which we discuss below.
- Sample the set of regions with replacement, with the probability of a region proportional to its weight.
- Each time a region is selected in the previous step, uniform randomly sample a point within it and add it to the set of sampled points, with its value sampled from the (stochastic) objective function at that point.
- Repeat from step 2 for a fixed number (T) of iterations.
What remains is to specify the weight wi used for region i in step 3 above. Let t T be the current iteration of the algorithm, ai refer to the area of region i, and vij refer to the observed reward of vertex j of region i. We define the weight for region i as,
where
and σ is a tunable parameter that controls the rate of exploration. We call si the score of the region since it will be large if one of the vertices has been observed to result in high reward. Note that if ai is large then wi can be large, encouraging the algorithm to refine large regions; if si is large then wi can be large, encouraging the algorithm to focus on regions with higher observed rewards. As t increases, more weight is put on refining the high-valued regions, since ultimately only the high-value regions are used in the selection stage of the algorithm.
In Step 1 triangulations are done separately for each value of any discrete action parameters (specifically, the binary "turn" parameter in curling). The other steps use the union of regions from all triangulations. This allows the algorithm to allocate more samples to the most promising discrete parameter values.
4.2 Selection of the Final Action
This stage chooses the action that will actually be executed using the following procedure.
- Assign newweights to the regions,
- Select the k regions with the highest weights.
- Run ˆ T iterations of UCB using the chosen regions as the arms of a bandit. When UCB samples a region, the sample is taken at the region's incenter, and its value is a (stochastic) sample of the objective function at that point.
- Return the incenter of the region that was sampled most by UCB.
Different weighting functions are used in the two stages because of the different purposes they serve. The first stage is exploratory, trying to find promising regions that are relatively small. For this purpose it makes sense to use an optimistic score for a region. The aim of the second stage is to identify the region with the largest expected value. For this purpose it is appropriate to repeatedly sample the point within a region that would actually be returned. In preliminary tests, Delaunay triangulation and UCB performed poorly when used by themselves for the entire process. But as we will see, together they seem to address each others' weaknesses.
5 Experimental Setup
As noted in the introduction, we are interested in exploring all of these methods for the problem of selecting a hammer shot in curling.
5.1 Objective Function
What objective function do we wish to optimize? The answer that usually springs to mind is points, i.e. find a shot with the maximum expected point (EP) differential. To see why this is not ideal, consider choosing the very last shot of a game in which the teamwith the hammer is losing by two points. Suppose shot A is 100% guaranteed to score one point and shot B has a 20% chance of scoring 3 points and an 80% chance of giving up one point. Shot A has a much higher EP than B (1▷0 compared to -0▷2) but it has no hope of winning the game, whereas B will win 20% of the time. B is obviously the better choice in this situation. For this reason, we focus on optimizing win percentage (WP), not EP.
The only remaining game state variables after the hammer shot is thrown is n, the number of ends left to play, and δ the number of points by which the team with the hammer is leading (δ is negative if the team with the hammer is losing). We call a pair (n↪ δ) the resulting game state, or g. For example, if g = (1↪-2), WP(g) is the probability of the team with hammer winning if it enters the final end down by two points. We then fit this WP function to data using 28,000 curling games played between 2011 and 2013. 2 For the final end of a game, g = (1↪ δ), we estimated WP(g) using simple frequency statistics for the final ends from the dataset. For the second last end of a game we used the same data to estimate the transition probabilities from g = (2↪ δ) to a game state g0 = (1↪ δ0 ) for the final end. This tells how frequently it happened that the hammer team having a lead of δ when there were two ends to play was followed by the hammer team in the final end having a lead of δ0 . With these transition probabilities and the already-computed values of WP((1↪ δ0 )) for all δ0 , it is easy to compute WP((2↪ δ)) for all δ. The same process can then be applied to compute WP((3↪ δ)), WP((4↪ δ)), etc. With WP(n↪ δ) defined for all values of n and δ, the "score" we return when a hammer shot with x ends remaining results in a lead of δ for the team with the hammer in the next end is WP(x-1↪ δ). This is the objective function our methods aim to maximize in expectation in selecting the hammer shot.
5.2 Experimental Design
The data used for our experiments was drawn from the hammer shot states captured by hand from the 2010 Winter Olympics men's and women's curling competition. 3 A set of 397 hammer shot states from these logs were used in the parameter sweeps mentioned below. The parameter sweep for Delaunay Sampling (DS) chose a value of 14 for σ. A separate set of 515 hammer shot states (the "test states") from these logs were used to evaluate the systems (including the humans).
For each of the test states, we gave DS a budget of between 500 and 3000 samples. This budget includes 100 samples for initializing the triangulation over each turn, 100 samples per iteration of the first stage, and 100 samples for the final UCB stage. After DS selected a shot, 10 outcomes were sampled from the simulator, with the outcome's sample mean used as the resulting estimate of WP. This procedure was repeated 250 times for each test state. The values we report in Table 1 are the average over the 2500 evaluations for each test state.
HOO selected a sample by choosing a turn using UCB and then expanding the cover tree for that turn. We ran HOO for
2 Forfeits were treated as transitions to win/loss states. For rare states, the outcomes used in estimating the transition probabilities came from states with a similar score differential (when near the end of the game) or similar number of ends remaining (when far from the end of the game). The data used came from http://curlingzone.com, and included both women's and men's tournaments, although almost no difference was observed when restricting to data only from one gender or when including only championship level events.
3 The logs do not contain the actual shot played by the humans they only contained the states before and after the hammer shots were taken.
250 trials over the test states using the same sampling budgets as DS. The parameters for HOO described by Bubeck et al. [2009] were set by a parameter sweep to ⇢ = 1 p2 ,
⌫ = 2p2 and UCB constant C = 0▷01.
PSO was tested slightly differently. Since the particles move in a continuous space, having a discrete parameter ("turn") required us to run PSO on each turn separately. For each test state, PSO was run using one turn value and then the other with each run being provided the full sampling budget. The best shots found with each turn were compared and the one with the higher average WP was evaluated one final time to compute its expected WP . This was performed 250 times for each test state. PSO's parameters were set to c1 = 1▷5, c2 = 1▷5, w = 0▷7 and 50 particles.
We used the BIPOP-CMA-ES [Auger and Hansen, 2009] version of CMA-ES for our tests. The experimental setup was the same as for PSO. The parameters for the number of offspring and parents were, respectively, λ = 4 + 3 log 2 and θ = λ◁2 with 4 restarts. We set the initial standard deviation to σ0 = 0▷25 and normalized the action parameters ✓ and v to range between 0 and 1. The parameters for step-size control and the covariance matrix adaptation were set in accordance to the values recommended by Hansen [2016].
GPO was tested in a manner similar to PSO. However, since GPO is considerably slower we implemented it with only a budget size of 250, 500 and 1000 samples per turn with 50 restarts. We chose the squared-exponential function as our GP kernel and set the noise variance, σn = 0▷01.
To determine if DS's average WP on the test states was statistically significantly different than the average WP of the humans or other systems tested, we ran a Wilcoxon signedrank test (WSRT) with one pair of values for each of the 515 test states (one of the values was DS's WP on the state, the other was the WP of the system DS was being compared to). Unless otherwise noted, WSRT produced p-values sufficiently small to conclude with greater than 99% confidence that DS's superior average WP (for any specific sample budget) is not due to chance.
6 Results and Evaluation
Table 1 shows the performance (WP) on the test states of the optimization methods in our study. For any given sample budget, DS's WP was significantly better than that of any other systems tested. HOO performed worse than DS for smaller sample budgets because it was slower to build its cover tree deep enough in the more promising parts of the action space to accurately locate the best shots. Its peformance grows closer to DS's as the sample budget increases. PSO's WP changed very little as its sample budget increased. We conjecture this is because good shots are quite rare, so PSO's initial, random sample of a noisy fucntion may not contain a strong signal to draw the particles towards a global optimum. PSO also tends to converge to suboptimal local optima. CMA-ES also suffers from convergence to suboptimal local optima. GPO tended to take many samples in the large regions where the function has a minimum value (the lightest regions in Figure 1). We believe that given a more generous sampling budget, it would eventually find better shots, but its running time would be prohibitive.
| DS Budget | DS | HOO | PSO | CMA | GPO |
|---|---|---|---|---|---|
| 500 | 0.4956 | 0.4273 | 0.4853 | 0.4932 | 0.4857 |
| 1000 | 0.5203 | 0.4787 | 0.4856 | 0.4958 | 0.4868 |
| 1500 | 0.5277 | 0.4968 | 0.4858 | 0.4954 | - |
| 2000 | 0.5310 | 0.5115 | 0.4849 | 0.4933 | 0.4867 |
| 2500 | 0.5331 | 0.5176 | 0.4858 | 0.4954 | - |
| 3000 | 0.5343 | 0.5212 | 0.4854 | 0.4948 | - |
6.1 Comparison to Human Olympic Teams
The hammer shots actually taken by the Olympic teams on the test states had an average WP of 0▷4893. With a sample budget of 500, DS is not significantly better than the curlers (WSRT p-value = 0.1509) but for all larger sample budgets DS is significantly better (p < 0▷01). Nevertheless, on approximately 20% of the test states the Olympic teams chose a shot that was superior to the shot chosen by DS.
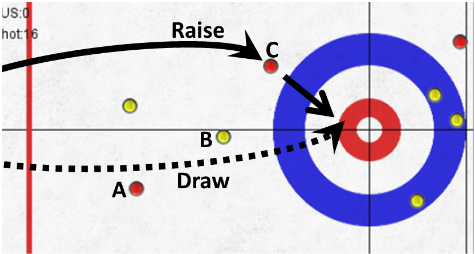
Figure 3 is an example in which DS chose a more robust shot than the Olympic curlers. In this state the team with the dark rocks has the hammer. There are three light rocks in the scoring area (the bulls-eye, called the "house"). To avoid giving up three points, the hammer shot must end with a dark rock closer to the button (the centre of the house) than those light rocks. Two shots that accomplish this are shown in the figure. The "Draw" shot has the thrown rock pass in between rocks A and B and come to rest near the button. The gap between A and B is fairly narrow, so considerable precision is required for this shot to succeed. The worst possible outcome is for the thrown rock to collide with B and knock it into the house, giving a score of 4 to the light team. This is, in fact, what happened when the Olympic curlers threw the shot.
The alternative shot is DS's choice, the "Raise". Here the thrown rock intentionally collides with rock C. Depending on the angle of contact, either C or the thrown rock itself will deflect into the house. In this particular state, the Raise is a more robust shot than the Draw because less precision is required for the Raise to score a point for the dark team and there is no risk of knocking a fourth light rock into the house.
There were a substantial number of test states in which the curlers and DS chose the same shot but the curlers misexecuted the shot and DS, on average, did not. This highlights one of the limitations of this comparison-we were not able to repeatedly sample human execution of a shot to obtain its expected value. This works both ways, of course: just as the curlers may have been unlucky and mis-executed a shot they would make 80% of the time, there may have been shots where they got lucky and perfectly executed a shot they would make only 20% of the time.
A related limitation is that our execution model may have been miscalibrated, making DS more (or less) accurate at shot execution than the Olympic teams. The model was calibrated to Olympic-level curlers to the best of our ability. Likewise, our physics simulation is not a perfect replica of the true physics of curling. So even if our execution model was perfect and exactly the same shot was executed by DS and by the curlers, the distribution of outcomes might be different because of the difference in the physics.
A final limitation of this comparison to Olympic performance is that the data from the Olympics was logged by hand, so the positions of the rocks, as recorded in the logs and used by DS in our study, might not be exactly the positions faced by the curlers during the Olympic games. Small differences in rock positions can substantially affect the distribution of a shot's outcomes. As with all the limitations we have discussed, this could work in favour of DS but it could equally well work against it.
7 Conclusion
Selecting a hammer shot in curling is a challenging lowdimensional non-convex optimization problem. We have empirically tested several existing methods for non-convex optimization on hammer shot states from the 2010 Olympics and all of them were significantly inferior, in terms of average win percentage (WP), to the Delaunay Sampling (DS) method we introduced in this paper. DS also achieved, with some caveats, a significantly higher WP than the Olympic curlers themselves, although there were still a substantial number of states in which the curlers made a superior shot selection.
Acknowledgements
This research was funded by NSERC and Alberta Innovates Technology Futures (AITF) through Amii, the Alberta Machine Intelligence Institute. Computing resources were provided by Compute Canada and Calcul Qu´ebec. We would also like to thank Timothy Yee and Viliam Lisy for their support on this research.
@inproceedings{ijcai2016p86,
  title     = {Action Selection for Hammer Shots in Curling},
  author    = {Ahmad, Zaheen Farraz and Holte, Robert C. and Bowling, Michael H.},
  booktitle = {Proceedings of the Twenty-Fifth International Joint Conference on
               Artificial Intelligence, {IJCAI-16}},
  publisher = {AAAI Press / International Joint Conferences on Artificial Intelligence},
  editor    = {Subbarao Kambhampati},
  pages     = {561--566},
  year      = {2016},
  month     = {7},
  url       = {https://ijcai.org/proceedings/2016/86},
}
TY - CPAPER TI - Action Selection for Hammer Shots in Curling AU - Ahmad, Zaheen Farraz AU - Holte, Robert C. AU - Bowling, Michael H. T2 - Proceedings of the Twenty-Fifth International Joint Conference on Artificial Intelligence, IJCAI-16 PB - AAAI Press / International Joint Conferences on Artificial Intelligence PY - 2016 SP - 561 EP - 566 UR - https://ijcai.org/proceedings/2016/86 ER -Copied
Machine-readable versions of this paper, for tools and AI agents:





