
Word Clouds with Latent Variable Analysis for Visual Comparison of Documents
Proceedings of the Twenty-Fifth International Joint Conference on Artificial Intelligence. Pages 2536-2542.
© 2016 International Joint Conferences on Artificial Intelligence
Abstract
Word cloud is a visualization form for text that is recognized for its aesthetic, social, and analytical values. Here, we are concerned with deepening its analytical value for visual comparison of documents. To aid comparative analysis of two or more documents, users need to be able to perceive similarities and differences among documents through their word clouds. However, as we are dealing with text, approaches that treat words independently may impede accurate discernment of similarities among word clouds containing different words of related meanings. We therefore motivate the principle of displaying related words in a coherent manner, and propose to realize it through modeling the latent aspects of words. Our WORD FLOCK solution brings together latent variable analysis for embedding and aspect modeling, and calibrated layout algorithm within a synchronized word cloud generation framework. We present the quantitative and qualitative results on real-life text corpora, showcasing how the word clouds are useful in preserving the information content of documents so as to allow more accurate visual comparison of documents.
- [Barth et al., 2014] Lukas Barth, Stephen G Kobourov, and Sergey Pupyrev. Experimental comparison of semantic word clouds. In Experimental Algorithms, pages 247-258. Springer, 2014.
- [Bateman et al., 2008] Scott Bateman, Carl Gutwin, and Miguel Nacenta. Seeing things in the clouds: The effect of visual features on tag cloud selections. In HT, 2008.
- [Bernstein et al., 2010] Michael S. Bernstein, Bongwon Suh, Lichan Hong, Jilin Chen, Sanjay Kairam, and Ed H. Chi. Eddi: Interactive topic-based browsing of social status streams. In UIST, pages 303-312. ACM, 2010.
- [Castella and Sutton, 2014] Quim Castella and Charles Sut- ton. Word storms: Multiples of word clouds for visual comparison of documents. In WWW, 2014.
- [Chen et al., 2009] Ya-Xi Chen, Rodrigo Santamaría, An- dreas Butz, and Roberto Therón. Tagclusters: Semantic aggregation of collaborative tags beyond tagclouds. In Smart Graphics, pages 56-67. Springer, 2009.
- [Chuang et al., 2012] Jason Chuang, Christopher D Man- ning, and Jeffrey Heer. Termite: Visualization techniques for assessing textual topic models. In AVI, 2012.
- [Coppersmith and Kelly, 2014] Glen Coppersmith and Erin Kelly. Dynamic wordclouds and vennclouds for ex- ploratory data analysis. Sponsor: Idibon, page 22, 2014.
- [Cui et al., 2010] Weiwei Cui, Yingcai Wu, Shixia Liu, Furu Wei, Michelle X Zhou, and Huamin Qu. Context preserv- ing dynamic word cloud visualization. In PacificVis, 2010.
- [Dempster et al., 1977] A. P. Dempster, N. M. Laird, and D. B. Rubin. Maximum likelihood from incomplete data via the EM algorithm. JRSS, 39(1):1-38, 1977.
- [Dou et al., 2013] Wenwen Dou, Li Yu, Xiaoyu Wang, Zhiqiang Ma, and William Ribarsky. Hierarchicaltopics: Visually exploring large text collections using topic hier- archies. TVCG, 19(12):2002-2011, 2013.
- [Fujimura et al., 2008] Ko Fujimura, Shigeru Fujimura, Tat- sushi Matsubayashi, Takeshi Yamada, and Hidenori Okuda. Topigraphy: Visualization for large-scale tag clouds. In WWW, pages 1087-1088. ACM, 2008.
- [Hassan-Montero and Herrero-Solana, 2006] Yusef Hassan- Montero and Victor Herrero-Solana. Improving tag-clouds as visual information retrieval interfaces. In InSciT, 2006.
- [Iwata et al., 2007] Tomoharu Iwata, Kazumi Saito, Naonori Ueda, Sean Stromsten, Thomas L Griffiths, and Joshua B Tenenbaum. Parametric embedding for class visualization. Neural Computation, 19(9):2536-2556, 2007.
- [Iwata et al., 2008] Tomoharu Iwata, Takeshi Yamada, and Naonori Ueda. Probabilistic latent semantic visualization: topic model for visualizing documents. In KDD, 2008.
- [Knautz et al., 2010] Kathrin Knautz, Simone Soubusta, and Wolfgang G Stock. Tag clusters as information retrieval interfaces. In HICSS, pages 1-10. IEEE, 2010.
- [Kruskal, 1964] Joseph B Kruskal. Multidimensional scaling by optimizing goodness of fit to a nonmetric hypothesis. Psychometrika, 29(1):1-27, 1964.
- [Le and Lauw, 2014] Tuan M. V. Le and Hady W. Lauw. Manifold learning for jointly modeling topic and visual- ization. In AAAI, 2014.
- [Lohmann et al., 2015] Steffen Lohmann, Florian Heimerl, Fabian Bopp, Michael Burch, and Thomas Ertl. Concentri cloud: Word cloud visualization for multiple text docu- ments. In InfoVis, pages 114-120. IEEE, 2015.
- [Oelke et al., 2014] Daniela Oelke, Hendrik Strobelt, Chris- tian Rohrdantz, Iryna Gurevych, and Oliver Deussen. Comparative exploration of document collections: a vi- sual analytics approach. Computer Graphics Forum, 33(3):201-210, 2014.
- [Paulovich et al., 2012] Fernando V Paulovich, Franklina Toledo, Guilherme P Telles, Rosane Minghim, and Luis Gustavo Nonato. Semantic wordification of docu- ment collections. Computer Graphics Forum, 31(3pt3), 2012.
- [Rivadeneira et al., 2007] Anna W Rivadeneira, Daniel M Gruen, Michael J Muller, and David R Millen. Getting our head in the clouds: toward evaluation studies of tagclouds. In Proceedings of the SIGCHI Conference on Human Fac- tors in Computing Systems, pages 995-998. ACM, 2007.
- [Rodrigues, 2013] Nils Rodrigues. Analyzing textual data by multiple word clouds. Master's thesis, Universität Stuttgart, Holzgartenstr. 16, 70174 Stuttgart, 2013.
- [Seifert et al., 2008] Christin Seifert, Barbara Kump, Wolf- gang Kienreich, Gisela Granitzer, and Michael Granitzer. On the beauty and usability of tag clouds. In InfoVis. IEEE, 2008.
- [Shi et al., 2010] Lei Shi, Furu Wei, Shixia Liu, Li Tan, Xi- aoxiao Lian, and Michelle X Zhou. Understanding text corpora with multiple facets. In VAST, pages 99-106. IEEE, 2010.
- [Steele and Iliinsky, 2010] Julie Steele and Noah Iliinsky. Beautiful visualization: looking at data through the eyes of experts. " O'Reilly Media, Inc.", 2010.
- [Viegas et al., 2009] Fernanda B Viegas, Martin Wattenberg, and Jonathan Feinberg. Participatory visualization with wordle. TVCG, 15(6):1137-1144, 2009.
- [Wei et al., 2010] Furu Wei, Shixia Liu, Yangqiu Song, Shimei Pan, Michelle X Zhou, Weihong Qian, Lei Shi, Li Tan, and Qiang Zhang. Tiara: a visual exploratory text analytic system. In KDD, pages 153-162. ACM, 2010.
- [Wu et al., 2011] Yingcai Wu, Thomas Provan, Furu Wei, Shixia Liu, and Kwan-Liu Ma. Semantic-preserving word clouds by seam carving. Computer Graphics Forum, 30(3):741-750, 2011.
- [Zuo et al., 2015] Yuan Zuo, Jichang Zhao, and Ke Xu. Word network topic model: A simple but general solution for short and imbalanced texts. Knowledge and Informa- tion Systems, pages 1-20, 2015.
References were extracted automatically from the PDF and may contain errors.
Full text extracted automatically from the PDF; figures, tables and equations may differ. The PDF is the version of record.
1 Introduction
The abundance of text motivates the development of text analysis tools. One such need is to aid users in comparing several documents. For instance, a user may go through Web search results to determine how they differ from one another. A researcher needs to get an overview of various papers within a proceeding or a journal issue. Similar needs are faced by librarians or analysts. In such scenarios, users need to quickly gain a sense of whether several documents are similar.
Visualization may help in document comparison, by providing visual representations that allow users to perceive similarities and differences tangibly. There are various visualization forms. One is a scatterplot, showing documents as coordinates in a 2 or 3-dimensional space [Kruskal, 1964]. While it allows easy determination of whether two documents are similar (based on their distance in the scatterplot), it is not effective in conveying contents, which are important in providing meaning or justification to similarities.
Hady W. Lauw
School of Information Systems Singapore Management University hadywlauw@smu.edu.sg
Therefore, we focus on another visual representation, i.e., a word cloud displaying a subset of words within a document, by assigning greater visual prominence to more important words. Because a word cloud still displays the actual words, it is better at conveying the content of the corresponding document than a scatterplot. In addition, word cloud as a visualization form is extremely popular [Viegas et al., 2009]. For instance, Wordle 1 has generated more than 1.4 million publicly posted word clouds [Steele and Iliinsky, 2010].
Problem. We seek effective visual comparison of documents via word clouds. Ideally, documents with similar contents have word clouds of similar appearances. Traditional approaches fall short of this ideal, as word clouds of different documents are generated independently using a layout algorithm [Viegas et al., 2009; Seifert et al., 2008]. Two documents may feature similar words that are placed in different colors and positions within their respective word clouds, placing a burden on the viewer in corroborating their similarities.
The state-of-the-art approach, Word Storms [Castella and Sutton, 2014], employs a synchronized generation of the word clouds of all documents within a corpus. A word is expected to have the same color and position across word clouds. This aims to reduce the cognitive effort needed for comparing word clouds. However, it has two shortcomings. First, it only seeks to synchronize the appearance of each distinct word. This is problematic, as text frequently uses different words to refer to the same concept. Second, its synchronization of all word clouds imposes sizeable runtime requirement that prevents real-time generation of word clouds.
These issues arise because word clouds are still highdimensional representations, with dimensionality the size of the vocabulary. Our insight is that a word cloud can encode information at several dimensionalities simultaneously. In addition to the actual words, the position of a word in the twodimensional canvas space can reflect some two-dimensional word representation that captures relatedness among words, such as embedding that assigns nearby coordinates to "related" words, e.g., [Kruskal, 1964]. We can also have the word color reflect some k-dimensional word representation that captures k latent "aspects" of words. Each aspect may capture words of similar meaning or words often used together to describe a certain concept.
1 http://www.wordle.net/
a. Doc101 by Word Flock b. Doc111 by Word Flock c. Doc132 by Word Flock d. Doc136 by Word Flock
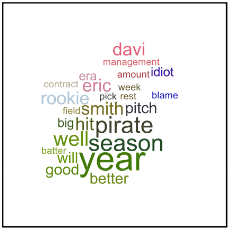
a. Doc472 by Word Flock b. Doc473 by Word Flock c. Doc495 by Word Flock d. Doc499 by Word Flock
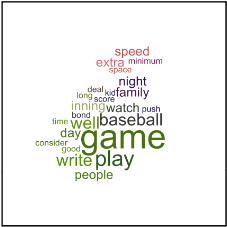
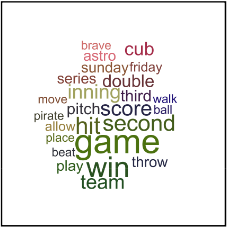
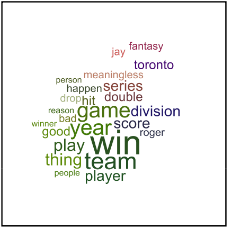
Figure 2: Word clouds by WORD FLOCK for 4 documents from rec.sport.baseball of 20News (best seen in color)
Approach. To realize the vision of multiple dimensionalities within a word cloud, we propose a technique called WORD FLOCK. The name is inspired by the idiom "birds of a feather flock together". In our case, words of a "feather" (similar aspects/colors) flock together (similar positions).
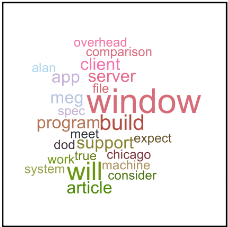
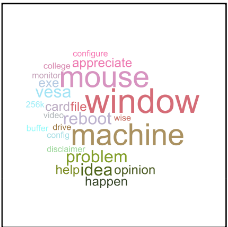
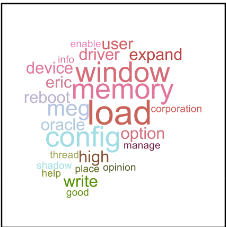
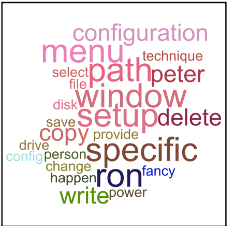
To illustrate how word clouds could provide effective visual comparison of documents, Figure 1 and Figure 2 show example word clouds generated by WORD FLOCK for documents in the 20News dataset 2 . The four word clouds in Figure 1 are for documents from the comp.os.ms-windows.misc category, pertaining to Windows computing. Words such as "window", "file", and "memory" have similar colors (reddish hue) and positions (top right) across the four word clouds. The four word clouds in Figure 2 are for documents from the rec.sport.baseball category, with words such as "hit", "play", "game", and "team" sharing similar greenish hues and bottom left positions. Quick perusal of them is sufficient to convey which documents are similar (same category). Note that category labels had not been used in generating word clouds.
WORD FLOCK is underpinned by a novel approach of employing latent variable analysis for word cloud generation. Given a vocabulary of words, we seek to learn their latent representations in two forms. The first is coordinate representation in a two-dimensional space, which is derived from a latent embedding model. The second is a probability distribution over k latent aspects. This representation learning phase can be done offline once for a given vocabulary. Thereafter, we generate a word cloud for a document online, incorporating these representations in a calibrated layout algorithm.
2 http://web.ist.utl.pt/acardoso/datasets/
Contributions. We make the following contributions:
- ÷ WORD FLOCK is the first to integrate two levels of "synchronization" principles for word clouds: similar documents share similar word clouds, and related words of the same latent aspects are displayed similarly.
- ÷ WORD FLOCK is novel in employing latent variable analysis through joint usage of embedding (synchronized positioning) and latent aspect modeling (coloring) among words of similar concepts.
- ÷ Comprehensive experiments on real-life document corpora showcase the effectiveness of WORD FLOCK via an empirical comparison to the baseline Word Storms [Castella and Sutton, 2014], on objective quantitative metrics, as well as a user study.
- ÷ The two-phase approach attains the synchronization of word representations offline, so as to obviate the need to generate all word clouds together. This allows an online generation of individual word clouds at near-instant speed, which eludes the baseline Word Storms.
2 RelatedWork
Word clouds are popular for aesthetic, social, and analytical purposes [Viegas et al., 2009]. Here, we focus on the use of word clouds for visual comparison of documents. This application is advanced by Word Storms [Castella and Sutton,
2014], which introduced synchronization at corpus level. We go one step further and model the coherence of words within and across word clouds. In Section 6, we compare to Word Storms as our baseline.
Our work models latent aspects of words and increases the coherence of word clouds by displaying related words with similar colors and positions. Word similarity was previously considered only in the context of an individual word cloud [Hassan-Montero and Herrero-Solana, 2006; Knautz et al., 2010; Bernstein et al., 2010], and based on similarity measures such as cosine [Barth et al., 2014; Cui et al., 2010; Wu et al., 2011]. In contrast, we model the coherence of synchronized (rather than individual) word clouds for comparison of documents. Moreover, we employ latent variable analysis to learn the probability distribution over k latent aspects (rather than similarity). We are also the first to employ joint modeling of embedding and latent aspects for word clouds.
Other approaches for document comparison deviated from the traditional word cloud format, e.g., graph visualization [Chen et al., 2009], or topographic map [Fujimura et al., 2008]. Some showed comparisons in a modified format, e.g., intersecting or common words [Coppersmith and Kelly, 2014; Lohmann et al., 2015], different topics [Oelke et al., 2014] or corpora [Rodrigues, 2013; Paulovich et al., 2012].
There are formats for document visualization other than word clouds. One is embedding to a low-dimensional space [Kruskal, 1964]. However, a scatterplot does not offer a way to indicate the contents of documents. Towards modeling the semantic contents of documents, recent approaches marry embedding and topic modelling of documents, such as PLSV [Iwata et al., 2008] and Semafore [Le and Lauw, 2014]. We leverage on such techniques to learn both the two-dimensional and k-dimensional latent representations of words, with a key distinction being our objective of modeling the latent aspects of words, rather than the latent topics of documents.
Some works build a visual system with rich user interactions [Wei et al., 2010; Shi et al., 2010] to help users explore text corpora. These use topic modeling for documents in text visualization, which is different from our work in that we use aspect modeling for words in word cloud visualization.
There are also methods designed to visualize the latent topics of documents [Chuang et al., 2012; Dou et al., 2013]. They are fundamentally different, being oriented towards analysing the topic model itself, rather than developing a word cloud representation of a document.
3 Overview of WORD FLOCK
Problem Statement. We assume that the scope is defined by a vocabulary W, the set of words that could appear in any word cloud in a corpus. As input, we are given a corpus of documents D = ¶d1↪ d2↪ ▷ ▷ ▷ ↪ dN♦. Every document dn consists of words drawn from the vocabulary W. The objective is to generate a set of word clouds ¶C1↪C2↪ ▷ ▷ ▷ ↪CN♦, one for each document in D, so as to aid visual comparison of documents through their respective word clouds.
We display each word in a cloud according to a number of visual attributes. There are various visual variables within a word cloud, and in general different visual features may be good for different types of information [Bateman et al., 2008]. Here, we make use of three visual attributes: font size, color, and position. Each word w in Cn for dn is associated with a tuple hsw↪ pw↪ lwi, where sw is the font size, pw is the word position in terms of 2D coordinates, and lw is the color. Fixing the orientation to horizontal prevents the cognitive overload of reading randomly oriented words.
Solution Framework. We now discuss the principles for the design of our word cloud algorithm WORD FLOCK.
Principle #1: Display related words similarly. Words in a document are not independent. Some words may capture a particular concept or aspect. It is far easier to understand a word cloud in terms of a small number of coherent concepts, rather than in terms of a large number of independent words. Among the visual attributes, we rely on position (pw) and color (lw). Through a dimensionality reduction task known as embedding, we seek to derive coordinates for each word in a latent two-dimensional space, such that two related words are nearby in this space. The continuous spectrum of color is also appropriate to convey the underlying aspects or concepts of words. We discover these aspects automatically through latent aspect modeling. We pursue these tasks jointly, computing them offline once for the corpus to support the synchronization of positions and colors across all word clouds.
Principle #2: Similar documents have similar word clouds. Aimed squarely at aiding visual comparison of documents, this principle motivates the coherent appearances of word clouds of similar documents. This is achieved by infusing and calibrating the layout algorithm with the coordinated positions and colors determined by the embedding and latent aspect. Consequently, the online layout of each new word cloud requires only a small marginal computational cost.
In the next two sections, we describe the two phases of the WORD FLOCK algorithm. Due to the limitation of canvas space, conventionally only the more important words are included [Seifert et al., 2008]. Word prominence is indicated by the font size (sw). There are various notions of "importance" of a word. Without loss of generality, here we use the well-accepted term frequency (tf ), after removing stop words.
4 Embedding and Latent Aspect Modeling
The objective is to derive coordinates in a 2D space, as well as a k latent aspects of words. To do so, we need to associate words with informative feature space representation. By feature space representation, we refer to a feature vector w for each word w, capturing information on how words are associated with one another. To express w, each word w is considered a "pseudo-document" containing all words that w co-occurs with. Each w is expressed in terms of word counts where each element of w corresponds to how frequently another word v co-occurs with w in some reference corpus. This corpus may be a large independent corpus (e.g., Wikipedia), or the specific corpus of interest. The co-occurence of two words can be determined by their appearance within a document or a window. This way of modeling is consistent with [Zuo et al., 2015]. Intuitively, two different words with similar co-occurrence counts are likely to share a similar meaning.
The task is to reduce the high-dimensional ¶w♦w2W to lower-dimensional representations. In obtaining 2D coordinates ¶xw♦w2W for each word, the aim is similar to embedding, whereas in obtaining latent aspects of words, it is feasible to learn it from word cooccurrences [Zuo et al., 2015]. While embedding and latent aspect modeling could be done independently, recent works [Iwata et al., 2008; Le and Lauw, 2014] show that it is beneficial to join the two tasks into a single joint model to ensure consistency in objectives. We therefore adapt the state-of-the-art model Semafore [Le and Lauw, 2014], originally designed for topics in documents, now to model latent word aspects, with the following generative process:
- For each latent aspect z = 1↪ ▷ ▷ ▷ ↪ k:
- (a) Draw z's distribution of words: ✓z ⇠ Dirichlet(↵)
- For each word w 2W:
- (b) Draw z's coordinate: φz ⇠ Normal(0↪ β-1 I)
- (a) Draw w's coordinate: xw ⇠ Normal(0↪ γ-1 I)
- Draw a latent aspect: z ⇠ Multi(¶P(z♣xw↪ Φ)♦kz=1 )
- (b) For each occurrence of a co-occurring word v 2 w:
- Draw a co-occurring word: v ⇠ Multi(✓z)
↵ is a Dirichlet prior, I is an identity matrix, β and γ control the variance of the Normal distributions. P(z♣xw↪Φ) defines how the coordinate of each word xw transforms into the probability of each latent aspect z, according to Equation 1. The closer is xw to the aspect coordinate φz, the higher is the probability. Φ is the collection of aspect coordinates.
To ensure the local consistency of words in the manifold, the method employs neighborhood regularization as in Equation 3. λ is the regularization parameter. yij encodes the manifold graph, with yij = 1 signifying that wi and wj are neighbors in the manifold graph built from feature space representation, and yij = 0 otherwise. The regularized L reflects the idea that similar (neighboring) words should have closer coordinates, while different (non-neighboring) words should have further coordinates.
The parameters are learned from ¶w♦w2W based on maximum a posteriori estimation through EM [Dempster et al., 1977]. The outputs are the coordinates xw, as well as probability distribution over k latent aspects ¶P(z♣xw↪ Φ)♦kz=1 , for every word w in the vocabulary W. These outputs underpin the online generation of word clouds described next.
5 Word Cloud Layout with Scale Calibration
We include only top M words in a document by weight (e.g., term frequency). The font size sw is controlled by this weight.
The color of each word lw is determined based on its aspect probabilities ¶P(z♣xw↪Φ)♦kz=1 from the first phase. lw is expressed in terms of a color representation, such as RGB. There are different schemes for transforming the aspect probabilities into word colors. For instance, we could assign each aspect a color, and for each word we take the weighted average of its aspects' colors, or that of the strongest aspect. However, these approaches would require associating a color to each topic, which itself is not a straightforward task.
A better approach to assign colors to words automatically, which we adopt here, is to have a color map based on the aspect probabilities. Since RGB colors lie in a threedimensional (3D) space (i.e., R, G, and B axes), we employ PE [Iwata et al., 2007] to find the embedding of the k aspect probabilities of all words into a 3D space. We then map these 3D coordinates to the RGB space using min-max normalization to find the word colors. This way, words with similar aspect probabilities would share similar colors.
The word position pw should be similar, if not identical, to the word coordinate xw from the first phase. There are two issues. First, the canvas space over which pw is defined has a different scale from the embeding space of xw. We therefore introduce a scaling factor Γ, i.e., pw = Γ ⇥ xw.
Second, even if the former could be calibrated, some words may have similar xw's, causing overcrowding. This is not unique to us. Classically, word clouds have had to deal with how to position words in a compact and non-overlapping way [Seifert et al., 2008]. Similarly to Word Storms [Castella and Sutton, 2014], we build on Wordle's algorithm. Our layout algorithm is shown in Algorithm 1. It works in a greedy and incremental manner. As indicated previously, our requirement is different in having to deal with the scale calibration issue.
The scaling factor Γ is calibrated so as to optimize an objective function that captures the aesthetic quality. First, it is desired that a word cloud is compact, expressed in terms of smaller distances of the final word positions pw 0 from the origin. Second, it is desired that similar words are placed close to one another. Suppose that ⌘w is the set of m closest neighboring words of w in Cn (based on their embedding coordinates xw's). We would like w to have a final position pw 0 that is as close as possible to its neighbors in ⌘w. To achieve this, we propose the objective function in Equation 4.
During the calibration process, we investigate various scaling factors Γ to minimize Equation 4. We further advocate an offline calibration to arrive at a single Γ for any new document. There is usually a single scaling factor that works for most documents. This also saves time in the online generation of word cloud that only needs to run the layout algorithm.
6 Evaluation
Evaluating word clouds is challenging because of the various purposes that they could be aimed at, e.g., gisting, word re- Algorithm 1 Spiral Algorithm with Calibration of Scaling Require: Mn words for each document dn, 2D coordinates ¶xw♦w2W obtained from embedding in offline phase, and a set of scaling factors Γ.
Ensure: Final scaling factor γ and for each document dn, positions pn of Mn words in the word cloud of dn.
- 1: for each scaling factor γ 2 Γ do
- 3: for all words w 2 ¶w1↪ ▷ ▷ ▷ ↪ wMn ♦ do
- 2: for all document dn, n 2 ¶1↪ ▷ ▷ ▷ ↪ N♦ do
- 4: Initialize pw = γ ⇥ xw
- 5: while pw intersects any previous words do 6: Move pw one step along a spiral path
- 7: end while
- 8: end for
- 9: end for
- 10: Compute the objective function value in Equation 4.
- 11: Store the γ and all pn with the best objective function value so far.
- 12: end for
call [Rivadeneira et al., 2007]. We focus on the task of visual comparison of documents. This involves a multi-prong approach, including qualitative examples, quantitative metrics involving objective ground truth, as well as a user study.
6.1 Experimental Setup
First, we describe the experimental setup.
Datasets. We rely on two publicly available datasets of text documents, where each document has a known category label. These labels are not required for training. Rather, they are used in evaluation as an objective proxy for defining what constitute "similar" documents (i.e., same category). The two datasets 3 are: 20News containing newsgroup documents partitioned into 20 classes, and Reuters containing newswire articles from 8 classes. To create a balanced dataset, we sample 50 documents from each class, resulting in 1000 and 400 documents respectively. After removing stopwords and infrequent words (< 5 occurrences), the vocabulary consists of 3744 words for 20News, and 1933 words for Reuters.
Methods. WORD FLOCK incorporates synchronization principles for both documents and words for visual comparison of documents. The most appropriate baseline for this task is Word Storm [Castella and Sutton, 2014], which applies synchronization of word clouds across documents, but does not address relatedness among words. We use the authors' implementation in GitHub 4 .
As longer documents may result in word clouds that are too "busy", we show up to twenty five words based on weight. The same words are visualized by the comparative methods.
For WORD FLOCK, we also need to specify the number of latent aspects of words k. We experiment with k in the range [5, 25]. For each k, we tune the scaling factor Γ to minimize the Equation 4. Γ is tuned with ♣⌘w♣ = 3. The optimal Γ ranges from 20 to 25. Through experimentation, we discover that k = 20 works best for both 20News and Reuters. Note that the number of colors in a word cloud generated by Word Flock is not directly determined by k. We map the aspect distribution of words across the full RGB spectrum (see Section 5). If all words in a document were distinctly different, they would show up with different colors. However, words appearing within a document tend to be related. Usually only a small number of colors are seen in a word cloud by WORD FLOCK due to the relative coherence of words in a document.
3 http://web.ist.utl.pt/acardoso/datasets/
4 https://github.com/quimcastella/WordStorm
6.2 Qualitative Analysis
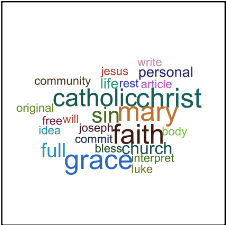
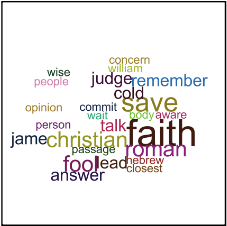
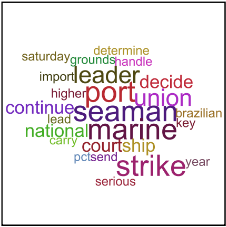
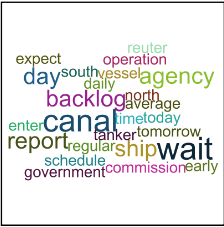
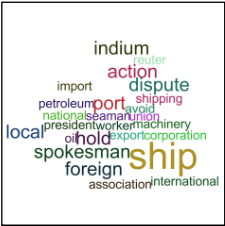
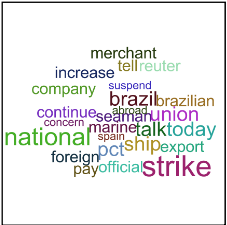
We begin with an exploration of example word clouds from 20News. Figure 3 shows Word Storm's word clouds for four documents from the soc.religion.christian category. Figure 4 shows the corresponding word clouds by WORD FLOCK. There are several words that capture the semantic meaning of the documents, such as "god", "christ", "jesus", "faith" and "christian". Word Storm disperses these words across each word cloud, because it does not address their relatedness and relies on having the exact same words for comparison, which fails when documents use different words. In Figure 3(a) and Figure 3(d), Word Storm uses the same location and color for "body", but other words are different across the two clouds. In contrast, WORD FLOCK groups related words in similar positions and colors, yielding four strikingly coherent word clouds. This is also evident from the previous examples of WORD FLOCK's word clouds for comp.os.ms-windows.misc category in Figure 1 and for rec.sport.baseball in Figure 2.
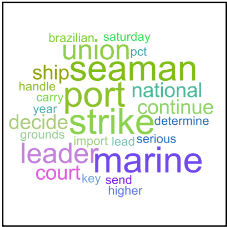
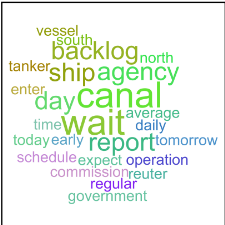
Examples from Reuters also reveal the contrast between Word Storm and WORD FLOCK. Figures 5 and 6 shows the respective word clouds by Word Storm and WORD FLOCK for four documents from the ship category of Reuters. While related words such as "ship", "vessel", "canal", "port", "seaman", and "shipping" are grouped together by WORD FLOCK, these words are dispersed and have different colors in Word Storm's word clouds.
6.3 Classification
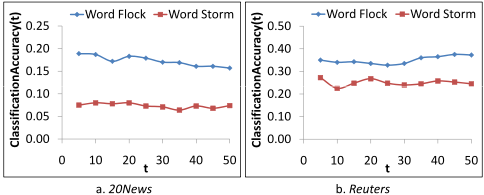
We seek further evidence through an automatic evaluation that offers a repeatable and objective validation. Each word cloud is represented as a vector of image pixels, where each pixel is represented by its RGB value. We validate how well the pixel representation of the word cloud images may be used as features in classification, with the simple nearest neighbors classifier. For every document, we hide its class label. We then identify its t-nearest neighbors based on cosine similarity over the pixel representations, and assign the document the majority class among its neighbors. Classif icationAccuracy(t) is the fraction of documents for which the classification derives the correct labels. We average the accuracies across ten runs. This is merely for evaluation, and is not meant as a technique for document classification.
Figure 7(a) shows that WORD FLOCK has significantly higher accuracies than Word Storm on 20News. A random classifier would have an accuracy of 0.05. Word Storm performs at around 0.08. WORD FLOCK attains more than 100% increase in accuracy over Word Storm. For Reuters in Figure 7(b), WORD FLOCK is also better. The improvements over Word Storm are statistically significant at 0.01 level. The
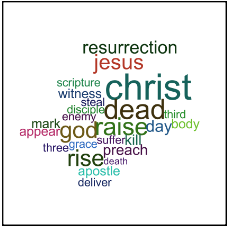
- Doc762 by Word Storm
- Doc770 by Word Storm
- Doc788 by Word Storm
- Doc790 by Word Storm
- Doc762 by Word Flock
- Doc770 by Word Flock
- Doc788 by Word Flock
- Doc790 by Word Flock
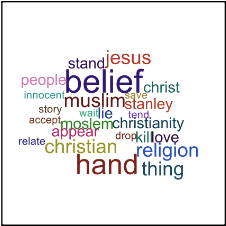
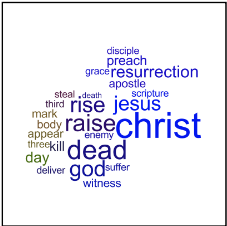
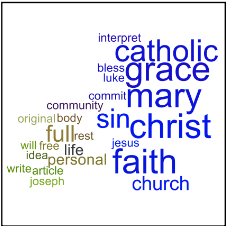
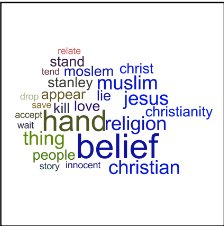
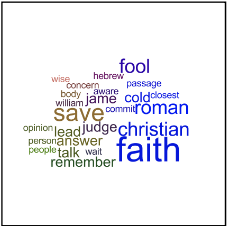
a. Doc165 by Word Storm b. Doc169 by Word Storm c. Doc171 by Word Storm d. Doc199 by Word Storm
- Doc165 by Word Flock
b. Doc169 by Word Flock c. Doc171 by Word Flock performance is closer because Reuters is an "easier" dataset (a random classifier would attain 0.125 accuracy).
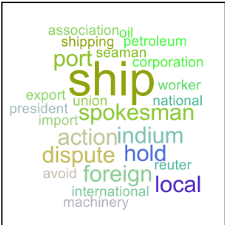
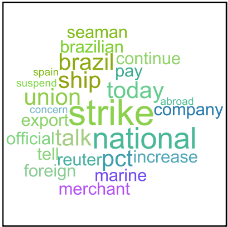
Figure 6: Word clouds by WORD FLOCK for 4 documents from ship of Reuters (best seen in color)
6.4 Neighborhood Preservation
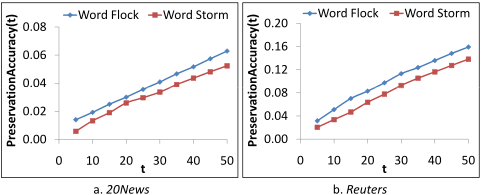
Ideally, a word cloud should be a faithful representation of its original document. In the next evaluation task, given a query document, we seek to retrieve the t most similar documents. We consider the ground truth to be the most similar documents over the original text representation of documents (i.e., cosine similarity over the 25-word term frequency vectors). PreservationAccuracy(t) is defined as the fraction of t ground-truth documents that are "preserved" or identified among the t retrieved images (based on cosine similarity over the pixel representation). Figure 8(a) for 20News and Figure 8(b) for Reuters show that WORD FLOCK has higher preservation accuracies than Word Storm over various t's. This indicates that the resulting word clouds by WORD FLOCK better preserve the similarities among the original documents. The difference between the two methods is statistically significant at 0.01 level in all cases.
6.5 User Study
We conduct a pilot user study on 20News to confirm our results in the quantitative analyses. The study involves two types of questions/tasks related to visual comparison of documents, which were similar to the study conducted in [Castella and Sutton, 2014]. For the first type, each user views six clouds, and is asked to identify the most different one. Among the six, five come from the same category, and one (the ground truth) comes from a different category. For the second type, each user views one query cloud and six answer clouds, and is asked to identify which answer cloud is most similar to the query cloud. Among the six, only one (the ground truth) comes from the same category as the query.
| Question | Accuracy (%) | Time (s) | ||
|---|---|---|---|---|
| Word Storm | WORD FLOCK | Word Storm | WORD FLOCK | |
| Type 1: Select the most different cloud | 71.1 | 78.9 | 15.7 | 14.6 |
| Type 2: Select the cloud most similar to a given cloud | 63.6 | 70.0 | 16.6 | 16.1 |
For each type, a user has to complete 30 multiple-choice questions, with a time limit of 30 seconds per question. The clouds for each question are generated either by Word Storm or by WORD FLOCK and each user is randomly presented with one of the two versions. There are 6 users involved in the study. Therefore, each question is answered 3 times using Word Storm and 3 times using WORD FLOCK . The 6 clouds are sorted randomly and the users do not know how many methods there are, or which method is used for each question. We track accuracy and average time to answer each question.
Table 1 summarizes the results of the user study. For Type 1 questions, WORD FLOCK helps users to attain a higher accuracy, 78.9% as compared to 71.1% for Word Storm, and with less time too (the time spent to answer was reduced by about a second). For Type 2, WORD FLOCK also has a higher accuracy of 70.0% vs. 63.6% for Word Storm, again with slightly improved timing. The results are quite consistent among users, with 5 out of 6 users achieving higher accuracy with WORD FLOCK than with Word Storm for both types.
6.6 Brief Comment on Efficiency
We comment briefly on one efficiency advantage of WORD FLOCK over Word Storm, in our ability to generate individual word clouds in an online fashion. Word Storm must process all word clouds together. For the 1000 documents in 20News, it requires 15 minutes on Intel Core i7 2.4Ghz machine with 8GB memory. Adding a new document requires looping over all the previously generated word clouds again to ensure consistency. In contrast, WORD FLOCK achieves synchronization offline, so as to enable online generation of each word cloud independently, which requires only between 100 to 200 millisecond for every new word cloud.
7 Conclusion
We are interested in producing effective word clouds for visual comparison of documents within a corpus. The key idea is to construct word clouds to show related words with similar appearances, to enhance cognition of aspects across multiple word clouds. WORD FLOCK achieves this via latent variable analysis, including offline embedding and latent aspect modeling, followed by online generation of word clouds. Through multi-faceted evaluation on two public datasets, we show evident outperformance by WORD FLOCK over the baseline.
There are several potential directions for future work. One direction is to further enrich the word clouds by encoding some useful information in other visual attributes such as word orientation. Another direction is to further investigate the use of word clouds in specific application scenarios such as document retrieval or document summarization.
@inproceedings{ijcai2016p361,
  title     = {Word Clouds with Latent Variable Analysis for Visual Comparison of Documents},
  author    = {Le, Tuan M. V. and Lauw, Hady Wirawan},
  booktitle = {Proceedings of the Twenty-Fifth International Joint Conference on
               Artificial Intelligence, {IJCAI-16}},
  publisher = {AAAI Press / International Joint Conferences on Artificial Intelligence},
  editor    = {Subbarao Kambhampati},
  pages     = {2536--2542},
  year      = {2016},
  month     = {7},
  url       = {https://ijcai.org/proceedings/2016/361},
}
TY - CPAPER TI - Word Clouds with Latent Variable Analysis for Visual Comparison of Documents AU - Le, Tuan M. V. AU - Lauw, Hady Wirawan T2 - Proceedings of the Twenty-Fifth International Joint Conference on Artificial Intelligence, IJCAI-16 PB - AAAI Press / International Joint Conferences on Artificial Intelligence PY - 2016 SP - 2536 EP - 2542 UR - https://ijcai.org/proceedings/2016/361 ER -Copied
Machine-readable versions of this paper, for tools and AI agents:





