
Music Recommenders: User Evaluation Without Real Users?
Proceedings of the Twenty-Fourth International Joint Conference on Artificial Intelligence. Main Track. Pages 1749-1754.
© 2015 International Joint Conferences on Artificial Intelligence
Abstract
Good music recommenders should not only suggest quality recommendations, but should also allow users to discover new/niche music. User studies capture explicit feedback on recommendation quality and novelty, but can be expensive, and may have difficulty replicating realistic scenarios. Lack of effective offline evaluation methods restricts progress in music recommendation research. The challenge is finding suitable measures to score recommendation quality, and in particular avoiding popularity bias, whereby the quality is not recognised when the track is not well known. This paper presents a low cost method that leverages available social media data and shows it to be effective. Not only is it based on explicit feedback from many users, but it also overcomes the popularity bias that disadvantages new/niche music. Experiments show that its findings are consistent with those from an online study with real users. In comparisons with other offline measures, the social media score is shown to be a more reliable proxy for opinions of real users. Its impact on music recommendation is its ability to recognise recommenders that enable discovery, as well as suggest quality recommendations.
- [Amatriain et al., 2009a] Xavier Amatriain, Josep M. Pujol, Nava Tintarev, and Nuria Oliver. Rate it again: increasing recommendation accuracy by user re-rating. In Proceed- ings of the 3rd ACM conference on Recommender systems, pages 173-180. ACM Press, 2009a.
- [Amatriain et al., 2009b] Xavier Amatriain, Josep M. Pujol, and Nuria Oliver. I like it... I like it not: Evaluating user ratings noise in recommender systems. In Proceedings of the 17th International Conference on User Modeling, Adaptation, and Personalization, LNCS 5535, pages 247- 258. Springer, 2009b.
- [Bertin-Mahieux et al., 2011] Thierry Bertin-Mahieux, Dan- iel P.W. Ellis, Brian Whitman, and Paul Lamere. The mil- lion song dataset. In Proceedings of the 12th International Society for Music Information Retrieval Conference (IS- MIR), pages 591-596, 2011.
- [Breese et al., 1998] John S. Breese, David Heckerman, and Carl Kadie. Empirical analysis of predictive algorithms for collaborative filtering. In Proceedings of the 14th Confer- ence on Uncertainty in Artificial Intelligence, pages 43- 52.
- Morgan Kaufmann, 1998.
- [Bu et al., 2010] Jiajun Bu, Shulong Tan, Chun Chen, Can Wang, Hao Wu, Lijun Zhang, and Xiaofei He. Music recommendation by unified hypergraph: combining social media information and music content. In Proceedings of the 10th International Conference on Multimedia, pages 391-400. ACM Press, 2010.
- [Celma, 2010] Oscar Celma. Music Recommendation and Discovery: The Long Tail, Long Fail, and Long Play in the Digital Music Space. Springer, 2010.
- [Eck et al., 2007] Douglas Eck, Paul Lamere, Thierry Ber- tin-Mahieux, and Stephen Green. Automatic generation of social tags for music recommendation. Advances in Neural Information Processing Systems, 20:385-392, 2007.
- [Ellis et al., 2002] Daniel P.W. Ellis, Brian Whitman, Adam Berenzweig, and Steve Lawrence. The quest for ground truth in musical artist similarity. In Proceedings of the 3rd International Conference on Music Information Retrieval (ISMIR), pages 170-177, 2002.
- [Firan et al., 2007] Claudiu S. Firan, Wolfgang Nejdl, and Raluca Paiu. The benefit of using tag-based profiles. In Proceedings of the Latin American Web Conference, pages 32-41, 2007.
- [Flexer et al., 2010] Arthur Flexer, Martin Gasser, and Do- minik Schnitzer. Limitations of interactive music recom- mendation based on audio content. In Proceedings of the 5th Audio Mostly Conference: A Conference on Interac- tion with Sound, pages 13:1-13:7. ACM Press, 2010.
- [Horsburgh et al., 2011] Ben Horsburgh, Susan Craw, Stew- art Massie, and Robin Boswell. Finding the hidden gems: Recommending untagged music. In Proceedings of the 22nd International Joint Conference in Artificial Intelli- gence, pages 2256-2261. AAAI Press, 2011. IJCAI
- [Horsburgh et al., 2012] Ben Horsburgh, Susan Craw, and Stewart Massie. Music-inspired texture representation. In Proceedings of the 26th AAAI Conference on Artificial In- telligence, pages 52-58. AAAI Press, 2012.
- [Horsburgh et al., 2015] Ben Horsburgh, Susan Craw, and Stewart Massie. Learning pseudo-tags to augment sparse tagging in hybrid music recommender systems. Artificial Intelligence, 219:25-39, 2015.
- [Horsburgh, 2013] Ben Horsburgh. Integrating con- tent and semantic representations for music recom- mendation. PhD thesis, Robert Gordon University, http://hdl.handle.net/10059/859, 2013. Link
- [Jawaheer et al., 2010] Gawesh Jawaheer, Martin Szomszor, and Patty Kostkova. Comparison of implicit and explicit feedback from an online music recommendation service. In Proceedings of the 1st International Workshop on In- formation Heterogeneity and Fusion in Recommender Sys- tems, pages 47-51. ACM Press, 2010.
- [Koenigstein et al., 2011] Noam Koenigstein, Gideon Dror, and Yehuda Koren. Yahoo! music recommendations: mod- eling music ratings with temporal dynamics and item tax- onomy. In Proceedings of the 5th ACM conference on Rec- ommender systems, pages 165-172. ACM Press, 2011.
- [McFee et al., 2012] Brian McFee, Thierry Bertin-Mahieux, Daniel P.W. Ellis, and Gert R.G. Lanckriet. The million song dataset challenge. In Proceedings of the 21st Interna- tional Conference Companion on World Wide Web, pages 909-916. ACM Press, 2012.
- [Mermelstein, 1976] Paul Mermelstein. Distance measures for speech recognition, psychological and instrumental. Pattern Recognition and Artificial Intelligence, 116:91- 103, 1976.
- MSD, nd] The Million Song Dataset. http://labrosa.ee. columbia.edu/millionsong. Link
- [Parra and Amatriain, 2011] Denis Parra and Xavier Amatri- ain. Walk the talk: Analyzing the relation between im- plicit and explicit feedback for preference elicitation. In Proceedings of the 19th International Conference on User Modeling, Adaptation, and Personalization, LNCS 6787, pages 255-268. Springer, 2011.
- [Stevens et al., 1937] S.S. Stevens, J. Volkmann, and E.B. Newman. A scale for the measurement of the psycholog- ical magnitude pitch. Journal of the Acoustical Society of America, 8:185-190, 1937.
- [Su et al., 2010] Ja-Hwung Su, Hsin-Ho Yeh, Philip S. Yu, and Vincent S. Tseng. Music recommendation using con- tent and context information mining. IEEE Intelligent Sys- tems, 25(1):16-26, 2010.
- Vamp, nd] Audio analysis plugin system. http://www. vamp-plugins.org/download.html. Link
References were extracted automatically from the PDF and may contain errors.
Full text extracted automatically from the PDF; figures, tables and equations may differ. The PDF is the version of record.
1 Introduction
Millions of people use online music recommendation services every day, giving them access to vast amounts of music. To allow users to discover niche music, recommender systems should not ignore the 'long tail' of less popular tracks that exists in any large music collection. One key component of music recommendation research is evaluating recommendation quality, through a user study or system-centric evaluation [Celma, 2010]. A user evaluation is often preferable, where users engage with a live recommender system and the experiment is tailored to collect relevant information; [Firan et al., 2007] is an example. However, many researchers do not have the luxury of a realistic user study because there is limited opportunity to embed a trial recommender in a real system, there are restrictions on the use of music audio files, and it is difficult to simulate normal user music browsing in an experiment. Therefore, full user evaluations are often impractical, and instead, systems are evaluated using system-centric approaches that rely on pre-existing data for the opinions of listeners, rather than asking users for new ratings.
The challenge with offline evaluations is finding suitable data and measures to score recommendation quality. For text mining and image retrieval, user data is standardised and available, but for music this is not the case. The Million Song Dataset [MSD, nd; Bertin-Mahieux et al., 2011] is a step in the right direction, but provides audio data as pre-extracted features, and so cannot be used to evaluate recommenders based on other audio features. User data is often gathered as implicit/explicit feedback from listening logs, playlists or past ratings, and there is likely to be less data for less popular tracks. This popularity bias affects the evaluation of the quality of recommendations that are new/niche tracks, unless the way the data is used avoids this influence of popularity.
This paper explores system-centric evaluation based on user data from social media sites relevant to music. Section 2 sets the scene with related work in evaluation, and Section 3 introduces the music recommendation systems that we evaluate in later sections. An evaluation measure socialSim, that utilises both implicit listening data and explicit feedback from a large set of social media user data for music, is introduced in Section 4. This system-centric approach is used in Section 5 to compare the recommendation quality of the music recommenders from Section 3, and Section 6 describes a complementary user study that measures both recommendation quality and novelty with real users. Finally, Section 7 explores socialSim as a proxy for the real user study by comparing results with three other system-centric approaches.
2 RelatedWork
System-centric evaluations attempt to indicate the results of a user study by using existing user ratings and listening data. Listening data is implicit feedback for recommendation, when choosing to listen to a track indicates a good recommendation, but can introduce noise, when listening does not coincide with liking [Parra and Amatriain, 2011]. Rating a track is explicit feedback, but provides less data. It is more reliable but can still be noisy, when opinions change over time [Amatriain et al., 2009a; 2009b]. Jawaheer et al. [2010] examine how user data can be used more effectively, by considering both implicit and explicit feedback, and highlight the need for evaluation strategies that combine both.
A popular system-centric approach obtains logs of what individual users like, removes n tracks, and measures how accurately these held-out tracks are recommended [Breese et al., 1998]. This approach has been followed for user data from Amazon [Su et al., 2010], Yahoo! [Koenigstein et al., 2011], The Echo Nest's Taste Profile [McFee et al., 2012] and Last.fm [Bu et al., 2010]. These datasets are unlikely to recognise quality in recommendations of less popular tracks because they all suffer from a popularity bias where more user data is available for popular tracks.
Evaluation methods can be based on data from groups of users, rather than individuals, to find similarities amongst all users and tracks. Eck et al. [2007] create user listening frequency vectors for each track and use a TF-IDF weighting to reduce the influence of popular tracks and most active users. The weighting allows novel recommendations to be considered more fairly, but at the cost of down-playing the relationships between popular tracks. Ellis et al. [2002] propose a peer-to-peer cultural similarity score S, based on implicit feedback from the co-occurrence of artists in user profiles:
where C(a) is the number of users with artist a in their playlist, C(a, b) with both artists a and b, and A is all artists. The second weighting term is a popularity cost that weakens the relationships of artists when their popularities differ greatly. Although this introduces a structured way of handling popularity bias, the specific cost function nevertheless penalises comparisons between niche and popular artists.
3 Music Recommendation Systems
This section describes the data and recommenders used in this paper. Our music collection is Horsburgh's [2013] dataset containing 3174 audio tracks by 764 separate artists. The average number of tracks per artist is 4, and the most common artist has 78 tracks. The tracks fall into 11 distinct genres: Alternative (29%), Pop (25%), Rock (21%), R&B (11%); and Dance, Metal, Folk, Rap, Easy Listening, Country and Classical make up the remaining 14% of the collection.
Music tracks often have tag annotations on music services, and tags can provide useful meta-data for recommendation, although they may not be available for all tracks. Last.fm's API (www.last.fm/api) was used to retrieve tags for each track in the collection. A total of 5160 unique tags were collected. On average each track has only 34 tags assigned to it, and the standard deviation is 26.4. The most-tagged track has 99 tags, and 94 tracks (3% of the collection) have no tags. The API also provides tag frequencies for a track. These are normalised as percentages of the track's most frequent tag.
We now describe four query-by-track recommender systems used in evaluations. For each recommender, retrieval is the standard vector cosine similarity, and the different recommenders are defined by their vector representation model.
Tag recommender is based entirely on tag annotations. A track's tag vector t = < t1, t2, . . . , tm > contains tag frequencies ti for this track, and m is the size of the tag vocabulary. We use Last.fm's tag frequencies and m = 5160.
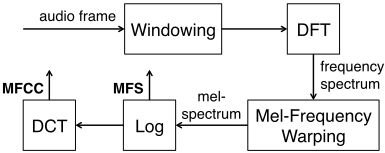
Audio recommender uses only the music content to build texture vectors, one of the most powerful audio representations for music recommendation [Celma, 2010]. Audio uses MFS Mel-Frequency Spectrum texture [Horsburgh et al., 2012], a musical adaptation of the well-known MFCC [Mermelstein, 1976]. MFS is available as a Vamp [nd] plugin. Figure 1 illustrates transforming an audio track into its MFS vectors, but also includes MFCC's additional DCT (Discrete Cosine Transfer) step. To build MFS vectors, we use the parameters preferred in [Horsburgh et al., 2012]. A track's audio waveform, encoded at 44.1kHz, is split into windows of length 186ms, and each is converted into the frequency domain, with maximum frequency 22.05kHz and bin resolution 5.4Hz, using Discrete Fourier Transform (DFT). Each window is discretised into a 40-dimensional MFS vector, based on the mel-scale [Stevens et al., 1937]. We compute the mean MFS vector for each track, construct a track-feature matrix for the collection, and use Latent Semantic Indexing to discover musical texture concepts. This MFS-LSI vector is the Audio representation.
Pseudo-Tag recommender is the first of two hybrids that are designed to overcome the problem of sparse tagging; e.g. only 54% of tracks in Last.fm's contribution to MSD [nd] have tags. Pseudo-Tag uses a tag-based representation but the tag frequencies are learned from tags for tracks that have similar audio content. We use the approach developed by Horsburgh et al. [2015]. A k-NN nearest-neighbour retrieval using cosine similarity in the MFS-LSI space identifies the K = 40 most similar audio tracks. The tag vectors for these K retrieved tracks t(1) ... t(K) are combined using a rankbased weighting to create the pseudo-tag vector p1 :
Hybrid recommender merges a track's learned pseudotags p with its tags t. We adopt the empirical results of Horsburgh et al. [2015] for this dataset. We first select the number of pseudo-tags P from p to be included in the hybrid vector h, to balance the number of existing tags T in t. A weighting α determines the influence of selected pseudo-tags ˜ p on h1 .
Pseudo-Tag is a variant of Hybrid, where the weighting α is 1 and all pseudo-tags are used.
1 All tag-based vectors t, t(k), p, ˜ p, and h are routinely normalised as unit vectors before use. For clarity, normalisation has been omitted from the equations defining p and h.
4 Social Media Quality Score
Recommendation quality should reflect the opinions of listeners, and the recommendation score we describe is designed to mimic a user evaluation, which asks a user if they like the recommendation for a query track.
4.1 The socialSim Score
The quality Q of a recommendation r for query q is estimated by the likelihood that the recommendation will be liked. It is tempting to use conditional probability since q is likely to have been 'liked' when it is used as a query. The probabilities can be estimated from social media frequencies:
where LIKES(t) is true if someone likes track t, likers(q, r) is the number of people who like both q and r, and likers(q) is number who like q. However, this does not take account of the fact that liking a track is dependent on having listened to it. If only a few people in the dataset have listened to q, then even fewer can have liked q, or both q and r. So the number liking r has little effect! Thus the data provides poor estimates of probability. Instead, we define socialSim to correspond to the proportion of people who have listened to both tracks, that like them:
where listeners(q, r) is the number who have listened to both q and r. The socialSim score is based on the strength of the social media association between liking and listening to the tracks as introduced in [Horsburgh et al., 2011].
The socialSim score overcomes the popularity bias common in evaluation measures. It respects the notion that likers are a subset of listeners of tracks, by capturing relative liking to listening. Importantly, for new or niche tracks, the estimated listeners will be low, and only a small number of likers is sufficient to achieve a high score.
If tracks are listened to often, then a large number of people must also like them to give a high socialSim score. A score of 1 means that everyone who listened to the query recommendation pair also liked them; strongest evidence of an excellent recommendation. If socialSim is 0, then there is no evidence of anyone liking them.
Although socialSim has lost the natural asymmetry of a recommendation, from q to r, the importance of this is doubtful. Are pairs of well-liked tracks not often good recommendations for each other?
4.2 Last.fmVersion of socialSim
Last.fm is used by millions of users, and their interactions are made available by the Last.fm API. For each track, the total number of listeners and play counts are available. For each user, the last 50 tracks that she has 'loved' are also available. This is explicit feedback for these tracks. It is not feasible to extract data for all Last.fm users, but the top fans for a track can be identified. The list of friends of any user is also available, so iteratively gathering fans' friends identifies a group of users whose tastes are likely to be similar, and representative for the tracks. This crawl provides user-track information including the number of listeners for each track and explicit feedback of which tracks each of the users 'loved'.
The Last.fm 'loved' data enables likers(q, r) to be calculated, but it does not contain similar data for listening, so listeners(q, r) in Eq. 2 is estimated from listeners(t) listening data for a track t:
where |Last.fm| is the number of all Last.fm users and |Users| is the number in the 'fans & friends' group. This estimate relies on two approximations. (i) Listening to track r is independent of listening to q; i.e. the proportion listening to both tracks is the product of the proportions listening to each. If the tracks are indeed related then this approximation underestimates listeners. (ii) The Users group has similar listening habits to Last.fm users in general; i.e. the number of Users listening to a track is the same proportion as for all Last.fm users. If data for 'fans & friends' of many tracks is used then the 'fans & friends' group should be quite representative of Last.fm users in general.
4.3 Last.fm socialSimData
Last.fm listening data were extracted for the approximately 5 million track pairs in our music collection. By collecting each track's top fans and iteratively gathering each fan's friends, 175,000 users were identified. Explicit feedback data was gathered from their 'loved' tracks. Each day, each user's last 50 'loved' tracks were identified. For some, these 50 tracks never changed, and for others they changed every day. After 2 months, 'loved' data was available for every track in the collection. On average, a user had 'loved' 5.4 tracks.
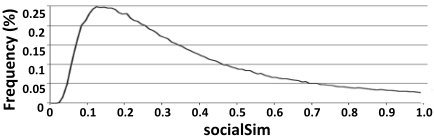
For our music collection, the Last.fm socialSim data includes 87% of pairs with a value zero for socialSim. Figure 2 shows the frequency distribution as a percentage of all pairs for the 10% of pairs with values between 0 and 1. This distribution centres around the score 0.12 accounting for 0.25% of all track pairs. Any socialSim score exceeding 1, where more people like tracks than have listened to them (!), is caused by underestimation in the independence approximation (i). Raw scores of 1+ were reduced to 1. Although this makes the frequency of a score of one artificially high, it is still only 3% of all scores, and across all track pairs the average score is 0.0064. Therefore there is good discrimination across high and low quality recommendations, and a large percentage of pairs with no evidence of recommendation quality.
5 System-Centric Evaluation
This evaluation uses the socialSim score based on Last.fm data to measure the recommendation quality of the Tag, Audio, Pseudo-Tag and Hybrid recommenders for the music collection, all described in Section 3. It is important to note that no recommender uses the likes/listens data for users/tracks from Last.fm that underpins socialSim.
We use a Quality@N average score over the top N recommendations for query q:
where score is the quality score, in this case socialSim, and rn is the nth recommendation for q. The graphs in Figure 3 show the Quality@N score averaged over all query tracks in the collection, for N = 1..5, for each recommender. Error bars indicate 95% confidence.
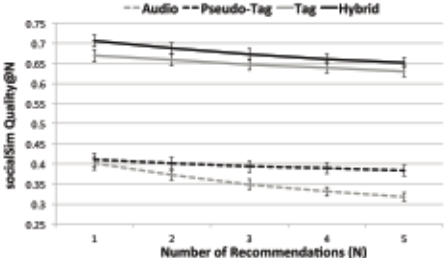
The socialSim evaluation suggests that Tag recommender (solid grey line) is a very strong recommender compared to the content-based Audio recommender (dotted grey line). The Pseudo-Tag recommender (black dotted line) is better than Audio. It has gained useful tag knowledge from its audio content neighbours. When selected pseudo-tags are dynamically combined with existing tags in Hybrid (solid black line), this recommender outperforms the others, with a small improvement over Tag.
6 User Study
This study tests recommendation quality and novelty with real users as a benchmark to validate the socialSim evaluation above. The Tag, Pseudo-Tag and Hybrid recommenders from the system-centric evaluation are included, but Audio is omitted because its recommendations in Figure 3 are so poor.
6.1 Design of User Study
The user is shown a query track, and a list of the top 5 recommended tracks from a single recommendation method. The recommender is chosen randomly, the recommendation order is randomised, and the query track is selected at random from a fixed pool or the entire collection, with 50% chance. The pool contains 3 randomly selected tracks for each of the 11
genres in the collection. Pool tracks will be repeated more frequently, whereas the other tracks are likely to be used at most once. Users evaluate as many queries as they choose, without repetition, and if the pool is exhausted that user is given any of the remaining tracks as queries.
Each track is presented as its title, artist, and a play button that allows the user to listen to a 30 second mid-track sample. Users provide feedback on the quality of each recommendation by moving a slider on a scale from very bad (0) to very good (1). Each slider is positioned midway initially.
To capture feedback on the novelty of each track, the user also selects from 3 options: "Know Artist and Track", "Know Artist but not Track", or "Do not know Artist or Track".
6.2 User Participation
A web-based study was available for 30 days. Its URL was distributed through Facebook and Twitter, and a total of 132 people took part in the study, evaluating 1444 queries. Queries where all 5 recommendations scored 0.5 (slider not moved) were discarded. The remaining 1058 queries provide explicit user feedback on recommendations. On average users evaluated recommendations for 6.24 valid queries. The most active user evaluated recommendations for 29 queries.
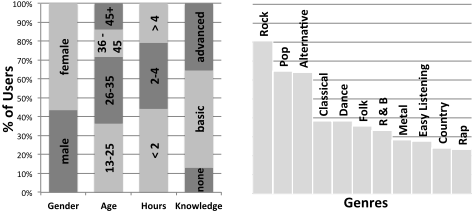
Users completed a questionnaire prior to providing feedback. Figure 4 shows the breakdown according to gender, age, daily listening hours, and musical knowledge (none for no particular interest in music related topics; basic for lessons at school, reads music magazine/blogs, etc.; advanced for play instrument, edit music on computer, professional musician, audio engineer, etc.). It also shows genres they typically listen to, and users may select several genres. There is a good spread across age and gender, and the musical interests align well with the tracks in the pool and collection overall.
6.3 User Study Results
Figure 5 shows the recommendation quality results from the user study. The user study score for a query-recommendation pair q, r is averaged over the users U who evaluated the pair:
where scoreu is the score of user u. The user study's Quality@N score is now averaged across all queries in the pool. The larger error bars (still 95% confidence) indicate greater variability, but this may not be surprising since the results are based on a smaller number of users and queries, and each user provides feedback on only a subset of queries.
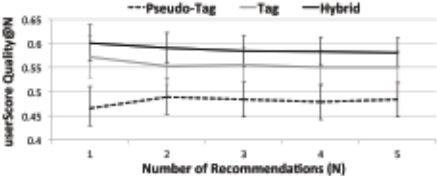
The ordering of the recommenders is the same as with socialSim in Figure 3, and the relative spacings are similar. The significantly reduced gap, between Pseudo-Tag and Tag in the user study, may well be caused by less pessimistic ratings being used, when users respond to real queries. The placing of the Hybrid and Tag graphs is slightly lower than with socialSim, and the Pseudo-Tag graph is higher. However, actual values are not really comparable since userScore is unlikely to generate 0 or 1 (all users scoring 0 or 1 for the recommendations for a query), whereas socialSim gives 0 for 87% of query-recommendation pairs, and the number of 1 scores (3%) was noted as artificially high. The userScore Quality@N drops more slowly as N increases, so later recommendations did not dilute the quality of earlier ones. Since a user rated all 5 recommendations at once, perhaps less variation within a set of recommendations is natural.
6.4 Quality with Serendipity
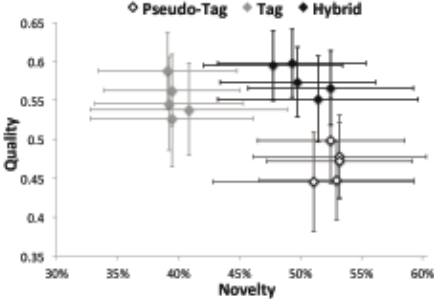
Recommendation quality is important, but recommenders should not recommend only tracks that are already known to users. The user study also takes account of novelty by noting when unknown recommendations are made. Figure 6 captures the trade-off between recommendation quality and novelty. Good recommenders combining quality and novelty are towards the top right. Good quality recommenders are higher, and those suggesting more, unknown tracks are further right. In each cluster for Hybrid (black), Tag (grey) and Pseudo-Tag (white), the individual points show the average % unknown and Quality@N for different N = 1..5, where the N = 1 point is uppermost, with larger Ns being increasingly lower.
The location and spread of these clusters demonstrate the trade-off between quality and novelty. Hybrid achieves quality recommendations and has ability suggesting unknown tracks. It recommends unknown tracks 50% of the time. Although Tag has comparable quality it is significantly poorer for novel recommendations. Only 40% of its recommendations are unknown. Hybrid and Pseudo-Tag are comparable for novelty but Hybrid gives significantly better quality recommendations, and quality is paramount. Therefore, it is important that the socialSim evaluation has not been affected by a popularity bias that would downplay quality in novel recommendations, and so penalise recommendations by Hybrid.
7 Comparison of System-Centric Evaluations
The results in the system-centric and user evaluations in Figures 3 & 5 indicate that socialSim appears to be a good proxy for the user study. This section investigates in more detail how predictive socialSim is of user trial results compared to three other offline methods. Many system-centric evaluations use a proxy for user opinions such as the classification accuracy of artists, genre, mood or year [Flexer et al., 2010; Bertin-Mahieux et al., 2011], so this comparison includes two popular classification-based proxies. The third method, based on Ellis et al.'s [2002] cultural similarity, uses the same Last.fm user data as socialSim.
genreScore applies genre classification to judge quality:
yearScore uses closeness of release year, where year(t) is t's release year, and τ is all tracks:
culturalSim is an adaptation of Eq. 1 using Section 4.3's Last.fm user data rather than artists in playlists:
7.1 Ranking Recommenders
Figure 7 shows the Quality@5 results for userScore and the four offline methods applied to the three recommenders in the user study: Hybrid (dark grey), Tag (grey) and Pseudo-Tag (light grey). The Quality@5 results are averaged across all user study queries whose recommendations have been evaluated by 3 or more users; i.e. |U| ≥ 3 in Eq. 3. As a result, the Quality@5 values are different from those in Figures 3 & 5.
SocialSim is the only system-centric evaluation that correctly predicts the ordering of recommendation quality from the user study as Hybrid > Tag > Pseudo-Tag. The other proxies correctly predict that Hybrid and Tag outperform Pseudo-Tag, but in each case they wrongly predict that Tag also outperforms Hybrid. The apparent Tag advantage from culturalSim and genreScore is quite marked. If used for evaluation, this mis-prediction could have significant implications, given the dominance of Hybrid in Figure 6.
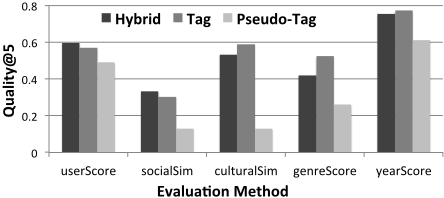
Both culturalSim and socialSim employ the same user data from Last.fm. However, culturalSim has hugely underestimated the performance of Pseudo-Tag. Its second term is designed to act as a weighting to reduce the effect of the popularity bias, but it nevertheless penalises recommendations of a niche track from a popular query. The user study's Figure 6 shows that this bias will particularly compromise the evaluation of Pseudo-Tag's quality because of Pseudo-Tag's high recommendation novelty. The socialSim score uses a different sort of weighting based on listening data, and so avoids always penalising niche recommendations.
7.2 Correlation with User Study
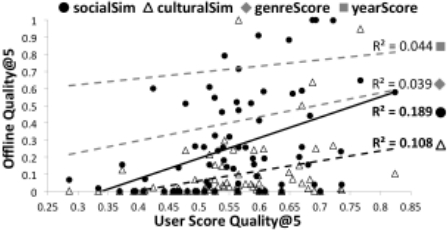
The goal of a system-centric evaluation is not to accurately predict user ratings, but to indicate how users will respond to recommendations. The score used in offline methods does not need to reflect the user score accurately, but should show the same correlation for recommendations. To gain further insight into how each of these methods correlates with the user evaluation, Figure 8 shows the Quality@5 scatter plot of user study scores (horizontal axis) with offline scores (vertical axis). For clarity, the culturalSim values are scaled up so that the largest value matches the other offline scores. To simplify the chart, only data points for socialSim (·) and culturalSim (△) are shown. The other 2 classification proxies are less consistent with the user study.
The lines-of-best-fit through each set of data points are shown for socialSim (solid) and culturalSim (black dotted). The grey dotted lines are for genreScore and yearScore. The R2 coefficient of determination is noted beside each line and provides further insight into how well each offline method predicts the user study results. Higher R2 values indicate closer correlation with userScore, and 1 is a perfect fit. The socialSimmethod is the best fit to user feedback (0.189). The reduced correlation for culturalSim (0.108) is in part due to bad outliers in the scatter, but note the scaling of culturalSim values does not affect R2 . This limited correlation with userScore detracts from culturalSim's ability to predict user study results. The very small R2 values for genreScore and yearScore (∼0.04) indicate very little correlation with user- Score. This should not be unexpected. Even when averaged over 5 recommendations, approximately 50% of queries have a genreScore of either 0 or 1. The opposite is observed with yearScore, where the scatter distribution is flat. Neither genre nor year proxy is predictive of a user trial's results.
8 Conclusions
A successful system-centric evaluation method for music recommendation has been developed. A large number of relevant users are identified in social media and their implicit/explicit feedback is captured while they naturally navigate and listen to music. This listening scenario for user data capture is very realistic, and so the feedback is more representative than many structured user trials.
The developed socialScore approach overcomes the popularity bias, common in many system-centric evaluations for music, by weighting rating data with listening data. Its assessment of recommendation quality therefore does not jeopardise recommendations of new/niche music from the 'long tail' by underestimating their quality.
An online user trial captures explicit feedback from real users and confirms the findings of the social media systemcentric evaluation. The recommender with highest quality recommendations also injects novel tracks, and so its recommendations are likely to be of interest. Importantly, evaluation must not disadvantage niche recommendations.
Comparative experiments with three other evaluation measures show the social media score to be the only method to give the same relative performances of the recommenders as the user study. Social media values are better aligned to the scoring by real users in real music recommendation scenarios, and so it is a more reliable proxy for scoring by real users.
Social media evaluation opens up opportunities to investigate new recommenders that use hybrid representations to bridge the semantic gap between content and tags. Such methods would have been infeasible without extensive user studies, since other system-centric methods do not accurately indicate quality, particularly in the music recommendation 'long tail'. It is important that recommenders balance quality with novelty, and even more important that system-centric evaluation recognises quality in niche recommendations.
This paper focuses on music recommenders, but social media could also be used to avoid expensive user trials for other recommenders such as images/video, products, and travel.
@inproceedings{ijcai2015p249,
  title     = {Music Recommenders: User Evaluation Without Real Users?},
  author    = {Craw, Susan and Horsburgh, Ben and Massie, Stewart},
  booktitle = {Proceedings of the Twenty-Fourth International Joint Conference on
               Artificial Intelligence, {IJCAI-15}},
  publisher = {International Joint Conferences on Artificial Intelligence},
  editor    = {Qiang Yang and Michael Wooldridge},
  pages     = {1749--1754},
  year      = {2015},
  month     = {7},
  note      = {Main Track},
  url       = {https://ijcai.org/proceedings/2015/249},
}
TY - CPAPER TI - Music Recommenders: User Evaluation Without Real Users? AU - Craw, Susan AU - Horsburgh, Ben AU - Massie, Stewart T2 - Proceedings of the Twenty-Fourth International Joint Conference on Artificial Intelligence, IJCAI-15 PB - International Joint Conferences on Artificial Intelligence PY - 2015 SP - 1749 EP - 1754 UR - https://ijcai.org/proceedings/2015/249 ER -Copied
Machine-readable versions of this paper, for tools and AI agents:





