
Forecast Oriented Classification of Spatio-Temporal Extreme Events
Proceedings of the Twenty-Third International Joint Conference on Artificial Intelligence. Pages 2952-2953.
© 2013 International Joint Conferences on Artificial Intelligence
Abstract
In complex dynamic systems, accurate forecasting of extreme events, such as hurricanes, is a highly underdetermined, yet very important sustainability problem. While physics-based models deserve their own merits, they often provide unreliable predictions for variables highly related to extreme events. In this paper, we propose a new supervised machine learning problem, which we call a forecast oriented classification of spatiotemporal extreme events. We formulate three important real-world extreme event classification tasks, including seasonal forecasting of (a) tropical cyclones in Northern Hemisphere, (b) hurricanes and landfalling hurricanes in North Atlantic, and (c) North African rainfall. Corresponding predictor and predict and data sets are constructed. These data present unique characteristics and challenges that could potentially motivate future Artificial Intelligent and Data Mining research.
- [Bellman, 1961] R. E. Bellman. Adaptive control processes: a guided tour. A Rand Corporation Research Study Series. Princeton University Press, 1961.
- [Chen et al., 2011] Z. Chen, T. Pansombut, and et al. Fore- caster: Forecast oriented feature elimination-based classifica- tion of adverse spatio-temporal extremes. NCSU Technical Report:1840.2/2408, 2011.
- [Chen et al., 2012] Z. Chen, W. Hendrix, and et al. Discovery of extreme events-related communities in contrasting groups of physical system networks. Data Mining and Knowledge Dis- covery, 2012.
- [Chen et al., 2013] Z. Chen, J. Jenkins, and et al. Automatic detec- tion and correction of multi-class classification errors using system whole-part relationships. SDM, 2013.
- [Chu et al., 2007] P. S. Chu, X. Zhao, and et al. Climate prediction of tropical cyclone activity in the vicinity of Taiwan using the multivariate least absolute deviation regression method. Terr. Atmos. Ocean. Sci., 18(4):805-825, October 2007.
- [Jolliffe and Stephenson, 2003] I. T. Jolliffe and D. B. Stephenson. Forecast Verification: A Practitioner's Guide in Atmospheric Science. Wiley and Sons, 2003.
- [Molesworth et al., 2003] A. M. Molesworth, L. E. Cuevas, and et al. Environmental risk and meningitis epidemics in Africa. EID, 9(10):1287-1293, 2003.
- [Schiermeier, 2010] Q. Schiermeier. The real holes in climate sci- ence. Nature, 463:284-287, 2010.
References were extracted automatically from the PDF and may contain errors.
Full text extracted automatically from the PDF; figures, tables and equations may differ. The PDF is the version of record.
1 Introduction
Accurate forecasting of extreme events, such as hurricanes, droughts and earthquakes, is a paramount priority for our society. Their adverse nature can change the landscape of society by triggering abrupt changes in the landscape around them, defined by their catastrophic characteristics. For example, in Western Africa, periods of very low relative humidity often coincide with higher incidences of meningitis epidemics that affects more than 200,000 people throughout the African Sahel region annually [Molesworth et al., 2003]. Our ability to predict the occurrence of such events-ahead-oftime, with the lead-time of days, weeks, and even monthscould translate to taking preventive measures to eliminate or reduce the severity of the event.
Fortunately, the occurrences of extreme events are relatively rare. For example, only 92 hurricanes of great destructive magnitude have been reported to strike the United States from 1851-2004. While the rarity of occurrence of these extreme events is a blessing in the real sense, it is a curse from a statistical machine learning perspective, given the lack of an appropriate number of observational events to build models upon. This issue becomes worse if the characteristics of these events come into consideration, as these events can occur in different locations and during different times of the year. Thus, considering the fact of having only a handful of available observational events (m ≈ 100's) in high-dimensional spaces (n ≈ 10, 000's), the existing machine learning methods easily become hardly suitable for dealing with such underdetermined, or unconstrained, problems (m << n).
Presently, physics-based models and simulations from first-principles have been making relatively reliable predictions at global spatial scale for ancillary variables, such as climatological factors including Sea Surface Temperature, humidity profiles over land, or wind speed at different heights. However, they provide least reliable predictions for variables that are crucial for impact assessment for adverse extreme events including regional precipitation, hurricane intensity and frequency, droughts and floods. In fact, "The sad truth of climate science is that the most crucial information is the least reliable" [Schiermeier, 2010].
While physics-based approaches deserve their own merits, in this paper, we draw readers' attention to a different, yet complementary, supervised machine learning problem. Namely, given a historic record about rarely occurring spatiotemporal extreme events of interest, can an algorithm learn the complex linear and non-linear relationships between system parameters and the event's response variable, so that the algorithm can predict what phase the system will likely transition to in some future time and in some spatial region, given the knowledge about the system's parameters defined over global spatial scales before the event's occurrence? We call this problem a forecast oriented classification of spatiotemporal extreme events.
We successfully model three real-world extreme event prediction tasks-seasonal extreme event forecasts of Northern Hemisphere tropical cyclone counts, North Atlantic landfalling hurricane counts, and Sahel rainfall intensity-as forecast oriented classification of spatio-temporal extreme events problems. And we construct corresponding predictor and predictand datasets and analyze their unique characteristics and challenges.
2 ProblemFormulation
Three real-world extreme event prediction tasks are considered as motivating examples in this paper:
- Seasonal tropical cyclone prediction: The first task is to forecast the seasonal tropical cyclone (TC) count in some spatial regions including North Atlantic, North Pacific, and Northern Indian. TC includes hurricanes, tropical storms, typhoons, and cyclones.
- Seasonal hurricane prediction: The second task is to forecast the seasonal hurricane count, with emphasis on landfall hurricanes. Hurricanes consists of the landfall hurricanes and the offshore hurricanes. Hurricanes lead to major natural disasters in the regions of landfall.
- North Africa rainfall prediction: The third task is to forecast the seasonal rainfall in North Africa, especially, in the Sahel area, which is highly related to meningitis epidemics that affects more than 200,000 people throughout the African Sahel region annually.
We model each of these extreme event forecasting tasks as a forecast oriented, multi-class classification problem.
Formally, assume that the multi-phase system during the extreme event e = (C, Tf , Le) can be characterized by one of its phases, C ∈ {C1,C2, . . . ,Cs} at some future time period Tf and in some event's spatial location region Le. Can the algorithm A predict C given the spatio-temporal multivariate feature set F over space L ⊇ Le and time T = (Tf -ΔT, Tf )? Note that the temporal resolution, ΔT , is domain-specific (e.g., 1-5 months for hurricanes). For the sake of simplicity, we assume that the number s of distinct system's phases/states is finite. For example, the seasonal hurricane activity can be broadly categorized as "above normal" (say, more than six hurricanes in a season), "normal," or "below normal" (say, less than four hurricanes in a season) during hurricane season Tf = {July-November} in region Le = {North America} [Chu et al., 2007]. We call this problem a forecast-oriented classification of spatio-temporal extreme events or FORECAST for short.
The intent of our problem is not to predict an actual numerical magnitude of the response, instead to seek proper classification into unambiguous groupings that provide enough information to make proper decisions, as many regression models are ultimately being translated into such coarser scales [Chu et al., 2007] for impact assessment. Thus, in this paper, all observed extreme event count series are classified into three classes with a distribution of 40% as "normal" and 30% each as "below normal" and "above normal."
The FORECAST problem is different from traditional classification machine learning problem, since FORECAST aims to forecast the future phase of the system given its characteristics prior to the time-frame of interest unlike existing classification problem that predicts what phase the system currently belongs to, given its current characteristics.
3 Data Construction and Challenges
3.1 Data
We construct seasonal tropical cyclone (TC) count series from 1950 to 2011 of three main regions of Northern Hemisphere: North Atlantic, North Pacific, and Northern Indian. These series are obtained from Atlantic hurricane database (HURDAT) at the National Climatic Data Center, Central Weather Bureau [Chu et al., 2007], and JTWC Northern Indian Ocean best track data. These datasets include hurricanes, tropical storms, typhoons, and cyclones that occurred from July through November in the North Atlantic basin, North Pacific basin, and Bengal and Arabian Sea basins. The landfall hurricanes that strike land are distinguished by using the "Hit" feature of the HURDAT. Likewise, hurricanes that made landfall in Mexico are also considered as landfall hurricanes in our analysis. Sahel rainfall indices from 1951-2004 are obtained by averaging seasonal (July through September) mean Precipitation data over (10-20◦N, 20W20◦E). And monthly Precipitation data is obtained from the Climate Research Unit at a 0.5◦ ×0.5◦ latitude and longitude resolution for the 1951-2004 period.
The global monthly mean sea level pressure (SLP), precipitable water (PW), sea surface temperature (SST), tropospheric vertical wind shear (VWS), relative humidity (RH) and wind speed (WSPD) data from preceding January through June are used as predictors to forecast the North Atlantic, North Pacific, and Northern Indian TC and Sahel rainfall classes. SLP, PW, RH, and WSPD are NCEP/NCAR reanalysis datasets. They are available at a 2.5◦ × 2.5◦ latitude and longitude resolution. SST is from the NOAA Climate Diagnostic Center in Boulder, Colorado, at a resolution of 2◦ ×2◦ latitude and longitude. VWS is calculated by computing the square root of the sum of the square of the difference in zonal wind component between 850 and 200 hPa levels and the square of the difference in meridional wind component between 850 and 200 hPa levels from NCEP/NCAR reanalysis data. The six variables combined could contribute a total of 411,480 features. All datasets are available at CUCIS Center 1 of Northwestern University.
3.2 Mathematical Abstraction
In traditional supervised classification, a model is learned from a matrix representation of the original data with m rows corresponding to a set E of observations, or events, and n columns corresponding to a set F of features that characterize each event. In addition, a column vector associates each event with its class from a finite set C of available classes. Once learned, the model predicts what class the target event defined over the same features F belongs to.
Both the forecasting nature of our problem and the multivariate spatio-temporal nature of the data necessitate a mathematical abstraction that could transform this data into a mathematical form suitable for a machine learning task, in general, and forecast oriented classification, in particular.
Formally, let V be a set of variables (such as SST, SLP, and VWS) that characterize the system over spatial locations L, defined over spatial (latitude, longitude, altitude) grid points, and over time period T (e.g., 1950-2011). And suppose that each extreme event e can be classified based on some eventspecific classification taxonomy, C. In the context of the target extreme events, such as hurricanes or droughts, let us also assume that T = T1 ⋃ T2 ⋃ . . . ⋃ Tm, where Ti ⋂ Tj = ∅ and i ̸= j, is divided into m coarse-grain time intervals (e.g. m calendar years) during which an extreme event e can occur over some spatial region Le ⊆ L with some probability. Let us further assume that each time interval Tj ∈ T is partitioned into the fine- or coarse-grain observable Tj,o time period and the coarse-grain forecastable Tj,f time period (Tj = Tj,o ⋃ Tj,f and Tj,o = Ti,o, Tj,f = Ti,f , ∀i, j ∈ {1, 2, ..., m}).
1 http://cucis.ece.northwestern.edu/projects/Expeditions/
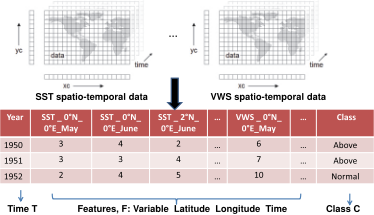
Fig. 1 illustrates a mathematical abstraction using SST and VWS as variables, or predictands, defined over T = (1950 - 1952) during the months of T∗,o = {May, June} over (latitude, longitude) spatial grid points for the sea-level altitude. The class label is inferred based on the historical record of observed hurricanes in North America during T∗,f = (July-November) hurricane season.
3.3 Challenges
Traditional machine learning methods would face a number of technical challenges due to the characteristics of multivariate, spatio-temporal data, "the curse of dimensionality", and inter-correlated features.
- Multivariate, spatio-temporal nature: The data in real world dynamic systems are often with multiple or even tens of spatio-temporal variables (e.g., SST, SPL, VWS etc.), which requires a methodology that could naturally support multi-variate spatio-temporal data, which, to the best of our knowledge, no existing classification methodologies are particularly designed for.
- The curse of dimensionality: Another difficulty is how to deal with the enormous number of features that could easily reach thousands or even hundreds of thousands. Such enormous feature space could easily lead to the problem, coined by Bellman as "the curse of dimensionality" [Bellman, 1961].
- Inter-correlated and non-linear relationships: It is often the case that a coordinated, not independent, action of several features determines what phase a given system is in. Complex dynamic systems often operate in multiple phases, described as having similar defining characteristics but whose feedbacks behave in nonlinear fashion. Such non-linear cooperative or competing interactions between the features often form hierarchical functional modules (e.g., communities) that act not only on different spatial and temporal scales but also in response to fluctuations induced by endogenous and exogenous factors.
3.4 Performance EvaluationMetrics
Several metrics can be used to evaluate FORECAST's performances: accuracy, Heidke Skill Score, Peirce Skill Score, and Gerrity Skill Score [Jolliffe and Stephenson, 2003]. Accuracy is defined as the ratio of the number of correctly classified data points to the total number of data points in the test set.
Some preliminary results of the three real-world extreme event prediction tasks can be found in our work [Chen et al., 2011; 2012; 2013].
4 Conclusion
In this paper, the spatio-temporal extreme event prediction problem has been modeled as a new supervised machine learning problem. We have constructed predictor and predictand data sets for three real-world extreme event prediction tasks including seasonal extreme event forecasts of Northern Hemisphere tropical cyclone counts, North Atlantic landfalling hurricane counts, and Sahel rainfall intensity. Many interesting directions to explore the multivariate spatiotemporal extreme event data include designing new feature selection technologies, building new ensemble of classifiers, mining spatio-temporal relationships, etc.
Acknowledgments
This work is supported in part by NSF awards CCF-0833131, CNS-0830927, IIS-0905205, CCF-0938000, CCF-1029166, and OCI-1144061; DOE awards DE-FG02-08ER25848, DE-SC0001283, DE-SC0005309, DESC0005340, and DESC0007456; AFOSR award FA9550-12-1-0458.
@inproceedings{ijcai2013p433,
  title     = {Forecast Oriented Classification of Spatio-Temporal Extreme Events},
  author    = {Chen, Zhengzhang and Xie, Yusheng and Cheng, Yu and Zhang, Kunpeng and Agrawal, Ankit and Liao, Wei-keng and Samatova, Nagiza F. and Choudhary, Alok N.},
  booktitle = {Proceedings of the Twenty-Third International Joint Conference on
               Artificial Intelligence, {IJCAI-13}},
  publisher = {AAAI Press / International Joint Conferences on Artificial Intelligence},
  editor    = {Francesca Rossi},
  pages     = {2952--2953},
  year      = {2013},
  month     = {8},
  url       = {https://ijcai.org/proceedings/2013/433},
}
TY - CPAPER TI - Forecast Oriented Classification of Spatio-Temporal Extreme Events AU - Chen, Zhengzhang AU - Xie, Yusheng AU - Cheng, Yu AU - Zhang, Kunpeng AU - Agrawal, Ankit AU - Liao, Wei-keng AU - Samatova, Nagiza F. AU - Choudhary, Alok N. T2 - Proceedings of the Twenty-Third International Joint Conference on Artificial Intelligence, IJCAI-13 PB - AAAI Press / International Joint Conferences on Artificial Intelligence PY - 2013 SP - 2952 EP - 2953 UR - https://ijcai.org/proceedings/2013/433 ER -Copied
Machine-readable versions of this paper, for tools and AI agents:





