
A System for Providing Differentiated QoS in Retail Banking
Proceedings of the Twenty-Second International Joint Conference on Artificial Intelligence. Pages 2494-2498.
https://doi.org/10.5591/978-1-57735-516-8/IJCAI11-415
© 2011 International Joint Conferences on Artificial Intelligence
Abstract
In today's services driven economic environment, it is imperative for organizations to provide better quality service experience to differentiate and grow their business. Customer satisfaction (C-SAT) is the key driver for retention and growth in Retail Banking. Wait time, the time spent by a customer at the branch before getting serviced, contributes significantly to C-SAT. Due to high footfall, it is improbable to improve the wait time of every customer walking in the branch. Therefore, banks in developing countries are strategically looking to segment its customers and services and offer differentiated QoS based service delivery. In this work, we present a system for customer segmentation, and scheduling based on historic value of the customer and characteristics of current service request. We describe the system and give mathematical formulation of the scheduling problem and the associated heuristics. We present results and experience of deployment of this solution in multiple branches of a leading bank in India.
- [Chafle et al., 2009] Girish Chafle, Sameep Mehta, and Gyana R. Parija. Towards pro- viding value based differentiated qos. In Services Computing Conference, 2009.
- [Garey and Johnson, 1979] Michael R. Garey and David S. Johnson. Computers and Intractability, A Guide to the Theory of NP-Completeness. W.H. Freeman and Com- pany, New York, 1979.
- [Garvin, 1988] David A. Garvin. Managing Quality. New York: The Free Press, 1988.
- [Karger et al., 2010] D. Karger, C. Stein, and Joel Wein. Scheduling algorithms. In Handbook of Algorithms and Theory of Computation. CRC Press, 2010.
- [Parasuraman et al., 1988] A Parasuraman, Valarie A. Zeithaml, and Leonard Berry. Servqual: A multiple item scale for measuring consumer perceptions of service qual- ity. Journal of Retailing, 64, 1988.
- [Parasuraman et al., 2005] A. Parasuraman, Valarie A. Zeithaml, and Arvind Malho- tra. E-s-qual: A multiple-item scale for assessing electronic service quality. Journal of Service Research, 7, 2005.
- [Perlich et al., 2007] Claudia Perlich, Saharon Rosset, Richard D.Lawrence, and Bianca Zadrozny. High-quantile modeling for customer wallet estimation and other applications. In Proceedings of the 13th ACM SIGKDD, 2007.
- [Porter, 1985] Michael E. Porter. Competitive advantage. The Free Press, 1985.
- Advanced Queue Management System. http://www.databyteindia.com/. Link
- Dynamic Queue Management System. http://www.intellvisions.com/products/opti- q.html. Link
- Queue Management System. http://www.rts.com.np/rtsweb/index.php?q=products/qms. [Q4, ] Lonsto Queue Management System: http://www.lonsto.co.uk/ . Link
- Q5, ] Automatic Queue Management System. http://www.qms-akis.com/. Link
- Q6, ] QTech Queueing System. http://www.qtechsg.com/standard.htm. Link
- Smart Queue Management System. http://www.batworld.com. Link
- [Ramaswamy and Banavar, 2008] Lakshmish Ramaswamy and Guruduth Banavar. A formal model of service delivery. In Services Computing Conference, 2008.
- [Sgall, 1998] Jiri Sgall. Online Algorithms: The State of the Art. LNCS, 1998.
- [Vazirani, 2001] Vijay Vazirani. Approximation Algorithms. Springer Publishers, 2001.
- [Zeithaml et al., 2006] V. A. Zeithaml, M. J. Bitner, and D. D. Gremler. Services Mar- keting. McGraw-Hill, 2006.
References were extracted automatically from the PDF and may contain errors.
Full text extracted automatically from the PDF; figures, tables and equations may differ. The PDF is the version of record.
1 Introduction
Retail banking is one of the industries that has C-SAT as the key driver to retain and grow the customer base and hence the business. Even though various alternate channels like ATM, Internet banking and mobile banking have evolved significantly in the last few years, the bank branch has still retained its position as the primary service delivery channel in the emerging economies. Due to various factors like literacy rate, lack of infrastructure, legacy of public sector banks, lack of trust in e-transactions, the customers still prefer to do most of their banking by visiting the branch. While the private banks in India have nearly 35 to 40% transactions through alternate channels, this figure is in single digits for the public sector banks where the vast majority of customers still bank.
During the engagement with the bank, FSS consultants in our organization observed that, wait time received the lowest score and contributed most significantly to C-SAT. In certain cases the wait time was found to be as high as 60 minutes!
∗The work was done while the author was at IBM Reseach India
In fact, the wait time was found to be more important than staff interaction, infrastructure, service time and information availability. Moreover, there are legal regulations (Law N6852 July 2005, Brazil) in some countries which limit the time a customer spends in waiting. Failure to comply can result in monetary penalties being imposed on the bank. The banks understand that given the high inflow of customers (footfall) it is improbable (if not impossible) to drastically reduce the wait time and improve C-SAT for each and every customer walking in the branch. A naive solution to the problem is to increase the service personnel at the branch and have dedicated counters for different types of transactions or services. However, this would lead to a substantial increase in the operating cost of the bank which makes it an inviable alternative. Therefore, strategically, banks are focusing their attention on customers and services 1 (e.g, deposit, withdrawal, funds transfer etc) which are more important to the bank and have direct implications to its bottom line. For example, customers with large net worth or transactions generating more revenue and profit. In essence, banks are segmenting its customers as well as services to make it attractive for important customers and customers coming for revenue generating transactions (like fund transfers). The customers and services in profitable segment would get differentiated QoS. This differentiation in turn would help the organization to realign their focus around important customers and services. For example, customers coming for cash withdrawl (a less priority service for banks) would be inclined to use ATM if they have to wait longer in queue. This interplay between differentiation and focus is a well accepted principle formally proposed by Porter in Value Chain Model [Porter, 1985].
The banks in developing countries are facing challenges due to absence of smart systems to reduce customer wait time. The solutions for queue management available in the market [Q1, ; Q2, ; Q3, ; Q4, ; Q5, ; Q6, ; Q7, ] typically work on First in First Out (FIFO) principle leading to suboptimal scheduling with respect to wait time and overall goal of differentiated quality of service. Chafle et. al. [Chafle et al., 2009] presented a generalized optimization model and framework for delivering differentiated QoS. In this paper, we extend this model in a Retail Banking scenario. We model the optimization problem as a real time scheduling problem and provide the associated heuristics. The incoming customers are segmented based on their historic networth as well as current transaction characteristics. We give the system overview and describe the working of an integrated solution. Our prototype system has been deployed in multiple branches of a leading retail bank in India. Due to confidentiality reasons, we cannot divulge the details. We demonstrate how our system fulfills the objectives by presenting results at an aggregate level and how it scores over existing methods and share some of our live deployment experiences. In summary, the key contributions of this paper:
1 We use the terms services and transactions interchangeably in rest of the paper
- We describe a complete system for differentiated QoS based service delivery in retail banking
- We give a detailed mathematical formulation of the scheduling problem and the associated heuristics. The scheduler forms the backbone of the overall system
- We present results, insights and customer survey based on the deployment at live customer environment.
2 Background and RelatedWork
There are a plethora of models in management literature for understanding and measuring service quality [Garvin, 1988; Parasuraman et al., 1988; 2005; Zeithaml et al., 2006]. However, there is very little work in the space of formal models for services. Recently, Ramaswamy and Banavar [Ramaswamy and Banavar, 2008] have proposed a model for service delivery system. The model is based on concepts of service operating system that manages the processes and resources within a service delivery system. The paper develops a formal model for these concepts with the goal of clearly and precisely describing behavior of service systems. This work is a good starting point but can not be used for building a differentiated QoS based service delivery system. Chafle et al. [Chafle et al., 2009] presented a generalized approach and an optimization based model for providing value based differentiated QoS for services. The model develops on the concept of value for the provider and certain exogenous factors. The value for the provider is captured by taking into account the 1) client value, 2) service value and is factored into the optimization function. We build onto this model for Retail Banking scenario.
The systems for service delivery in many industries have been traditionally synonymous with queue management systems. The purpose of these commercial systems [Q1, ; Q2, ; Q3, ; Q4, ; Q5, ; Q6, ; Q7, ] typically is to enforce discipline and schedule customers in some pre defined order. The solutions generally work on a static fair play principle and schedule customers in a FIFO order. However, any advanced dynamic scheduling (e.g. based on multiple service parameters) and real time decision support is missing from these products. Some systems allow for simple prioritizing where normal customers are scheduled in FIFO whereas important customers are sent to the top of the queue on their arrival. Alternatively, arriving customers are segregated on the basis of service requested and sent to dedicated service counters.
The central component for any queue management system is the underlying scheduling algorithm. Scheduling has been actively studied as an interesting research problem. Many scheduling problems have been shown to be NP complete [Garey and Johnson, 1979] which resulted in design of approximation algorithms and study of associated approximation ratio. Various variants like pre-emptive vs non-preemptive, single vs multiple machines have also been widely studied. Researchers have focused on different metric to optimize like wait time, makespan, flow time etc. The algorithms and associated analysis make some assumption about the system like migration or pre-emption is allowed or the job deadline is given. Some of these assumption make sense in scheduling jobs on computers but for people centric services such assumption are not valid. Moreover, people centric services bring their own challenges which are difficult to handle in purely mathematical fashion. For example, service personnel tend to work faster in last hour of day as compared to previous hours to quickly serve everyone in the queue and go home. This can be related to machines with variable speeds which is not a well explored area. We point interesting readers to some excellent surveys on scheduling [Sgall, 1998; Vazirani, 2001; Karger et al., 2010].
3 SystemOverview
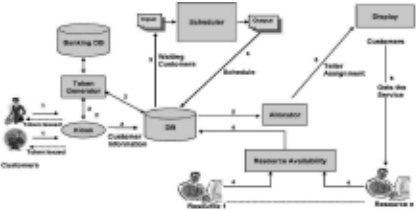
Figure 1 describes the architecture and flow of the overall system. There are six major steps (annotated in figure). Step 1: The customer walks-in and enters her information through the kiosk. The customer is required to provide her information which captures the relationship with bank (account number etc) and current service request. There can be multiple ways to enter the data, e.g. keyboard, touch screen or card swipe. Check-in Kiosk is core component for this step. Step 2: The collected information is stored in database and sent to token generator. The token generator interacts with Core Banking System (CBS) or other bank database to fetch customer data. This data along with current service request is used to compute customer value, segmentation and assign a token number. In typical FIFO based scheduler, the token generator simply increments the last token number and assigns to new customer. Since in the proposed system, the customers are not served in order of arrival, the numeric tokens add to confusion and dissatisfaction among customers. Therefore, the system assigns alpha-numeric token. The alpha component is derived by computing value of customer, discretizing it and finally picking the alpha series assigned to the bin. The main motivation is the token numbers should be generated such that customers cannot gauge the relative order of their arrivals by simply comparing the token numbers. We provide more details in later sections. The final token along with customer information, arrival time etc are stored in database to be used by scheduler. Token Generator provides key functionality for this step.
Step 3: The scheduler picks subset of waiting customers from the database and generates a schedule (ranked list). The schedule is stored in database. This Real Time Transaction Scheduler is back bone of the system.
Step 4: This step corresponds to resource availability. When a resource finishes providing service to a customer, she indicates the availability to the central system so that next customer can be assigned to the resource. This is a standard feature in all Queue Management System, therefore, we limit the discussion on this component in the article.
Step 5: Based on the availability of the resources, the allocator assigns a customer from the schedule to a resource. This customer to resource mapping is shown on the display and can also be accompanied by voice announcement. There are multiple ways to derive this mapping. In current deployment, the top ranked customer is assigned to the available resource. This implies that all resources are considered identical. The readers would notice that in people centric services this may not be best assumption because there will always be variation in efficiency and productivity among people. However, after data collection phase (during deployment) we realized that this variation was very small ( 5%) and therefore could be ignored. Moreover, due to certain HR policies of client, no differentiation among resources was allowed.
Step 6: When the customer sees her token number she can proceed to identified resource, obtain the service and exit the system. To gain on resource efficiency, the display also shows the token numbers of next few customers to be served.
Please note that the steps are presented in sequential fashion only for easy understanding. In reality all steps progress in parallel. Out of the core components, check-in Kiosk ,Display and Teller Availability are fairly standard components. Therefore, in rest of the paper we focus our discussion on the other components.
4 Algorithms
In this section, we present the details on the pertinent components of the solution. First we present basic notations.
Basic Notations C ={C1,C2, . . . ,CN} denotes the list of N customers. Ci captures the information needed to compute value of the customer, e.g. Ci can be customerID of the ith customer. AT represents corresponding arrival times. MS denotes the master list of K service types which can be availed by a customer. Each service type is associated with an expected processing time. The service time for each service type is stored in a list denoted by MT = {MT1,MT2, . . . ,MTK}. The service bundle requested by ith customer is denoted by SBi = {SB1 i , SB2 i , . . . , SBl i } where l is number of services requested by ith customer and ∀lj=1 SBj i ∈MS. The total time needed to process SBi is known as service time denoted by Si. The service time Si is sum of expected service time of all the services in SBi.
S ={S1, S2, . . . , SN} denotes service times for all N customers. V ={V1, V2, . . . , VN} denotes the value of the customer. This value is essentially employed to compute the priority P ={P1, P2, . . . , PN} for the scheduling algorithm. CT represents current time.
Customer Value Computation: As noted earlier, the customer segmentation is based on historic value of the customer as well as the value of the current service request. Formally, the value Vi of ith customer is calculated as:
F1 takes customerID as input and fetched relevant information about the customer from banking database and computes the inherent value of the customer. The range of F1 is [0,1]. There are many domain specific ways to instantiate this function. We list some options below
- Typically, the function will be a simple rule based system which evaluates customer data and returns the value. For example, customers having accounts with different branch or city of same bank (typically referred as nonhome customers) have less value than customers having accounts in the branch ( home customers).
- The function can calculate the monthly or quarterly or yearly average balance in account, map it to precomputed histogram (distribution) of balances for all customers and derive the quantile where the customer belongs to.
- The function can return the value proportional to the years the customers has been with the service provider.
- The function can use standard wallet estimation techniques coupled (e.g. [Perlich et al., 2007]) to derive the probability of successful cross-sell or up-sell.
Similarly, F2 returns the value of the requested service transactions. The range of F2 is also [0,1]. In most cases, F2 will be a simple look-up function to find the value associated with services. The lookup table is provided by domain experts and business analysts on client side.
The weighing factors α and β depends on attributes of the organization. A very high value of α would indicate more emphasis is given to long term relationship whereas a high value of β would capture that importance of current transaction. α+β in denominator is simply a normalization factor so that Vi ∈ [0, 1] and hence comparable for different customers. We believe the choice of α and β should be guided by the organization. If the organization wants a trade-off between the two components then β = 1-α can be chosen.
Token Generation: As mentioned earlier, the system generates alpha-numeric tokens. The alpha component is selected as per the calculated value. The real valued Vi is mapped to a category. A set of alphabets is pre-assigned for each category. One of the alphabet is picked followed by two digit number. The alphabet followed by numbers forms the token number. The mapping of Vi to category depends on number of categories. If there are Q categories, then the mapping function is simply ceil(Vi×Q). This mapping is same as equiwidth binning used in many data analysis algorithms. Other binning techniques can also be used, however, in this work we used the above-mentioned mapping. The number component is also carefully chosen. We first choose number only between 1 to 10 for each alphabet. When all possible tokens have been generated, the range is reset to choose numeric part from 11 to 20. For example, if for some category, the set of alphabets are A, B, then once all tokens {A1, . . ., A10, B1, . . ., B10} (the order of generation will be random) have been generated, we generate tokens like A11. This ensures that in worst case, the numeric part of two comparable tokens (with same alpha part) will have a difference of 8. On an average, this difference will be less and comparisons will not be that effective. Finally, care is taken to assign early part of alphabets (e.g. A, B, C) to higher categories whereas use the latter part of alphabets (T, U, V) for lower categories.
Scheduler Once the value (priority) is computed and customer gets the token, the data is stored in database. The scheduler picks a subset of customers from the database and schedules them. The output of the scheduler is a ranked list (RL) of length N which specifies the order in which the N jobs should be processed. Alternatively, the problem can be posed as an assignment problem. In our optimization model we follow the latter approach. A denotes a N×N assignment matrix where Ai,j = 1 implies that ith customer is assigned the j th rank. RL can be generated trivially by scanning A once and assigning RLj = i whenever Ai,j = 1. The customer at 1st position can be accessed as RL1.
As discussed earlier, the objective is to minimize weighted average wait time. The corresponding objective function is
Subject to the following essential constraint:
Constraint: Each customer should be scheduled once, i.e., each column in A should add up to 1
This constraint also takes care of requirement that all customers must be scheduled. Please note that Pi is priority assigned to ith customer and is derived from the computed value Vi. The objective function in Equation 2 is composed of two components. The expression CT -ATi calculates the time ith customer has already waited before this run of the scheduler. The second part ∑Nj=1 ∑l-1 k=1 Sj ∗ Aj,k computes the service time of all customers which are scheduled to be served before ith customer. The service time of all such customers will be added to waittime of ith customer. The total wait time is scaled by priority of the customer. In this work, Pi is derived such that the lower the value of Pi the more important the customer is. This (somewhat confusing) ideas helps us in properly scaling the weighted wait time. The more important customer will have lower value of Pi and hence less weighed wait time. We explain this again while presenting the heuristic. The reader would notice that this formulation assumes presence of single resource because a single ranked list is generated. As noted earlier, we assume that all resources are identical, therefore, this formulation is valid.
Note that the formulation is quadratic due to presence of Ai,l ×Aj,k term in the objective function. The quadratic programs (QP) take considerable amount of time before producing a feasible solution. This properties makes QP impractical solution for a real time scenario. To get rid of this term we introduce a dummy binary variable s.t.
Now, the linear objective function is:
The condition in Equation 4 can be satisfied by adding following constraint : Dummyi,l,j,k = Ai,l ×Aj,k. However, this particular fashion of forcing the condition results in a quadratic constraint. We rewrite the constraint in linear fashion as follows: Dummyi,l,j,k + 1.1 ≥ Ai,l + Aj,k. When Ai,l =1 and Aj,j=1, the above inequality is satisfied only by assigning Dummyi,l,j,k=1. In all other cases, Dummyi,l,j,k will be assigned 0 to minimize the objective function.
Heuristic In converting the QP into LP we introduced a large number of constraints. For example, for assigning 10 customers to 10 positions, we now have to satisfy 10 × 10 × ×10 × 10 constraints, one for each entry in Dummy. Using the above mentioned formulation, we were not able to produce schedules fast enough to be used in a real time system. However, the QP and LP formulation are important to understand the gap between optimal and heuristics. Moreover, in certain scenarios, due to presence of extra business knowledge, the search space of the problem can be reduced to generate optimal results in less time. We use the following simple heuristic in current deployments.
- For each customer compute Pi ×Si. To re-iterate, priority 1 customers are more important than customers with priority 2. The priority is multiplied by the expected service time to generate weighted service time.
- Sort in ascending order to generate the rank list. This will generate ranking based on Weighted Shortest Job First (WSJF) policy.
We use a small example to highlight the motivation of choosing such a heuristic. Consider the three customers in Table 1. As per our heuristic the schedule will {B,A,C} with simple wait times {0, 4, 8} (average =3). Consider an alternate schedule generated by SJF (optimal scheduling policy) {A,B,C} which will result in same wait time vector and average. However, the second schedule is actually suboptimal in this case because a low priority customer (A) is scheduled ahead of a high priority one (B). Intuitively, by using weighted service time we are enforcing that the cost (importance) of one time unit spent waiting in queue is different for different categories. In current example, two units of waiting time for category 2 is equivalent to one unit to wait time for category 1. This weighing creates a differentiation among customers which is then used to achieve the final goal. The heuristic provides results close to optimal (generated by optimization module) while taking fraction of time.
| Customer ID | Arrival Time | Priority | Service Time | Weighted Service Time |
|---|---|---|---|---|
| A | 10:00 | 2 | 4 | 8 |
| B | 10:00 | 1 | 4 | 4 |
| C | 10:00 | 2 | 6 | 12 |
The scheduling algorithm suffers from starvation problem. If important customers keep coming in the system, it will lead to less important customers facing extremely high waittime, which in turn will decrease C-SAT and defeat the whole purpose of this solution. To handle this problem, we continuously update the priority of all customers. With each customer Ci we associate a maximum starvation time MSTi. The priority of each customer is then updated as follows:
Note that CT -Ai computes the already waited time. If a customer has waited for MSTi minutes, its priority goes to 0 which implies she now belongs to most important category and will be scheduled as soon as possible. The update function gradually adjusts the priority of each customer to avoid starvation. One important thing to note here is MSTi is not an upper bound on wait time. Customer may have to wait beyond MST if the system is over saturated. For example, consider a queue of 200 customers with 40 customers served in one hour and MST = 60 minutes. In this case after 60 minutes, around 140 customers in queue will be of priority 0. In such cases the scheduling will reduce to FIFO policy as WSJF will be 0 for each waiting customer. In real life setting, we found this property to be really useful and desirable to manage crowd perception of fairness. We follow the following procedure to compute MSTi. Currently, banks use FIFO to serve customers. As soon as a customer walks in, we simulate the existing queue (all customers already waiting in the bank) using FIFO and calculate what would have been the wait time of this customer under FIFO. This value is again adjusted based on the category of the customer. For example, for a less important customer, MST is increased by 20% whereas it is decreased for important customers so that the priority increases faster for important customers. This fashion of MST computation takes into account category information, arrival pattern and current system state.
Allocator: In current work, we assume that all resources are identical, therefore allocation of customers to resources is straightforward. The top ranked waiting customer is sent to the available resource. If the resources are not identical, then the current system may not produce desirable results and the scheduler would need to be re-designed.
5 Results
The proposed system has been deployed (at pilot level) in multiple branches of a leading bank in India. In this section we briefly summarize the prototype implementation and present some of the results.The results also include findings from an informal customer survey conducted during the duration of the deployment. Due to confidentiality reasons, we are unable to divulge all the client data and the results. However, we share high level results (in terms of percentages) to demonstrate how our system met the objectives of differentiated QoS based service delivery.
| Category | %Change inWait Time | %Volume |
|---|---|---|
| Cat 0 | 83 | 5 |
| Cat 1 | 30 | 60 |
| Cat 2 | -1 | 25 |
| Cat 3 | -25 | 15 |
For each branch, we collected data for first two weeks. This data was used to to calculate the original wait times (baseline). During this two week period the bank continued to use existing token dispensing machine which generates sequentially numbered token. These tokens were scheduled using FIFO. The client provided a rule based system for value generation. There were four rules which resulted in four different values (converted to priority or category). Every incoming customer is mapped into one of the four categories based on his profile and current transaction value. The client wanted to improve the following business metrics: wait time of most important customers - Category 0 and wait time of Category 1 customers. Category 0 would typically have High Networth Customers (HNIs). The implicit understanding was that while minimizing wait time of preferred categories, the other categories should not be penalized heavily. In FIFO, there is no differentiation among customers categories therefore the original average wait time served as baseline for the business metrics. Next we present quantitative results derived from collected data.
Wait Time Comparisons: Over the deployment period, our system scheduled around 25000 customers. Category 1 accounted for around 60% of customers whereas around 1500 customers were in Category 0. Out of 30000 service requests, around 75% were deemded to have positive value for the bank. Table 2 presents the results by category. The second column captures the change in waittime while the last column captures the volume of customers in that category. The most important customer experiences a wait time reduction of around 83%! Please note that the wait time for least important category increased by 25% however, these customer accounted for only 15% of total customers. On the other side 60% of customers in Category 1 experienced a 30% benefit (reduction in wait time). Due to huge chunk of customer benefitting due to the system, the overall wait time also decreased as compared to FIFO. Overall, the system was able to exceed the expectations in terms of wait time reduction.
Queue Bursting: The overall wait time is hugely influenced by the arrival pattern of the customer. For example, consider a scenario where each hour around 80 customers come to branch and the resources are also equipped to handle 80 customers in an hour. If such in-flow continues for 5 hours (400 customers), then the wait time per customer would be very less. However, assume 100 customers come to branch in first three hours and 50 each in next two hours (again 400
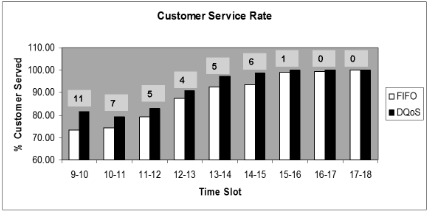
customers). In this case, the wait time would be huge because queue build-up in starting hours would have a cumulative effect on waiting customers. Therefore, it is imperative that the queue build-up should be as small as possible. Figure 2 shows how the queue size varies during the day for FIFO and our differentiated QoS system. The bars capture Served Arrival ratio, i.e., out of total arrivals how many were served. The smaller the ratio, the larger the queue. The number of top of bars indicates the percentage improvement our system has over traditional FIFO systems. The smaller queue is primarily due to Weighted Smallest Job First principle where smaller jobs are served first and they exit the system, thereby reducing the queue. Please note zero length queue can also result from less arrivals implying resources are not fully utilized.
Customer Survey: We conducted a preliminary survey in the bank to gather feedback from the customers and bank employees. 2 . We informally spoke to over 100 customers (from various categories, visiting the branch with different frequencies) during the pilot to understand their perception on performance metrics (wait time), system understanding, and overall system performance. Close to 70% customers perceived reduction in wait time, 81% customers found the new system easy to understand. However, 19% found difficulties in understanding due to the new token numbering system and the slight change in business process at the bank. Ovearll, 82% of customers felt the system has made a positive impact. The support from the bank staff during the pilot was exemplary and we received valuable feedback from them such as on improving the token numbering scheme, color coding on the display pannel and acoustically notifying the customer when their turn comes up.
Due to lack of space, we are unable to provide details on many aspects. However, we highlight some features in brief. Real Time DashBoard: The system has a dashboard which can be used to extract information about the current state of the branch. Some view which we currently support are: Customer View (information about all waiting customers), resource view (efficiency etc), and service view (service time and request count for all services).
Resource Optimization: As a trial run we re-configured the branch by adding an extra resource for one hour in first half of the day while removing a teller in later half of the day. Since the demand is more in morning, this extra resource help in further queue bursting. During less arrivals, one regular resource is removed to complete the back office work. In this way, without increasing any resource hours, we were able to further reduce wait time by around 6%. As of now this reconfiguration is done manually by looking at historical arrival patterns. We plan to extend the work to perform this operation dynamically and automatically to provide recommendation to the user.
2 We could not do a full-fledged statistically designed survey due to restrictions on account of the scope of the pilot
MinimumWait Time Notification: Finally, the system has the capability to provide the customer with a time period for which he will have to wait in minimum. Please note that this is not a upper bound on wait time. On the contrary, this is lower bound, which implies, the customer turn will not come before this time is elapsed. We compute this by simulating the existing queue and adjusting the expected waittime based on customer category and arrivals.
6 Conclusion
In this paper we presented an integrated system for providing differentiated QoS to customers in retail banking. We presented the complete system and focused on technical contributions in selected components like Scheduler and Token Generation. Results demonstrating the efficiency and usefulness of the system are presented based on multiple deployments in large bank in India. We shared our learnings from these deployments and how it shaped the final solution. In future, we would like to explore if such a system can be customized for other domains like Retail, Travel and BPO.
@inproceedings{ijcai2011p415,
  title     = {A System for Providing Differentiated QoS in Retail Banking},
  author    = {Mehta, Sameep and Chafle, Girish and Parija, Gyana R and Kedia, Vikas},
  booktitle = {Proceedings of the Twenty-Second International Joint Conference on
               Artificial Intelligence, {IJCAI-11}},
  publisher = {AAAI Press/International Joint Conferences on Artificial Intelligence},
  editor    = {Toby Walsh},
  pages     = {2494--2498},
  year      = {2011},
  month     = {7},
  doi       = {10.5591/978-1-57735-516-8/IJCAI11-415},
  url       = {https://doi.org/10.5591/978-1-57735-516-8/IJCAI11-415},
}
TY - CPAPER TI - A System for Providing Differentiated QoS in Retail Banking AU - Mehta, Sameep AU - Chafle, Girish AU - Parija, Gyana R AU - Kedia, Vikas T2 - Proceedings of the Twenty-Second International Joint Conference on Artificial Intelligence, IJCAI-11 PB - AAAI Press/International Joint Conferences on Artificial Intelligence PY - 2011 SP - 2494 EP - 2498 DO - 10.5591/978-1-57735-516-8/IJCAI11-415 UR - https://doi.org/10.5591/978-1-57735-516-8/IJCAI11-415 ER -Copied
Machine-readable versions of this paper, for tools and AI agents:





