
User Similarity from Linked Taxonomies: Subjective Assessments of Items
Proceedings of the Twenty-Second International Joint Conference on Artificial Intelligence. Pages 2305-2310.
https://doi.org/10.5591/978-1-57735-516-8/IJCAI11-384
© 2011 International Joint Conferences on Artificial Intelligence
Abstract
Subjective assessments (SAs) are assigned by users against items, such as ’elegant’ and ’gorgeous’, and are common in reviews/tags in many online-sites. However, previous studies fail to effectively use SAs for improving recommendations because few users rate the same items with the same SAs, which triggers the sparsity problem in collaborative filtering. We propose a novel algorithm that links a taxonomy of items to a taxonomy of SAs to assess user interests in detail. That is, it merges the SAs assigned by users against an item into subjective classes (SCs) and reflects the SAs/SCs assigned to an item to its classes. Thus, it can measure the similarity of users from not only SAs/SCs assigned to items but also their classes, which overcomes the sparsity problem. Our evaluation, which uses data from a popular restaurant review site, shows that our method generates more accurate recommendations than previous methods. Furthermore, we find that SAs frequently assigned on a few item classes are more useful than those widely assigned against many item classes in terms of recommendation accuracy.
- [Cantador et al., 2011] Ivan Cantador, Ioannis Konstas, and Joemon M. Jose. Categorising social tags to improve folksonomy-based recommendations. Journal of Web Se- mantics, 9(1):1-15, 2011.
- [Hirano et al., 2007] Toru Hirano, Yoshihiro Matsuo, and Genichiro Kikui. Detecting semantic relations between named entities in text using contextual features. In Proc. ACL'07, pages 157-160, 2007.
- [Konstas et al., 2009] Ioannis Konstas, Vassilios Stathopou- los, and Joemon M. Jose. On social networks and collab- orative recommendation. In Proc. SIGIR'09, pages 195- 202, 2009.
- [Lovazs, 1996] Laszlo Lovazs. Random Walks on Graphs: A Survey, volume 2. Bolyai Society for Mathematical Stud- ies, 1996.
- [Manning et al., 2008] Christopher D. Manning, Prabhakar Raghavan, and Hinrich Schtze. Introduction to Informa- tion Retrieval. Cambridge University Press, 2008.
- [Nakatsuji et al., 2009] M. Nakatsuji, M. Yoshida, and T. Ishida. Detecting innovative topics based on user- interest ontology. Journal of Web Semantics, 7(2):107- 120, 2009.
- [Nakatsuji et al., 2010] Makoto Nakatsuji, Yasuhiro Fuji- wara, Akimichi Tanaka, Toshio Uchiyama, Ko Fujimura, and Toru Ishida. Classical music for rock fans?: novel recommendations for expanding user interests. In Proc. CIKM'10, pages 949-958, 2010.
- [Resnick et al., 1994] P. Resnick, N. Iacovou, M. Suchak, P. Bergstorm, and J. Riedl. Grouplens: An open archi- tecture for collaborative filtering of netnews. In Proc. CSCW'94, pages 175-186, 1994.
- [Russell and Norvig, 2003] Stuart J. Russell and Peter Norvig. Artificial Intelligence: A Modern Approach. Pear- son Education, 2003.
- [Schickel-Zuber and Faltings, 2006] Vincent Schickel- Zuber and Boi Faltings. Inferring user's preferences using ontologies. In Proc. AAAI'06, pages 1413-1418, 2006.
- [Schickel-Zuber and Faltings, 2007] Vincent Schickel- Zuber and Boi Faltings. Oss: A semantic similarity function based on hierarchical onotlogies. In Proc. IJCAI'07, pages 551-556, 2007.
- [Tso-Sutter et al., 2008] Karen H. L. Tso-Sutter, Lean- dro Balby Marinho, and Schmidt-Thie Lars. Tag-aware recommender systems by fusion of collaborative filtering algorithms. In Proc. SAC'08, pages 1995-1999, 2008.
- [Zhen et al., 2009] Yi Zhen, Wu-Jun Li, and Dit-Yan Yeung. Tagicofi: tag informed collaborative filtering. In Proc. RecSys'09, pages 69-76, 2009.
- [Ziegler and McNee, 2005] Cai N Ziegler and S. M. McNee. Improving recommendation lists through topic diversifica- tion. In Proc. WWW'05, pages 22-32, 2005.
References were extracted automatically from the PDF and may contain errors.
Full text extracted automatically from the PDF; figures, tables and equations may differ. The PDF is the version of record.
1 Introduction
Many content providers such as Amazon 1 and Last.fm 2 employ user-generated reviews and tags as well as rating values against items. Subjective assessments (SAs), common in reviews or tags against items, represent subjective opinions such as 'unforgettable' and 'so cute' as well as subjective qualities such as 'gorgeous' and 'elegant'[Cantador et al., 2011]. They are valuable sources of information in analyzing why users assigned high or low rating values against items. Thus, the SAs assigned against items potentially improve recommendation accuracy. If the recommendation systems can utilize such SAs effectively, we will be able to present recommendations that match the desires of the user.
Most commercial recommendation systems use methods based on collaborative filtering (CF). CF is based on the intuition that users who access the same items with the active user, the one who is receiving the recommendation, tend to have similar interests to the active user. Several researchers have tried to adopt user-generated tags to improve recommendation accuracy[Tso-Sutter et al., 2008; Zhen et al., 2009; Konstas et al., 2009; Cantador et al., 2011] in CF. Among those, Cantador et al. analyzed tags in Flickr social tagging system 3 and classified tags into the following four categories; content, context, subjective, and organizational[Cantador et al., 2011]. Content tags are the objects that appear in a photo. Context tags are contextual information about the items such as the location or the time at which the photo was taken. Subjective tags are descriptive subjective qualities and opinions about the items. Organizational tags are organizational aspects such as self-references and personal tasks. They showed that content information against items was useful in improving recommendation accuracy. However, their results also showed that subjective tags are not so effective in improving recommendation accuracy. We consider that the poor recommendation accuracy of SAs in prior studies is due to the sparsity problem, which produces low recommendation accuracy of CF when the dataset used to measure the similarity of users is not sufficient.
1 http://www.amazon.com/
2 http://www.last.fm/
The sparsity problem is due to two reasons. First is that the rating dataset holds few items that have been assigned the same SAs. For example, 'excellent' and 'wonderful' are distinct words and previous methods treat these words as different SAs, even though they have similar meanings. As a result, users who rate items with 'excellent' and those who rate the same items with 'wonderful' are treated as not similar by previous methods. Second is that different users do not always access and assign SAs against the same items. Thus, it is difficult to measure similarity of users against those items.
In this paper, we propose a novel taxonomy-based algorithm to solve the sparsity problem described above. Our method measures the similarity of users in more detail by linking a taxonomy of SAs to a taxonomy of items. It merges SAs assigned by users against an item into subjective classes (SCs). And, it reflects the SAs/SCs assigned to an item to its classes. This is based on our observation that users who assign a high rating value against an item together with an SA, may also like items of the same class and similar SAs. For example, in Fig. 1, if user u highly rates the pasta restaurant Figlio and assigns it the SA 'light', he is expected to prefer pasta restaurants that have been assigned the SA 'nonfatty' by other users. This is because 'light' and 'non-fatty' share the same SC sc1. As a result, our method treats user v, who likes pasta restaurant Laria (he assigns it the SA of 'non-fatty') as similar to u. Moreover, it treats user w, who likes pasta restaurant Fratelli (assigning it the SA of 'rich') as dissimilar to u. Thus our algorithm computes user similarity from the SAs/SCs assigned to not only items but also their classes.
3 http://www.flickr.com/
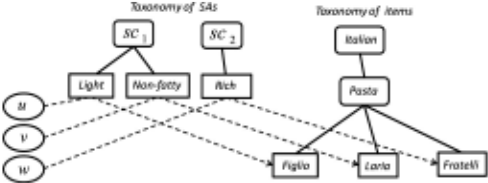
We conduct a comprehensive evaluation using a dataset from a popular restaurant review site, Tabelog 4 . Experiments show that our method generates more accurate recommendations than previous methods, especially with regard to highlyranked items in the recommendation list. Furthermore, we found that SAs assigned against items in a few item classes are more useful in terms of realizing accurate recommendations than the SAs widely assigned to items across many item classes.
The paper is organized as follows: we describe related works in the next section. Section 3 describes the background of this paper. We next explain our method in detail in Section 4; how to link a taxonomy of SAs to that of items to measure similarity of users. We then evaluate our method using a dataset of a popular restaurant review site in Section 5. Finally, we conclude the paper.
2 Related works
Several researchers adopt user-generated tags against items for improving recommendation accuracy in CF[Tso-Sutter et al., 2008; Zhen et al., 2009; Konstas et al., 2009; Cantador et al., 2011]. Zhen et al. apply tags assigned by users to the probabilistic matrix factorization (PMF) method. The PMF method has the effect of creating latent factors, inferred from item rating or tag assignment patterns, and connect users and items even if those users do not access the same items with the same tags. Their evaluation used a dataset that included many ratings of users, and showed that their method offered better accuracy than the previous PMF based method. However, their method fails to improve upon the results of the Pearson correlation method, explained in the next section.
4 http://tabelog.com/
Cantador et al. analyzed the Flickr social tagging system and classified tags into the following four categories; content, context, subjective, and organizational[Cantador et al., 2011]. They build a graph whose nodes are tags, users, and items, and edges are set between nodes if users assigned tags against items, connected to other users, or accessed items. They then perform Random Walk with Restart(RWR)[Lovazs, 1996] from the active user node on the graph to compute the relatedness between nodes on the graph and produce recommendations for the active user. Their evaluation found that using content tags against items is most useful for improving recommendation accuracy, while using subjective tags is not so useful. This is due to the sparsity problem as explained in the introduction section. Their earlier evaluation[Konstas et al., 2009] used a dataset containing listening histories of music tracks from Last.fm and found that tag-based recommendations yielded by the RWR method have higher accuracy. However, the RWR method can not achieve highly accurate recommendations when the rating dataset has sparse SAs as shown in the evaluation section. That is, the RWR method can not handle sparse tags against items assigned by users.
There are several works on taxonomybased recommendations[Nakatsuji et al., 2009; 2010; Schickel-Zuber and Faltings, 2006; 2007; Ziegler and McNee, 2005]. Our work is an extension of these studies. By using a taxonomy of items, those methods measure the similarity of users based on items rated by users as well as classes that include those items. Thus, those methods accurately predict user interests even when the rating dataset is sparse. Furthermore, the taxonomy-based method can present the active user with the relationships between predicted items and previous interests of the user by referring to the taxonomy. Thus, they can offer the reasoning of the recommendations to the active user while PMF or RWR methods can not. However, they fail to manage user interests in detail according to several classification approaches (taxonomies) though there are several classification approaches against content items.
Our method uses linked taxonomies to model user interests, and thus overcomes the sparsity problem in utilizing SAs. It can also present the semantic reasons behind the recommendations.
3 Background
In computing user similarity, basic CF methods often use the Pearson correlation approach[Resnick et al., 1994]. Let u be the active user, Pearson correlation coefficient measures the similarity between the active user u and user v, S(u, v), as follows:
whereMis the set of items rated by users u and v, ru,i is the rating value of user u for item i, and ¯ ru is the average value of item ratings given by u. The advantage of the Pearson correlation approach is that it takes into account that different users might have different rating schemes.
| Symbols | Definitions |
|---|---|
| c | A class in the item taxonomy (item class) |
| sc | A class in the subjective taxonomy (SC) |
| I(c) | Item set whose members have class c as an ancestor |
| ⃗ru | A rating vector of user u assigned to items |
| ⃗au,i | A vector of SAs for item i by user u |
| ⃗cu,i | A vector of SCs for item i by user u |
| ⃗au,c | A vector of SAs for item class c by user u |
| ⃗cu,c | A vector of SCs for item class c by user u |
If N is the set of users that are most similar to u, the predicted rating of u on item i, pu,i, is obtained by the following equation:
This equation implies that CF methods recommend items based on user similarities. Therefore, effective assessment of user similarities is important to improve the recommendation accuracy of CF methods.
4 Method
Our method uses a taxonomy of SAs, so we explain it first. We then explain our model of user interests and how to measure the similarity of users by linking a taxonomy of SAs to that of items. Next, we propose an optimization of the SA set in a taxonomy of SAs for achieving highly accurate recommendations; extracting SAs that are useful for producing highly accurate recommendations.
4.1 Taxonomy of SAs
The taxonomy of SAs classifies similar SAs into subjective classes (SCs). We measure the similarity of users by referring to the taxonomy of SAs. This paper assumes that SCs has no parent SCs except for the root class for the ease of explanation of the method. However this assumption is not implicit with our method.
Taxonomies of SAs have been created in some form by some online sites such as allmusic 5 and Jinni 6 . If we can not use an existing taxonomy, we first extract SAs used for the target service domain by analyzing reviews or tags assigned by users against items. This method is the same approach as the previous study[Cantador et al., 2011]. After extracting SAs, we create a taxonomy of SAs by referring to WordNet thesaurus dictionary 7 or from discussions with human experts. In our evaluation, three human experts discussed and classified SAs into SCs to create the taxonomy of SAs (see Section 5.1).
4.2 Modeling user interests
Our model of user interests is based on the observation that users who assign a high rating value against an item with an SA, may also like items of the same class and similar SAs.
5 http://www.allmusic.com/
6 http://www.jinni.com/
7 http://wordnet.princeton.edu/
Now, we explain how to model user interests by linking the taxonomy of SAs to the taxonomy of items. Please also refer to the symbol explanation given in Table 1.
User interests are modeled by using the following vectors: ⃗ru, ⃗au,i, ⃗cu,i, ⃗au,c, and ⃗cu,c.
⃗ru is the vector of ratings against items by user u. That is, each element in ⃗ru corresponds a rating value assigned against each item by user u.
⃗au,i is the vector of SAs assigned by user u against item i. Each element in ⃗au,i corresponds to the frequency of each SA assigned by user u against item i.
- ⃗cu,i is the vector of SCs assigned to item i by user u. Each element in ⃗cu,i corresponds the frequency of each SC assigned by user u against item i. For example, the element that corresponds to SC sc, ⃗cu,i(sc), is computed by reflecting SA s to SC sc if sc includes s. That is, ⃗cu,i(sc) = ∑s∈sc ⃗au,i(s).
⃗au,c is the vector of SAs assigned by user u to item class c. Each element of this vector denotes the assignment frequency of each SA by user u against item class c. If we denote I (c) as the item set whose members have item class c as an ancestor, ⃗au,c is computed by ∑i∈I(c) ⃗au,i.
⃗cu,c is the vector of SCs assigned to item class c by user u. Each element of this vector denotes the assignment frequency of each SC by user u against item class c. ⃗cu,c is computed by ∑i∈I(c) ⃗cu,i.
4.3 Measuring similarity of users
In this section, we explain our similarity measurement between users. Our method considers SAs assigned by users as well as users' ratings against items by linking the taxonomy of SAs to that of items. The procedure of our algorithm is listed below.
- It first measures similarity of users for SAs against item i, Si(u, v), by summing the cosine similarity of ⃗au,i and ⃗av,i and that of ⃗cu,i and ⃗cv,i as follows:
where cos(⃗x, ⃗y) is cosine similarity of vector ⃗x and ⃗y. That is, if we denote x(j) and y(j) as the j-th element of vector ⃗x and ⃗y, respectively, cos(⃗x, ⃗y) == ).
- Next, it computes the similarity of users for SAs against each item class, Sc(u, v), by summing the cosine similarity of ⃗au,c and ⃗av,c and that of ⃗cu,c and ⃗cv,c as follows:
Here, the denominator of the equation has the effect of avoiding the strong biases against Sc(u, v) if item class c has many items as decedents as reported by Schickel et al.[Schickel-Zuber and Faltings, 2006].
- Then, it measures the similarity of users for SAs by summing the similarity of users for SAs against each item and that against each item class according to the following equation:
Algorithm 1 Optimizing SA set
Input: SA set S in the taxonomy of SAs.
Output: Optimized SA set S that maximizes AP.
- 1: loop
- 2: Compute AP A using all SAs in S;
- 3: for each SA s in S do
- 4: Remove s fromS;
- 5: Compute AP As using all SAs in S;
- 6: Add s to S;
- 7: end for
- 8: if maxs∈S{As} > A then
- 9: Remove argmaxs∈S{As} fromS;
- 10: else
- 11: Break;
- 12: end if
- 13: end loop
- 14: return S
whereM is the set of items rated by users u and v, and C denotes a class set (except for the 'root' class) in the taxonomy of items.
- It also measures the similarity of users for ratings, Sr(u, v), using the Pearson correlation method given by Equation (1).
- Finally, our method normalizes the similarity of users for SAs and the similarity of users for ratings against all users. It then sums the normalized similarities to compute the similarity of users.
In this way, we measure the similarity of users not from a single taxonomy of items as is done in the previous taxonomy-based method[Nakatsuji et al., 2010], but from linked taxonomies; in our case, subjective assessments of items. Thus, our method overcomes the sparsity problem that occurs when adopting SAs to CF by considering the SAs/SCs assigned by users against items and their item classes.
4.4 Optimizing SA set for improving accuracy
When linking a taxonomy of SAs to a taxonomy of items, it is important to assess which SAs are useful in measuring the similarity of users to improve recommendations. Our method is designed to accurately recommend items that are highly ranked in the recommendation list by optimizing the SA set that maximizes Average Precision (AP) in predicting user interests. AP is a widely used measure in information retrieval studies[Manning et al., 2008]. Let the number of ranked items be k, the number of correct answers among topj ranked items be Nj, and the number of all correct answers be D (defined as items the user is interested in), AP is defined as follows:
Optimizing the combination of SAs from all possible combinations of SAs is defined as the combinatorial optimization that finds the optimized SA set S that maximizes AP subject to s ∈ S. Because this is an NP-hard problem, we use hillclimb search[Russell and Norvig, 2003] to optimize the SA set that maximizes AP in predicting user interests.
Algorithm 1 shows our optimization algorithm. It first initializes the SA set, S, to extract all SAs from reviews/tags, and selects candidate SA, s, one by one from S. It then removes s from S, and computes recommendations for users, and evaluates AP As at that time. It adds the removed SA s to S and selects another candidate SA from S. After checking all candidates in S, it determines SA s to be removed from S if maxs∈S{As} > A. It continuously repeats the above removal process among the remaining SA set until AP can not be improved more.
Note that hill climbing is good for finding local optima, but it is not guaranteed to find the best possible combination out of all possible combinations. However, this approach is effective in improving recommendation accuracy as demonstrated in the next section. Moreover, this approach gives a good direction for us to investigate what types of SAs are good for improving recommendation accuracy. In the evaluation section, we discuss what types of SAs remain in the SA set and so are to be considered useful in improving recommendations.
5 Evaluation
We evaluated our method by using a dataset gleaned from a popular Japanese restaurant review site.
5.1 Dataset
We used a dataset gathered from the popular Japanese restaurant web site Tabelog to evaluate the performance of the proposed method. We extracted 262,137 reviews of 2,879 users against 44,321 restaurants (items) to create the evaluation dataset. The taxonomy of restaurants is quite deep; it has 318 genres as item classes, and has three or four hierarchy levels. For example, the end classes of this taxonomy have genres such as "Wine bar" and "Beer garden". The maximum user rating was 5 and the minimum rating was 0. A low item rating indicates a negative interest in that item.
The SAs were extracted from restaurant review descriptions following the below procedures. First, we analyzed the dependency between phrases and restaurant menus in each sentence in the reviews by using a Japanese dependency extraction parser[Hirano et al., 2007]. The menu dataset we used contains 1,810 menus provided by Life Scape Marketing Corporation 8 . The phrases were then automatically classified into SAs using the same approach as a previous study [Cantador et al., 2011]; We first removed some stop-words (e.g., conjunctions), then determined the phrases as tuples of PoS (Part of Speeches), and finally compared it with a set of POS-tuple patterns defined for classifying SAs. POStuple patterns have the following two forms; [<adjective>],
8 http://www.lifescape-m.co.jp/
| SC1 | SC2 | SC3 | SC4 |
| Rich | Light | Fresh and fluffy | Sophisticated |
| Creamy | Bland | Smoking hot | Nice |
| Fat | Non-fatty | Steaming | |
| Unguinous | Plain |
[<adjective><noun>] 9 .
Next, three human experts discussed and classified SAs into two or more SCs by the following procedures. The classification of an SA to one or more SCs was accepted if all the experts concurred. If there were no candidate SCs for SA classification, the experts created SCs. However, such a classification was accepted only if two or more experts agreed with the classification. In this way, we created a taxonomy of SAs that were unambiguously classified. As a result, we created 44 SCs with 283 SAs. Examples of the SCs so created are shown in Table 2 10 .
In our evaluation dataset, users rated 90.9 items on average, but assigned SAs against only 16.3 items. Thus, this dataset contains sparse SAs assigned by users to items compared with the users' ratings against items. It is difficult for the conventional approach to utilize such sparse SAs for improving recommendation accuracy.
5.2 Compared methods
We compared our proposed method to the following previous methods.
- Pearson correlation coefficient (Pearson): similarity of users is measured by Pearson correlation coefficient which is explained in Section 3. The prediction values of items are computed by using Equation (1) and Equation (2).
- Method using RWR (RWR): this method was proposed by Cantador et al.[Cantador et al., 2011]. It creates a graph whose nodes are users, items, and tags, and performs RWR on the graph to compute recommendations. The restart parameter of RWR is set to 0.8 because this value yields the best recommendation accuracy. Our dataset has no social connections of users, so there are no edges between users. The weight of the edge between a user and an item is determined to be proportional to the rating value assigned against the item by the user.
- Method using a taxonomy of items (Taxonomy): this method was proposed by Nakatsuji et al.[Nakatsuji et al., 2010] and is the most accurate of the existing taxonomy-based methods. It computes similarity of users from the ratings of users assigned to items as well as classes in a taxonomy of items.
9 The authors in [Cantador et al., 2011] used four POS-tuple patterns. Among those, the two patterns described above well suit Japanese datasets.
10 Note that the original SAs are in Japanese and we have translated them into English for the reader's understanding.
| MAP | AP@20 | AP@50 | AP@100 | AP@200 | |
|---|---|---|---|---|---|
| Pearson | 11.18 | 4.33 | 5.52 | 6.40 | 7.42 |
| RWR | 5.40 | 2.5 | 0.69 | 1.26 | 2.12 |
| Taxonomy | 7.80 | 2.16 | 3.13 | 4.00 | 4.91 |
| Proposed | 11.98 | 4.78 | 5.98 | 6.92 | 8.02 |
5.3 Methodology
We randomly divided the dataset into two halves: training dataset and predicted dataset. We then used the training dataset to measure the similarity of users. We next computed the prediction values of items for the active user by adding similarities of users to Equation (2). In the evaluations, we exchanged the training dataset with the predicted dataset and investigated the reproducibility of the results. The results shown later are the average value of those two datasets.
We used Mean Average Precision (MAP)[Manning et al., 2008] to evaluate the produced recommendation list. MAP is computed by Equation (7) where k is set to the total number of items in the list. We set the total number of items in the list for each user to 1,000 from among the 44,321 items because we consider that the highly ranked items are more important.
We also used AP to evaluate our method. Here AP is formulated as Equation (7). In our evaluation, we checked AP against the top-k ranked items. We set k to 20, 50, 100 and 200 in our evaluation, and the corresponding results are denoted as AP@20, AP@50, AP@100, and AP@200.
We found that our method achieves the most accurate results against MAP among the methods for all numbers of users, N, examined: 15, 20, 30, and 50. We explain the results with N = 20 below due to space limitations.
5.4 Results
We first explain the accuracy of the methods and then discuss the SAs remaining after SA set optimization.
Accuracy We evaluated the accuracy of our method by changing the number of items recommended to the active user. Results against MAP and AP@k are shown in Table 3. The results confirm that our method yields better MAP than the baseline method, Pearson, with the statistical significance of p < 0.05 (two-tailed t-test was used). Our method also offers better AP@K than the rest in all cases. This indicates that our method, which links the taxonomy of SAs to that of items, can capture user interests in more detail. In the recommendation list, the user tends to look at only the highly ranked items. Thus, these results imply that our method is potentially very practical.
Our method also achieves much higher accuracy than the RWR method. In our evaluation, we do not use tags such as those representing content or context used in the evaluation in [Cantador et al., 2011] because we investigate how to improve recommendation accuracy while handling SAs. The RWR method has poor recommendation accuracy because it does not use a taxonomy of SAs and a taxonomy of items, and thus suffers from the sparsity problem in handling SAs.
| w/o item classes | 11.62 | 4.42 | 5.71 | 6.65 | 7.72 |
| Effective | Ineffective |
|---|---|
| Non-fatty, Artistic, Exotic, Bitter, Sour, Well-established, Smoking hot, Fine-drawn. | Expensive, Too much, Translucent, Strange, Tasty, Wonderful, Affecting. |
Our method also performs much better than the Taxonomy method since the latter assesses user interests from only a single taxonomy and simply reflects users' ratings against items to their classes. It does not consider users' SAs against items. Our method assesses user interests in more detail and so produces much more accurate recommendations.
We also evaluated the effect of reflecting SAs/SCs to items as well as to item classes. To this end, we compared our method with the method that uses only a taxonomy of SAs 11 . The results are shown in Table. 4. We denote the method that uses only the taxonomy of SAs as Without item classes. These results indicate that our method achieves higher accuracy in all cases for all numbers of items in the recommendation list examined. Our method improves recommendation accuracy by measuring the similarity of users considering SAs/SCs against items as well as those against item classes. This implies our method does indeed overcome the sparsity problem that occurs when applying SAs to recommendation systems based on CF methods.
Optimized SA set Next, we investigated the effect of optimizing the SA set S. We determined which SAs were ineffective, i.e. their removal increased accuracy, and identified their types. Table 5 shows some typical examples of effective and ineffective SAs 12 . Ineffective SAs include 'tasty', 'affecting', and 'wonderful', while 'non-fatty', 'well-established', and 'fine-drawn' are effective and so should be retained in S.
Our investigation of the ineffective SAs showed that there were three main types. The first type tended to represent the negative interests of users against items such as 'too much' and 'expensive'. The next type covered the SAs that can be used against items other than restaurant menus (though they were determined as SAs against restaurant menus by the human experts when creating the SA taxonomy); examples include 'strange' and 'translucent'. The third type were those SAs that were used very frequently (about twice as many item classes on average than the effective SAs); examples include 'tasty' and 'wonderful'. This result indicates that SAs assigned by users against a wide variety of items tend to be less effective in creating accurate recommendations than SAs assigned against a narrow variety of items. This result supports the result of the previous study in [Cantador et al., 2011] which states that content tags are useful in creating accurate recommendations. SAs assigned against a narrow variety of items may well reflect the content of the items.
11 This is equivalent to not summing Sc(u, v) when computing Ss(u, v) in Equation (5) in Section 4.
12 Note that the original phrases are in Japanese and we have translated them into English for the reader's understanding.
6 Conclusion
We proposed a novel algorithm that links a taxonomy of items to a taxonomy of subjective assessments (SAs) to better measure the similarity of user interests. It merges the SAs assigned by users against items into subjective classes (SCs) and reflects SAs/SCs assigned to an item to the classes that includes that item. Thus, it can compute the similarity of users from not only SAs/SCs assigned against the item but also those reflected to item classes. An evaluation showed that our method generates more accurate recommendations than previous methods, especially against items that are highly ranked in the list. We also investigated what types of SAs were effective in realizing accurate recommendations, and found that the SAs assigned to relatively few item classes tend to be more effective in raising recommendation accuracy than more general SAs. The concept of linked taxonomies is applicable to other item classification approaches such as labels and genres of music content.
@inproceedings{ijcai2011p384,
  title     = {User Similarity from Linked Taxonomies: Subjective Assessments of Items},
  author    = {Nakatsuji, Makoto and Fujiwara, Yasuhiro and Uchiyama, Toshio and Fujimura, Ko},
  booktitle = {Proceedings of the Twenty-Second International Joint Conference on
               Artificial Intelligence, {IJCAI-11}},
  publisher = {AAAI Press/International Joint Conferences on Artificial Intelligence},
  editor    = {Toby Walsh},
  pages     = {2305--2310},
  year      = {2011},
  month     = {7},
  doi       = {10.5591/978-1-57735-516-8/IJCAI11-384},
  url       = {https://doi.org/10.5591/978-1-57735-516-8/IJCAI11-384},
}
TY - CPAPER TI - User Similarity from Linked Taxonomies: Subjective Assessments of Items AU - Nakatsuji, Makoto AU - Fujiwara, Yasuhiro AU - Uchiyama, Toshio AU - Fujimura, Ko T2 - Proceedings of the Twenty-Second International Joint Conference on Artificial Intelligence, IJCAI-11 PB - AAAI Press/International Joint Conferences on Artificial Intelligence PY - 2011 SP - 2305 EP - 2310 DO - 10.5591/978-1-57735-516-8/IJCAI11-384 UR - https://doi.org/10.5591/978-1-57735-516-8/IJCAI11-384 ER -Copied
Machine-readable versions of this paper, for tools and AI agents:





