
Stable Biclustering of Gene Expression Data with Nonnegative Matrix Factorizations
Proceedings of the Twentieth International Joint Conference on Artificial Intelligence. Pages 2651-2655.
© 2007 International Joint Conferences on Artificial Intelligence
Abstract
Although clustering is probably the most frequently used tool for data mining gene expression data, existing clustering approaches face at least one of the following problems in this domain: a huge number of variables (genes) as compared to the number of samples, high noise levels, the inability to naturally deal with overlapping clusters, the instability of the resulting clusters w.r.t. the initialization of the algorithm as well as the difficulty in clustering genes and samples simultaneously. In this paper we show that all of these problems can be elegantly dealt with by using nonnegative matrix factorizations to cluster genes and samples simultaneously while allowing for bicluster overlaps and by employing Positive Tensor Factorization to perform a two-way meta-clustering of the biclusters produced in several different clustering runs (thereby addressing the above-mentioned instability). The application of our approach to a large lung cancer dataset proved computationally tractable and was able to recover the histological classification of the various cancer subtypes represented in the dataset.
- [Badea, 2005] Badea L. Clustering and metaclustering with Nonnegative Matrix Decomposition. Proc. ECML-05, LNAI 3720, pp. 10-22.
- [Lee and Seung, 2001] Lee D.D., H.S. Seung. Algorithms for non-negative matrix factorization. Proc. NIPS*2000, MIT Press, 2001.
- [Welling and Weber, 2001] Welling M., Weber M. Posi- tive tensor factorization. Pattern Recognition Letters 22(12): 1255-1261.
- [Bezdek, 1981] Bezdek J.C. Pattern Recognition with Fuzzy Objective Function Algorithms. Plenum Press, 1981.
- [Cheng and Church, 2000] Cheng Y. Church G. Biclus- tering of expression data. Proc. ISMB-2000, 93-103.
- [Bhattacharjee et al., 2001] Bhattacharjee et al. Classifi- cation of human lung carcinomas by mRNA expres- sion profiling reveals distinct adenocarcinoma sub- classes. PNAS 2001 Nov. 20;98(24):13790-5.
- [Kim and Tidor, 2003] Kim P.M., Tidor B. Subsystem identification through dimensionality reduction of large-scale gene expression data. Genome Research 2003 Jul;13(7):1706-18.
- [Brunet et al., 2004] Brunet J.P. et al. Metagenes and molecular pattern discovery using matrix factoriza- tion. PNAS 101(12):4164-9, 2004.
- [Bergmann et al., 2003] Bergmann S, et al. Iterative sig- nature algorithm for the analysis of large-scale gene expression data. Phys. Rev. E. Mar. 2003; 67. IJCAI-07
References were extracted automatically from the PDF and may contain errors.
Full text extracted automatically from the PDF; figures, tables and equations may differ. The PDF is the version of record.
Although clustering is probably the most frequently used tool for data mining gene expression data, existing clustering approaches face at least one of the following problems in this domain: a huge number of variables (genes) as compared to the number of samples, high noise levels, the inability to naturally deal with overlapping clusters, the instability of the resulting clusters w.r.t. the initialization of the algorithm as well as the difficulty in clustering genes and samples simultaneously. In this paper we show that all of these problems can be elegantly dealt with by using nonnegative matrix factorizations to cluster genes and samples simultaneously while allowing for bicluster overlaps and by employing Positive Tensor Factorization to perform a two-way meta-clustering of the biclusters produced in several different clustering runs (thereby addressing the above-mentioned instability). The application of our approach to a large lung cancer dataset proved computationally tractable and was able to recover the histological classification of the various cancer subtypes represented in the dataset.
The recent advent of high-throughput experimental data, especially in molecular biology and genomics, poses new challenges to existing data mining tools. Measuring the expression levels of virtually every gene of a given organism in a given state has become a routine procedure in many research labs worldwide and has also reached the commercial stage in the last decade. Such gene chips, or microarrays, could in principle be used to determine the variation in gene expression profiles responsible for complex diseases, such as cancer. However, the large numbers of genes involved (up to a few tens of thousands) compared to the small number of samples (tens to a few hundreds), as well as the large experimental noise levels pose significant challenges to current data mining tools.
Moreover, most currently used clustering algorithms produce non-overlapping clusters, which represents a serious limitation in this domain, since a gene is typically involved in several biological processes. In this paper we make the biologically plausible simplifying assumption that the overlap of influences (biological processes) is additive
where Xsg is the expression level of gene g in data sample s, while X(s,g ⎢c) is the expression level of g in s due to biological process c. We also assume that X(s,g ⎢c) is multiplicatively decomposable into the expression level Asc of the biological process (cluster) c in sample s and the membership degree Scg of gene g in c:
Fuzzy k-means [Bezdek, 1981] or Nonnegative Matrix Factorization (NMF) [Lee and Seung, 2001] could be used to produce potentially overlapping clusters, but these approaches are affected by the instability of the resulting clusters w.r.t. the initialization of the algorithm. This is not surprising if we adopt a unifying view of clustering as a constrained optimization problem, since the fitness landscape of such a complex problem may involve many different local minima into which the algorithm may get caught when started off from different initial states. Although such an instability seems hard to avoid, we may be interested in the clusters that keep reappearing in the majority of the runs of the algorithm. This is related to the problem of combining multiple clustering systems, which is the unsupervised analog of the classifier combination problem but involves solving an additional so-called cluster correspondence problem, which amounts to finding the best matches between clusters generated in different runs.
The cluster correspondence problem can also be cast as an unsupervised optimization problem, which can be solved by a meta-clustering algorithm. Choosing an appropriate meta-clustering algorithm for dealing with this problem crucially depends on the precise notion of cluster correspondence.
Since a very strict notion of perfect one-to-one correspondence between the clusters of each pair of clustering runs may be too tough to be realized in most practical cases, we could look for clusters that are most similar (although not necessarily identical) across all runs. This is closest to performing something similar to singlelinkage hierarchical clustering on the sets of clusters produced in the various clustering runs, with the additional constraint of allowing in each meta-cluster no more than a single cluster from each individual run. Unfortunately, this constraint will render the meta-clustering algorithm highly unstable. Thus, while trying to address the instability of (object-level) clustering using meta-level clustering, we end up with instability in the meta-clustering algorithm itself. Therefore, a "softer" notion of cluster correspondence is needed.
In a previous paper [Badea, 2005], we have shown that a generalization of NMF called Positive Tensor Factorization [Welling and Weber, 2001] is precisely the tool needed for meta-clustering "soft", potentially overlapping biclusters produced in different clustering runs by fuzzy k-means or NMF. Here we demonstrate that this approach can be successfully used for biclustering a large lung cancer gene expression dataset.
Combining (1) and (2) leads to a reformulation of our clustering problem as a nonnegative factorization of the ns×ng (samples × genes) gene expression matrix X as a product of an ns×nc (samples × clusters) matrix A and an nc×ng (clusters × genes) matrix S:
with the additional nonnegativity constraints:
(Expression levels and membership degrees cannot be negative.) More formally, this can be cast as a constrained optimization problem:
subject to the nonnegativity constraints (4), and could be solved using Lee and Seung's seminal Nonnegative Matrix Factorization (NMF) algorithm [Lee and Seung, 2001] (ε is a small regularization parameter):
NMF(X, A0, S0) → ( A,S)
A ← A0, S ← S0 (typically A0,S0 are initialized randomly) loop until convergence
As explained above, such a factorization can be viewed as a "soft" clustering algorithm allowing for overlapping clusters, since we may have several significant Scg entries on a given column g of S (so a gene g may "belong" to several clusters c).
Allowing for cluster overlap alleviates but does not completely eliminate the instability of clustering, since the optimization problem (5), (4) is non-convex. In particular, the NMF algorithm produces different factorizations (biclusters) (A (i) ,S (i) ) for different initializations, so meta-clustering the resulting "soft" clusters might be needed to obtain a more stable set of clusters. However, using a "hard" meta-clustering algorithm would once again entail an unwanted instability.
In this paper we use Positive Tensor Factorization (PTF) as a "soft" meta-clustering approach able to deal with biclusters. This not only alleviates the instability of a "hard" meta-clustering algorithm, but also produces a "base" set of "bicluster prototypes", out of which all biclusters of all individual runs can be recomposed, despite the fact that they may not correspond to identically reoccurring clusters in all individual runs.
We use NMF for object-level clustering and PTF for meta-clustering. This unified approach solves in an elegant manner both the clustering and the cluster correspondence problem. More precisely, we first run NMF as object-level clustering r times:
where X is the gene expression matrix to be factorized (samples × genes), A (i) (samples × clusters) and S (i) (clusters × genes).
To allow the comparison of membership degrees Scg for different clusters c, we scale the rows of S (i) to unit norm by taking advantage of the scaling invariance of the above factorization (6): A ← A ⋅ D, S ← D-1⋅ S, where D is a positive diagonal matrix with elements = g cg c S d 2 .
Next, we perform meta-clustering of the resulting biclusters (A (i) , S (i) ). This is in contrast with as far as we know all existing meta-clustering approaches, which take only one dimension into account (either the object- or the sample dimension). Although such one-way approaches work well in many cases, they will fail whenever two clusters correspond to very similar sets of genes, while differing along the sample dimension.
In the following, we show that a slight generalization of NMF, namely Positive Tensor Factorization (PTF) [Welling and Weber, 2001] can be successfully used to perform two-way meta-clustering, taking both the gene and the sample dimensions into account.
Naively, one would be tempted to try clustering the biclusters 1 ) ( ) ( i c i c S A ⋅ instead of the gene clusters ) ( i c S , but this is practically infeasible in most real-life datasets because it involves factorizing a matrix of size r⋅ nc × ns⋅ ng. On closer inspection, however, it turns out that it is not necessary to construct this full-blown matrix - actually we are searching for a Positive Tensor Factorization of this matrix 2
1 ) ( i c A is the column c of A (i) , while ) (i c S is the row c of S (i) .
The indices in (7) have the following domains: s - samples, g - genes, c - clusters, k - metaclusters. To simplify the notation, we merge the indices i and c into a single index (ic):
Note that β and γ are the "unified" versions of A (i) and S (i) respectively. More precisely, the columns β⋅k of β and the corresponding rows γk⋅ of γ make up a base set of bicluster prototypes β⋅k⋅γk⋅ out of which all biclusters of all individual runs can be recomposed, while α encodes the (bi)cluster-metacluster correspondence.
Ideally (in case of a perfect one-to-one correspondence of biclusters across runs), we would expect the rows of α to contain a single significant entry α(ic),m(i,c), so that each bicluster ) ( ) ( i c i c S A ⋅ corresponds to a single bicluster proto-
type β⋅m(i,c)⋅ γm(i,c)⋅ (where m(i,c) is a function of i and c):
Additionally, each metacluster m should contain no more than a single bicluster from each run, i.e. there should be no significant entries m ic ), ' ( α and m ic ), " ( α with c'≠ c".
Although it could be easily solved by a hard metaclustering algorithm, such an ideal cluster correspondence is only very seldom encountered in practice, mainly due to the instability of most clustering algorithms. Thus, instead of such a perfect correspondence (8), we settle for a weaker one (7') in which the rows of α can contain several significant entries, so that all biclusters ) ( ) ( i c i c S A ⋅ are recovered as combinations of bicluster prototypes β⋅k⋅γk⋅.
The nonnegativity constraints of PTF meta-clustering are essential both for allowing the interpretation of β⋅k⋅γk. as bicluster prototypes, as well as for obtaining sparse factorizations. (In practice, the rows of α tend to contain typically one or only very few significant entries.)
The factorization (7') can be computed using the following multiplicative update rules:
2 By solving the constrained optimization problem
where '∗' and '--' denote element-wise multiplication and division of matrices, while '⋅' is ordinary matrix multiplication.
After convergence of the PTF update rules, we make the prototype gene clusters directly comparable to each other by normalizing the rows of γ to unit norm, as well as the columns of α such that = c i k ic r , ) ( α (r being the
number of runs) and then run NMF initialized with (β,γ) to produce the final factorization X ≈ A⋅S.
Before addressing real-world gene expression datasets, we evaluated our algorithm on synthetic datasets that match as closely as possible real microarray data. Clusters were modelled using a hidden-variable graphical model, in which each hidden variable Ac corresponds to the cluster of genes influenced by Ac (clusters can overlap since an observable variable Xg can be influenced by several hidden variables Ac).
Since real-world microarray data are log-normally distributed, we sampled the hidden variables from a log2normal distribution with parameters μ=2, σ=0.5, while the influence coefficients Scg between hidden and observable variables were sampled from a uniform distribution over the interval [1,2]. Finally, we added log2-normally distributed noise ε with parameters μnoise=0, σnoise=0.5. Thus we generated our data using the model X = A⋅S +ε.
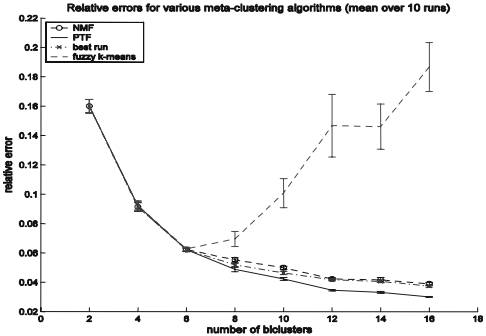
We used nsamples=50, ngenes=100 and a number of genes (respectively samples) per cluster 30 (respectively 15). We compared 4 meta-clustering algorithms (fuzzy kmeans, NMF, PTF and the best run 3 ) over 10 object-level NMF clustering runs. (Other object level clustering methods perform very poorly and are not shown here).
Figures 1-3 below present a comparison of the metaclustering algorithms w.r.t. the number of clusters (ranging from 2 to 16). The Figures depict average values over 10 separate runs of the whole algorithm (with different randomly generated clusters), as well as the associated SEM (Standard Error of the Mean) bars. Note that although all algorithms produce quite low relative errors || || / || || X S A X rel ⋅ - = ε (under 16%) 4 , they behave quite differently when it comes to recovering the original clusters. In a certain way, the match of the recovered clusters with the original ones is more important than the relative error (see [Badea, 2005] for the definition of the match between two sets of possibly overlapping clusters).
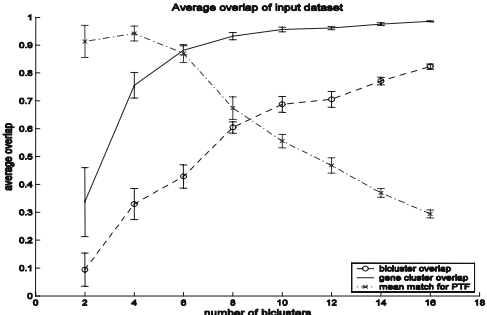
Figure 2 shows that PTF consistently outperforms the other meta-clustering algorithms in terms of recovering the original clusters. Note that since clusters were generated randomly, their overlap increases with their number, so it is increasingly difficult for the meta-clustering algorithm to discern between them, leading to a decreasing match.
3 i.e. the one with the smallest relative error.
4 Except for fuzzy k-means which misbehaves for large numbers of clusters.
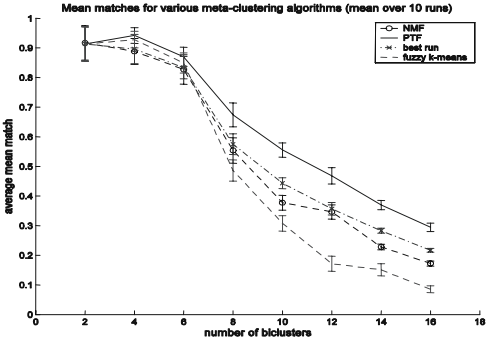
This can be directly seen in Figure 3, where we depict both the cluster overlaps (in the initial data) and the matches of the recovered clusters with the original ones. The inverse correlation between bicluster overlap and matches is obvious (Pearson correlation -0.92).
Among all object-level clustering algorithms tried (kmeans, fuzzy k-means and NMF), only NMF behaves consistently well. The conceptual elegance of the combination of NMF as object-level clustering and PTF as meta-clustering thus pays off in terms of performance.
We applied our meta-clustering approach to a large lung cancer microarray dataset available from the Meyerson lab at Harvard. Using HG-U95Av2 Affymetrix oligonucleotide microarrays, Bhattacharjee et al. [2001] have measured mRNA expression levels of 12600 genes in 186 lung tumor samples (139 adenocarcinomas, 21 squamous cell lung carcinomas, 6 small cell lung cancers, 20 pulmonary carcinoids) and 17 normal lung samples (203 samples in total). Whereas the non-adeno classes are more or less well defined histologically, adenocarcinomas are very heterogeneous, with poorly defined histological and molecular level sub-classifications, despite the large variability in survival times and responsiveness to medication. Therefore, we applied our algorithm to the full dataset and used the histological classification of the non-adeno samples (provided in the supplementary material to the original paper) as a gold standard for the evaluation of the biclustering results.
To eliminate the bias towards genes with high expression values, the gene expression matrix was normalized by separate scalings of the genes to equalize their norms. 5
Although nonnegative factorizations have the advantage of obtaining sparse and easily interpretable decompositions, they cannot directly account for gene downregulation. To deal with gene down-regulation in the context of NMF, we extended the gene expression matrix with new "down-regulated genes" g' = pos(mean(gnormal) - g) associated to the original genes g, where mean(gnormal) is the average of the gene over the normal samples, while pos(⋅) is the Heaviside step function.
To avoid overfitting, we estimated the number of clusters nc as the number of dimensions around which the change in relative error dε /dnc of the factorization of the real data "reaches from above" the change in relative error obtained for a randomized dataset (similar to [Kim and Tidor, 2003]).
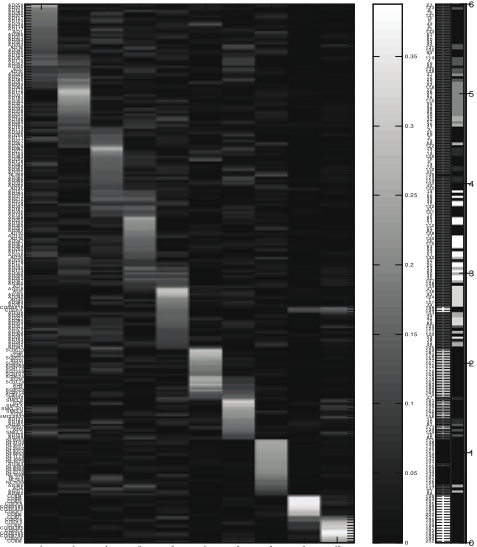
We then used our metaclustering algorithm to factorize the extended gene expression matrix X by running PTF over 20 NMF runs with the number of clusters determined above (nc=10). (The matrix X has 203 rows (samples) and 2×3529=7058 columns (extended genes).) Figure 4 shows the resulting sample cluster matrix A. Note that the algorithm has recovered the non-adeno sample clusters with high accuracy, despite the very large number of variables (genes), many of these potentially irrelevant in this problem. More precisely, the clusters 6, 7, 8 on the diagonal of A correspond to the classes 'squamous', 'small cell' and 'normal' respectively, while clusters 9 and 10 are two subtypes of carcinoids (which, like adenos, are heterogeneous and form two partially overlapping clusters). Note that unlike most clustering methods, our approach allows for overlapping clusters. The accuracy of the sample cluster overlaps can be tested for example in the case of the samples AD341, AD275, AD234 and AD241, which were classified by histopathologists as adeno-squamous and also appear in the overlap of our 'squamous' cluster with other 'adeno' clusters. Similarly, the overlap between the small cell and squamous sample clusters corresponds to mixed small cell-squamous cases, which are mentioned in the literature.
5 Genes with nearly constant and very low expression values (average expression levels<30 and STD<50) had been discarded, leaving 3529 genes that are expressed in the lung cancer samples.
4
5
1
2
7
6
9
8
3
10
Figure 4. The sample clusters (matrix A - normalized columns)
The gene clusters S recovered genes with well known involvement in the lung cancer subtypes under study. For example, the squamous cluster contained numerous keratin genes (keratins 6A, 5, 17, 14, 13, 16, 19), typical for squamous differentiation, the keratinocyte-specific protein stratifin, the p53 tumor suppressor analog TP73L, etc. More details on the gene clusters and a larger version of Figure 4 can be found in the supplementary material at http://www.ai.ici.ro/ijcai07/. (Note that genes with large Scg tend to be differentially expressed between the classes, although the class information was never provided to the algorithm.)
The Table below shows the relative reconstruction errors ε = ||X-A⋅S||F / ||X||F for k-means, fuzzy k-means, 6 NMF and PTF (we display the mean, STD and min errors for 20 clustering runs of each algorithm and clustering dimensions 5, 10, 14 and 20). PTF meta-clustering exhibits slightly smaller relative errors than the best runs of k-means, fuzzy k-means and NMF, and the improvement also increases slightly with the number of clusters.
| nc | k-means mean(STD) | k-means best run | fcm mean(STD) | fcm best run | NMF mean(STD) | NMF best run | PTF |
|---|---|---|---|---|---|---|---|
| 5 | 0.4460 (0.0010) | 0.4445 | 0.4459 (0.0007) | 0.4451 | 0.4408 (0.0004) | 0.44060.4406 | |
| 10 | 0.4247 (0.0030) | 0.4196 | 0.4219 (0.0017) | 0.4184 | 0.4062 (0.0005) | 0.40560.4052 | |
| 14 | 0.4151 (0.0035) | 0.4104 | 0.4111 (0.0025) | 0.4068 | 0.3866 (0.0009) | 0.38550.3849 | |
| 20 | 0.4002 (0.0045) | 0.3936 | 0.3978 (0.0039) | 0.3895 | 0.3642 (0.0006) | 0.3634 | 0.362 |
Fuzzy k-means clustering required a very delicate finetuning of the fuzzy exponent for obtaining non-trivial clusters: we used a fuzzy exponent of 1.1, whereas a slightly higher value of 1.15 produced only trivial, noninformative clusters. However, such a small fuzzy exponent leads to very categorical membership degrees even for very small differences in distance between gene profiles, so the results are similar to those of hard clustering (plain k-means). This is probably due to the different interpretations of cluster overlap in fuzzy k-means and NMF respectively: whereas fuzzy k-means views overlaps in terms of membership degrees, NMF and PTF interpret overlaps as mixtures (as in the case of the adenosquamous samples - see also assumptions (1) and (2) above).
However, much more important than a small improvement in error is the stability of the resulting clusters. All studied methods recovered the non-adeno sample clusters satisfactorily (with differences in the adeno clusters that cannot be judged based on current histological evidence). To study the variability of the gene clusters S in different runs of each algorithm, we computed the average relative differences ||Si-Sj||/||Si|| between pairs of gene cluster matrices Si obtained in 20 different runs (of each algorithm) for nc=10 clusters, as well as the corresponding mismatches between gene clusters matrices. We display the cluster mismatches for progressively larger cutoff thresholds 7 to show that the differences between clusters obtained in different runs involve not just the small, but also the large coefficients of S.
6 For both plain and fuzzy k-means, A is constructed from the cluster membership function, while S is given by the cluster centers.
7 Cluster membership degrees Scg were considered significant if they exceeded the thresholds g g n / 1 0 = θ , 2θ0g and 3θ0g respec-
tively. Note that the rows of S are normalized to unit norm.
| k-means mean(STD) | Fcm mean(STD) | NMF mean(STD) | best NMF mean(STD) | PTF mean(STD) | |
|---|---|---|---|---|---|
| relative differ- ence | 0.1755 (0.0238) | 0.0803 (0.0265) | 0.3117 (0.0599) | 0.1591 (0.0939) | 0.0354 (0.0167) |
| mis- match S>θ0g | 0.1730 (0.0204) | 0.0748 (0.0225) | 0.1457 (0.0296) | 0.0747 (0.0433) | 0.0165 (0.0080) |
| mis- match S>2θ0g | 0.3345 (0.0973) | 0.1354 (0.0987) | 0.2720 (0.0579) | 0.1397 (0.0836) | 0.0269 (0.0130) |
| mis- match S>3θ0g | 0.7121 (0.1658) | 0.3215 (0.1863) | 0.3059 (0.0885) | 0.1228 (0.0738) | 0.0283 (0.0130) |
As the inter-run variability of S is quite large for all clustering methods tried 8 , except PTF (e.g. 31% for NMF with nc=10), using such clustering algorithms for determining gene clusters is highly unreliable. On the other hand, PTF is preferable to the other methods due to its increased stability (only about 3% variability of S).
Moreover, PTF is preferable to fuzzy k-means in clustering gene expression data since it is able to reconstruct gene profiles of samples that represent mixtures of frequently occurring profiles. For example, the Meyerson dataset studied here contains numerous samples with expression profiles similar to a squamous profile SQ, as well as other samples with a different, adeno profile AD (by a gene expression profile we mean a set of gene expression values for all genes represented on the microarray chip). These two different sample groups will lead to two distinct columns of A representing the SQ and AD profiles. However, the Meyerson dataset also contains adeno-squamous samples with a mixed AD + SQ profile, which can be easily represented by NMF and PTF factorizations, but not by fuzzy or plain k-means.
A detailed review of the clustering methods applicable to gene expression data is out of the scope of this paper, due to space constraints. Briefly, our approach is significantly different from other biclustering approaches, such as Cheng and Church's [Cheng and Church, 2000], which is based on a simpler additive model that is not scale invariant (and thus problematic in the case of gene expression data). On the other hand, approaches based on singular value decompositions, or the Iterative Signature Algorithm [Bergmann et al., 2003], tend to produce holistic decompositions as opposed to the more parts-based ones obtained here (holistic decompositions being typically hard to interpret in this domain). Closest to our approach are [Kim and Tidor, 2003] and [Brunet et al., 2004]. Kim and Tidor [2003] used NMF decompositions for analyzing a yeast gene expression compendium, but their approach still suffers from the instability of NMF. On the other hand, Brunet et al. [2004] used NMF for nonoverlapping iterative clustering of samples, rather than biclustering as we do.
8 It also increases with the number of clusters (results not shown).
In this paper we show that nonnegative decompositions such as NMF and PTF can be combined in a non-trivial way to obtain an improved meta-clustering algorithm for gene expression data. The approach deals with overlapping clusters and alleviates the annoying instability of currently used algorithms by using an advanced two-way meta-clustering technique based on tensor (rather than matrix) factorizations.
It is encouraging that PTF recovers the main known lung cancer subtypes, including subtle classifications of certain samples in overlapping classes (adeno-squamous), in a large dataset in which 70% of the samples represent the poorly characterized adenocarcinoma.
And although the improvements in error obtained by PTF are only marginal, it leads to increased stability of the gene clusters (which are extremely important for determining the genes causing the disease). Moreover, PTF proves more adequate in this domain than other methods like fuzzy k-means, due to its interpretation of cluster overlaps as mixtures, fuzzy k-means being extremely sensitive to minute changes in the fuzzy exponent.
- [Badea, 2005] Badea L. Clustering and metaclustering with Nonnegative Matrix Decomposition. Proc. ECML-05, LNAI 3720, pp. 10-22.
- [Lee and Seung, 2001] Lee D.D., H.S. Seung. Algorithms for non-negative matrix factorization. Proc. NIPS*2000, MIT Press, 2001.
- [Welling and Weber, 2001] Welling M., Weber M. Positive tensor factorization. Pattern Recognition Letters 22(12): 1255-1261.
- [Bezdek, 1981] Bezdek J.C. Pattern Recognition with Fuzzy Objective Function Algorithms. Plenum Press, 1981.
- [Cheng and Church, 2000] Cheng Y. Church G. Biclustering of expression data. Proc. ISMB-2000, 93-103.
- [Bhattacharjee et al., 2001] Bhattacharjee et al. Classification of human lung carcinomas by mRNA expression profiling reveals distinct adenocarcinoma subclasses. PNAS 2001 Nov. 20;98(24):13790-5.
- [Kim and Tidor, 2003] Kim P.M., Tidor B. Subsystem identification through dimensionality reduction of large-scale gene expression data. Genome Research 2003 Jul;13(7):1706-18.
- [Brunet et al., 2004] Brunet J.P. et al. Metagenes and molecular pattern discovery using matrix factorization. PNAS 101(12):4164-9, 2004.
- [Bergmann et al., 2003] Bergmann S, et al. Iterative signature algorithm for the analysis of large-scale gene expression data. Phys. Rev. E. Mar. 2003; 67.
@inproceedings{ijcai2007p426,
  title     = {Stable Biclustering of Gene Expression Data with Nonnegative Matrix Factorizations},
  author    = {Badea, Liviu and Tilivea, Doina},
  booktitle = {Proceedings of the Twentieth International Joint Conference on
               Artificial Intelligence, {IJCAI-07}},
  publisher = {International Joint Conferences on Artificial Intelligence},
  editor    = {Manuela M. Veloso},
  pages     = {2651--2655},
  year      = {2007},
  url       = {https://ijcai.org/proceedings/2007/426},
}
TY - CPAPER TI - Stable Biclustering of Gene Expression Data with Nonnegative Matrix Factorizations AU - Badea, Liviu AU - Tilivea, Doina T2 - Proceedings of the Twentieth International Joint Conference on Artificial Intelligence, IJCAI-07 PB - International Joint Conferences on Artificial Intelligence PY - 2007 SP - 2651 EP - 2655 UR - https://ijcai.org/proceedings/2007/426 ER -Copied
Machine-readable versions of this paper, for tools and AI agents:





