
Stepwise Nearest Neighbor Discriminant Analysis
Proceedings of the Nineteenth International Joint Conference on Artificial Intelligence. Pages 829-833.
© 2005 International Joint Conferences on Artificial Intelligence
Abstract
Linear Discriminant Analysis (LDA) is a popular feature extraction technique in statistical pattern recognition. However, it often suffers from the small sample size problem when dealing with the high dimensional data. Moreover, while LDA is guaranteed to find the best directions when each class has a Gaussian density with a common covariance matrix, it can fail if the class densities are more general. In this paper, a new nonparametric feature extraction method, stepwise nearest neighbor discriminant analysis(SNNDA), is proposed from the point of view of the nearest neighbor classification. SNNDA finds the important discriminant directions without assuming the class densities belong to any particular parametric family. It does not depend on the nonsingularity of the within-class scatter matrix either. Our experimental results demonstrate that SNNDA outperforms the existing variant LDA methods and the other stateof-art face recognition approaches on three datasets from ATT and FERET face databases.
- [Belhumeur et al., 1997] P.N. Belhumeur, J. Hespanda, and D. Kiregeman. Eigenfaces vs. Fisherfaces: Recognition using class specific linear projection. IEEE Transactions on Pattern Analysis and Machine Intelligence, 19(7):711- 720, 1997.
- [Bressan and Vitrià, 2003] M. Bressan and J. Vitrià. Nonparametric discriminant analysis and nearest neighbor classification. Pattern Recognition Letters, 24:2743C2749, 2003.
- [Chen et al., 2000] L. Chen, H. Liao, M. Ko, J. Lin, and G. Yu. A new LDA-based face recognition system which can solve the small sample size problem. Pattern Recog- nition, 33(10):1713-1726, 2000.
- [Duda et al., 2001] R. O. Duda, P. E. Hart, and D. G. Stork. Pattern classification. Wiley, New York, 2nd edition, 2001.
- [Fukunaga and Mantock, 1983] K. Fukunaga and J. Man- tock. Nonparametric discriminant analysis. IEEE Trans- actions on Pattern Analysis and Machine Intelligence, 5:671C678, 1983.
- [Fukunaga, 1990] K. Fukunaga. Introduction to statistical pattern recognition. Academic Press, Boston, 2nd edition, 1990.
- [Hastie and Tibshirani, 1996] T. Hastie and R. Tibshirani. Discriminant adaptive nearest neighbor classification. IEEE Transactions on Pattern Analysis and Machine In- telligence, 18:607C616, 1996.
- [Hastie et al., 2001] T. Hastie, R. Tibshirani, and J. Fried- man. The Elements of Statistical Learning. Springer, New York, 2001.
- [Li et al., 2003] H.F. Li, T. Jiang, and K.S. Zhang. Efficient and robust feature extraction by maximum margin crite- rion. In Proc. of Neural Information Processing Systems, 2003.
- [Liu et al., 1992] K. Liu, Y. Cheng, and J. Yang. A general- ized optimal set of discriminant vectors. Pattern Recogni- tion, 25(7):731C739, 1992.
- [Moghaddam et al., 2000] B. Moghaddam, T. Jebara, and A. Pentland. Bayesian face recognition. Pattern Recog- nition, 33:1771-1782, 2000.
- [Phillips et al., 1998] P.J. Phillips, H. Wechsler, J. Huang, and P. Rauss. The feret database and evaluation proce- dure for face recognition algorithms. Image and Vision Computing, 16(5):295-306, 1998.
- [Samaria and Harter, 1994] Ferdinando Samaria and Andy Harter. Parameterisation of a stochastic model for human face identification. In Proc. of 2nd IEEE Workshop on Ap- plications of Computer Vision, 1994.
- [Turk and Pentland, 1991] M. Turk and A. Pentland. Eigen- faces for recognition. Journal of Cognitive Neuroscience, 3(1):71-86, 1991.
- [Yang and Yang, 2003] J. Yang and J.Y. Yang. Why can LDA be performed in PCA transformed space? Pattern Recognition, 36:563-566, 2003.
- [Yu and Yang, 2001] H. Yu and J. Yang. A direct LDA al- gorithm for high-dimensional data with application to face recognition. Pattern Recognition, 34:2067-2070, 2001.
References were extracted automatically from the PDF and may contain errors.
Full text extracted automatically from the PDF; figures, tables and equations may differ. The PDF is the version of record.
1 Introduction
The curse of high-dimensionality is a major cause of the practical limitations of many pattern recognition technologies, such as text classification and object recognition. In the past several decades, many dimensionality reduction techniques have been proposed. Linear discriminant analysis (LDA) [Fukunaga, 1990] is one of the most popular supervised methods for linear dimensionality reduction. In many applications, LDA has been proven to be very powerful.
The purpose of LDA is to maximize the between-class scatter while simultaneously minimizing the within-class scatter. It can be formulated by Fisher Criterion:
where W is a linear transformation matrix, Sb is the betweenclass scatter matrix and Sw is the within-class scatter matrix.
∗The support of NSF of China (69935010) and (60435020) is acknowledged.
A major drawback of LDA is that it often suffers from the small sample size problem when dealing with the high dimensional data. When there are not enough training samples, Sw may become singular, and it is difficult to compute the LDA vectors. For example, a 100 × 100 image in a face recognition system has 10000 dimensions, which requires more than 10000 training data to ensure that Sw is nonsingular. Several approaches[Liu et al., 1992; Belhumeur et al., 1997; Chen et al., 2000; Yu and Yang, 2001] have been proposed to address this problem. A common problem with all these proposed variant LDA approaches is that they all lose some discriminative information in the high dimensional space.
Another disadvantage of LDA is that it assumes each class has a Gaussian density with a common covariance matrix. LDA guaranteed to find the best directions when the distributions are unimodal and separated by the scatter of class means. However, if the class distributions are multimodal and share the same mean, it fails to find the discriminant direction[Fukunaga, 1990]. Besides, the rank of Sb is c - 1, where c is the number of classes. So the number of extracted features is, at most, c - 1. However, unless a posteriori probability function are selected, c - 1 features are suboptimal in Bayes sense, although they are optimal with regard to Fisher criterion [Fukunaga, 1990].
In this paper, a new feature extraction method, stepwise nearest neighbor discriminant analysis(SNNDA), is proposed. SNNDA is a linear feature extraction method in order to optimize nearest neighbor classification (NN). Nearest neighbor classification [Duda et al., 2001] is an efficient method for performing nonparametric classification and often used in the pattern classification field, especially in object recognition. Moreover, the NN classifier has a close relation with the Bayes classifier. However, when nearest neighbor classification is carried out in a high-dimensional feature space, the nearest neighbors of a point can be very far away, causing bias and degrading the performance of the rule [Hastie et al., 2001]. Hastie and Tibshirani [Hastie and Tibshirani, 1996] proposed a discriminant adaptive nearest neighbor (DANN) metric to stretch the neighborhood in the directions in which the class probabilities don't change much, but their method also suffers from the small sample size problem.
SNNDA can be regarded as an extension of nonparametric discriminant analysis[Fukunaga and Mantock, 1983], but it doesn't depend on the nonsingularity of the within-class scatter matrix. Moreover, SNNDA finds the important discriminant directions without assuming the class densities belong to any particular parametric family.
The rest of the paper is organized as follows: Section 2 gives the review and analysis of the current existing variant LDA methods. Then we describe stepwise nearest neighbor discriminant analysis in Section 3. Experimental evaluations of our method, existing variant LDA methods and the other state-of-art face recognition approaches are presented in Section 4. Finally, we give the conclusions in Section 5.
2 Review and Analysis of Variant LDA Methods
The purpose of LDA is to maximize the between-class scatter while simultaneously minimizing the within-class scatter.
The between-class scatter matrix Sb and the within-class scatter matrix Sw are defined as
where c is the number of classes; mi and pi are the mean vector and a priori probability of class i, respectively; m = ∑ci=1 pimi is the total mean vector; Si is the covariance matrix of class i.
LDA method tries to find a set of projection vectors W ∈ RD×d maximizing the ratio of determinant of Sb to Sw,
where D and d are the dimensionalities of the data before and after the transformation respectively.
From Eq.(4), the transformation matrix W must be constituted by the d eigenvectors of S-1 w Sb corresponding to its first d largest eigenvalues [Fukunaga, 1990].
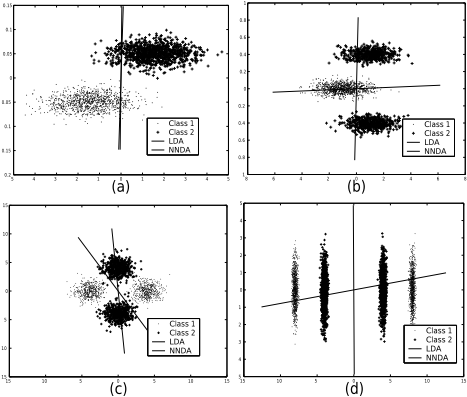
However, when the small sample size problem occurs, Sw becomes singular and S-1 w does not exist. Moreover, if the class distributions are multimodal or share the same mean (for example, the samples in (b),(c) and (d) of Figure 2), it can fail to find the discriminant direction[Fukunaga, 1990]. Many methods have been proposed for solving the above problems. In following subsections, we give more detailed review and analysis of these methods.
2.1 Methods Aimed at Singularity of Sw
In recent years, many researchers have noticed the problem about singularity of Sw and tried to overcome the computational difficulty with LDA.
To avoid the singularity of Sw, a two-stage PCA+LDA approach is used in [Belhumeur et al., 1997]. PCA is first used to project the high dimensional face data into a low dimensional feature space. Then LDA is performed in the reduced PCA subspace, in which Sw is non-singular. But this method is obviously suboptimal due to discarding much discriminative information.
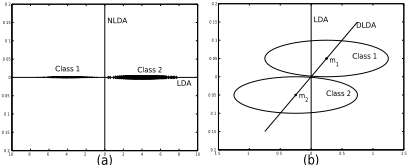
Liu et al. [Liu et al., 1992] modified Fisher's criterion by using the total scatter matrix St = Sb + Sw as the denominator instead of Sw. It has been proven that the modified criterion is exactly equivalent to Fisher criterion. However, when Sw is singular, the modified criterion reaches the maximum value, namely 1, for any transformation W in the null space of Sw. Thus the transformation W cannot guarantee the maximum class separability |W T SbW| is maximized. Besides, this method still needs to calculate an inverse matrix, which is time consuming. Chen et al. [Chen et al., 2000] suggested that the null space spanned by the eigenvectors of Sw with zero eigenvalues contains the most discriminative information. A LDA method (called NLDA)in the null space of Sw was proposed. It chooses the projection vectors maximizing Sb with the constraint that Sw is zero. But this approach discards the discriminative information outside the null space of Sw. Figure 1(a) shows that the null space of Sw probably contains no discriminant information. Thus, it is obviously suboptimal because it maximizes the between-class scatter in the null space of Sw instead of the original input space. Besides, the performance of the NLDA drops significantly when N - c is close to the dimension D, where N is the number of samples and c is the number of classes. The reason is that the dimensionality of the null space is too small in this situation and too much information is lost [Li et al., 2003]. Yu et al. [Yu and Yang, 2001]proposed a direct LDA (DLDA) algorithm, which first removes the null space of Sb. They assume that no discriminative information exists in this space. Unfortunately, it be shown that this assumption is incorrect. Fig.1(b) demonstrates that the optimal discriminant vectors do not necessarily lie in the subspace spanned by the class centers.
2.2 Methods Aimed at Limitations of Sb
When the class conditional densities are multimodal, the class separability represented by Sb is poor. Especially in the case that each class shares the same mean, it fails to find the discriminant direction because there is no scatter of the class means[Fukunaga, 1990].
Notice the rank of Sb is c - 1, so the number of extracted features is, at most, c - 1. However, unless a posteriori probability function are selected, c - 1 features are suboptimal in Bayes sense, although they are optimal with regard to Fisher criterion [Fukunaga, 1990].
In fact, if classification is the ultimate goal, we need only estimate the class density well near the decision boundary[Hastie et al., 2001].
Fukunaga and Mantock [Fukunaga and Mantock, 1983] presented a nonparametric discriminant analysis (NDA) in an attempt to overcome these limitations presented in LDA. In nonparametric discriminant analysis the between-class scatter Sb is of nonparametric nature. This scatter matrix is generally full rank, thus loosening the bound on extracted feature dimensionality. Also, the nonparametric structure of this matrix inherently leads to the extracted features that preserve relevant structures for classification. Bressan et al. [Bressan and Vitri`a, 2003] explored the nexus between nonparametric discriminant analysis (NDA) and the nearest neighbors (NN) classifier and gave a slight modification of NDA which extends the two-class NDA to a multi-class version.
Although these nonparametric methods overcomes the limitations of Sb, they still depend on the singularity of Sw(or ˆ Sw). The rank of ˆ Sw must be no more than N - c.
3 Stepwise Nearest Neighbor Discriminant Analysis
In this section, we propose a new feature extraction method, stepwise nearest neighbor discriminant analysis(SNNDA). SNNDA also uses nonparametric between-class and withinclass scatter matrix. But it does not depend on singularity of within-class scatter matrix and improves the performance of NN classifier.
3.1 Nearest Neighbor Discriminant Analysis Criterion
Assuming a multi-class problem with classes ωi(i = 1, . . . , c), we define the extra-class nearest neighbor for a sample x ∈ ωi as
In the same fashion, the set of intra-class nearest neighbors are defined as
The nonparametric extra-class and intra-class differences are defined as
.
The nonparametric between-class and within-class scatter matrix are defined as
where wn is the sample weight defined as
where α is a control parameter between zero and infinity. This sample weight is introduced to deemphasize the samples in the class center and give emphases to the samples near to the other class. The sample that has a larger ratio between the nonparametric extra-class and intra-class differences is given an undesirable influence on the scatter matrix. The sample weights in Eq.(11) take values close to 0.5 near the classification boundaries and drop to zero as we move to class center. The control parameter α adjusts how fast this happens. In this paper, we set α = 6.
From the Eq.(7) and (8), we can see that ||∆En || represents the distance between the sample xn and its nearest neighbor in the different classes, and ||∆In || represents the distance between the sample xn and its nearest neighbor in the same class. Given a training sample xn, the accuracy of the nearest neighbor classification can be directly computed by examining the difference
where ∆E and ∆I are nonparametric extra-class and intraclass differences and defined in Eq.(7) and (8).
If the difference Θn is more than zero, xn will be correctly classified. Otherwise, xn will be classified to the false class. The larger the difference Θn is, the more accurately the sample xn is classified.
Assuming that we extract features by the D×d linear projection matrix W with a constraint that W T W is an identity matrix, the projected sample xnew = W T x. The projected nonparametric extra-class and intra-class differences can be written as δE = W T ∆E and δI = W T ∆I . So we expect to find the optimal W to make the difference ||δE n ||2 -||δIn ||2 in the projected subspace as large as possible.
This optimization problem can be interpreted as: find the linear transform that maximizes the distance between classes, while minimizing the expected distance among the samples of a single class.
Considering that,
where tr(·) is the trace of matrix, ˆ Sb and ˆ Sw are the nonparametric between-class and within-class scatter matrix, as defined in Eq.(9) and (10).
So Eq.(13) is equivalent to
We call Eq.(15) the nearest neighbor discriminant analysis criterion(NNDA).
The projection matrix ̂ W must be constituted by the d eigenvectors of ( ˆ Sb - ˆ Sw) corresponding to its first d largest eigenvalues.
Figure 2 gives comparisons between NNDA and LDA. When the class density is unimodal ((a)), NNDA is approximately equivalent to LDA. But in the cases that the class density is multimodal or that all the classes share the same mean ((b),(c) and (d)), NNDA outperforms LDA greatly.
3.2 Stepwise Dimensionality Reduction
In the analysis of the nearest neighbor discriminant analysis criterion, notice that we calculate nonparametric extra-class and intra-class differences (∆E and ∆I ) in original high dimensional space, then project them to the low dimensional space (δE = W T ∆E and δI = W T ∆I ), which does not exactly agree with the nonparametric extra-class and intra-class differences in projection subspace except for the orthonormal transformation case, so we have no warranty on distance preservation. A solution for this problem is to find the projection matrix ̂ W by stepwise dimensionality reduction method. In each step, we re-calculate the nonparametric extra-class and intra-class differences in its current dimensionality. Thus, we keep the consistency of the nonparametric extra-class and intra-class differences in the process of dimensionality reduction.
Figure 3 gives the algorithm of stepwise nearest neighbor discriminant analysis.
- Give D dimensional samples {x1, · · · , xN}, we expect to find d dimensional discriminant subspace.
- Suppose that we find the projection matrix ̂ W via T steps, we reduce the dimensionality of samples to dt in step t, and dt meet the conditions: dt-1 > dt > dt+1, d0 = D and dT = d.
- For t = 1, · · · , T
- Calculate the nonparametric between-class ˆ St b and within-class scatter matrix ˆ Stw in the current dt-1 dimensionality,
- Calculate the projectionmatrix̂ Wt, ̂ Wt is dt-1×dt matrix.
- Project the samples by the projection matrix ̂ Wt , x = ̂ W T t ×x.
- The final transformation matrix ̂ W = ∏Tt=1 ̂ Wt.
Figure 3: Stepwise Nearest Neighbor Discriminant Analysis
3.3 Discussions
SNNDA has an advantage that there is no need to calculate the inverse matrix, so it is a more efficient and stable method. Moreover, though SNNDA optimizes the 1-NN classification, it is easy to extend it to the case of k-NN.
However, a drawback of SNNDA is the computational inefficiency in finding the neighbors when the original data space is high dimensionality. A improved method is that PCA is first used to reduce the dimension of data to N-1 (the rank of the total scatter matrix) through removing the null space of the total scatter matrix. Then, SNNDA is performed in the transformed space. Yang et al. [Yang and Yang, 2003] shows that no discriminant information is lost in this transformed space.
4 Experiments
In this section, we apply our method to face recognition and compare it with the existing variant LDA methods and the other state-of-art face recognition approaches, such as PCA [Turk and Pentland, 1991], PCA+LDA [Belhumeur et al., 1997], NLDA [Chen et al., 2000], NDA [Bressan and Vitri`a, 2003] and Bayesian [Moghaddam et al., 2000] approaches. All the experiments are repeated 5 times independently and the average results are calculated.
4.1 Datasets
To evaluate the robustness of SNNDA, we perform the experiments on three datasets from the popular ATT face database [Samaria and Harter, 1994] and FERET face database [Phillips et al., 1998]. The descriptions of the three datasets are below:
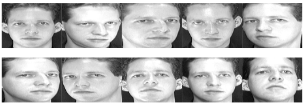
ATT Dataset This dataset is the ATT face database (formerly 'The ORL Database of Faces'), which contains 400 images (112 × 92) of 40 persons, 10 images per person. The images are taken at different times, varying lighting slightly, facial expressions (open/closed eyes, smiling/non-smiling) and facial details (glasses/no-glasses). Each image is linearly stretched to the full range of pixel values of [0,255]. Fig.4 shows some face examples in this database. The set of the 10 images for each person is randomly partitioned into a training subset of 5 images and a test set of the other 5. The training set is then used to learn basis components, and the test set for evaluate.
FERET Dataset 1 This dataset is a subset of the FERET database with 194 subjects only. Each subject has 3 images: (a) one taken under controlled lighting condition with a neutral expression; (b) one taken under the same lighting condition as above but with different facial expressions (mostly smiling); and (c) one taken under different lighting condition and mostly with a neutral expression. All images are pre-processed using zeromean-unit-variance operation and manually registered using the eye positions. All the images are normalized by the eye locations and are cropped to the size of 75 × 65. A mask template is used to remove the background and the hair. Histogram equalization is applied to the face images for photometric normalization. Two images for each person is randomly selected for training and the rest one is used for test.
FERET Dataset 2 This dataset is a different subset of the FERET database. All the 1195 people from the FERET Fa/Fb data set are used in the experiment. There are two face images for each person. This dataset has no overlap between the training set and the galley/probe set according to the FERET protocol [Phillips et al., 1998]. 500 people are randomly selected for training, and the remaining 695 people are used for testing. For each testing people, one face image is in the gallery and the other is for probe. All images are pre-processed by using the same method in FERET Dataset 1.
4.2 Experimental Results
Fig. 5 shows the rank-1 recognition rates with the different number of features on the three different datasets. It is shown that SNNDA outperforms the other methods. The recognition rate of SNNDA can reach almost 100% on ATT dataset.
The recognition rate of SNNDA have reached 100% on two FERET dataset surprisedly when the dimensionality of samples is about 20, while the other methods have poor performances in the same dimensionality. Moreover, SNNDA does not suffer from overfitting. Except SNNDA and PCA, the rank-1 recognition rates of the other methods have a descent when the dimensionality increases continuously.
Fig. 6 shows cumulative recognition rates on the three different datasets. From it, we can see that none of the cumulative recognition rates can reach 100% except SNNDA.
When dataset contains the changes of lighting condition (such as FERET Dataset 1), SNNDA also has obviously better performance than the others.
Different from ATT dataset and FERET dataset 1, where the class labels involved in training and testing are the same, the FERER dataset 2 has no overlap between the training set and the galley/probe set according to the FERET protocol [Phillips et al., 1998]. The ability of generalization from known subjects in the training set to unknown subjects in the gallery/probe set is needed for each method. Thus, the result on FERET dataset 2 is more convincing to evaluate the robust of each method. We can see that SNNDA also gives the best performance than the other methods on FERET dataset 2.
A major character, displayed by the experimental results, is that SNNDA always has a stable and high recognition rates on the three different datasets, while the other methods have unstable performances.
5 Conclusion
In this paper, we proposed a new feature extraction method, stepwise nearest neighbor discriminant analysis(SNNDA), which finds the important discriminant directions without assuming the class densities belong to any particular parametric family. It does not depend on the nonsingularity of the within-class scatter matrix either. Our experimental results on the three datasets from ATT and FERET face databases demonstrate that SNNDA outperforms the existing variant LDA methods and the other state-of-art face recognition approaches greatly. Moreover, SNNDA is very efficient, accurate and robust. In the further works, we will extend SNNDA to non-linear discriminant analysis with the kernel method. Another attempt is to extend SNNDA to the k-NN case.
@inproceedings{ijcai2005p107,
  title     = {Stepwise Nearest Neighbor Discriminant Analysis},
  author    = {Qiu, Xipeng and Wu, Lide},
  booktitle = {Proceedings of the Nineteenth International Joint Conference on
               Artificial Intelligence, {IJCAI-05}},
  publisher = {International Joint Conferences on Artificial Intelligence},
  editor    = {Leslie Pack Kaelbling and Alessandro Saffiotti},
  pages     = {829--833},
  year      = {2005},
  url       = {https://ijcai.org/proceedings/2005/107},
}
TY - CPAPER TI - Stepwise Nearest Neighbor Discriminant Analysis AU - Qiu, Xipeng AU - Wu, Lide T2 - Proceedings of the Nineteenth International Joint Conference on Artificial Intelligence, IJCAI-05 PB - International Joint Conferences on Artificial Intelligence PY - 2005 SP - 829 EP - 833 UR - https://ijcai.org/proceedings/2005/107 ER -Copied
Machine-readable versions of this paper, for tools and AI agents:





