
An Evaluation of Criteria for Measuring the Quality of Clusters
Proceedings of the Sixteenth International Joint Conference on Artificial Intelligence. Natural Language Processing. Pages 905-909.
© 1999 International Joint Conferences on Artificial Intelligence
Abstract
An important problem in clustering is how to decide what is the best set of clusters for a given data set, in terms of both the number of clusters and the membership of those clusters. In this paper we develop four criteria for measuring the quality of different sets of clusters. These criteria are designed so that different criteria prefer cluster sets that generalise at different levels of granularity. We evaluate the suitability of these criteria for non-hierarchical clustering of the results returned by a search engine. We also compare the number of clusters chosen by these criteria with the number of clusters chosen by a group of human subjects. Our results demonstrate that our criteria match the variability exhibited by human subjects, indicating there is no single perfect criterion. Instead, it is necessary to select the correct criterion to match a human subject's generalisation needs.
- [Davies et al., 1996] N. Davies, R. Weeks and M . Revett. Information Agents for the World Wide Web. In BT Tech- nology Journal, 14(4), pp. 105-114, 1996.
- Dubes and Jain 1979]
- R. Dubes and A. K. Jain. Validity Studies in Clustering Methodologies. In Pattern Recogni- tion, 11, pp. 235-254, 1979.
- [Leouski and Croft, 1996] A. Leouski and W. B. Croft. An Evaluation of Techniques for Clustering Search Results. CIIR Technical Report IR-76, Computer Science Depart- ment, University of Massachusetts at Amherst, 1996.
- [Macskassy et al., 1998] S. Macskassy, A. Banerjee, B. Dav- ison and H. Hirsh. Human Performance on Clustering Web Pages: A Preliminary Study. In Proceedings of the Fourth International Conference on Knowledge Discovery and Data Mining (KDD-98), pp. 264-268, 1998.
- [Milligan and Cooper, 1985] G. Milligan and M. Cooper. An Examination of Procedures for Determining the Number of Clusters in a Data Set. In Psychometrika, 50, pp. 159- 179, 1985.
- [Oliver et al., 1996] J. Oliver, R. Baxter and C. Wallace. Unsupervised Learning Using MML. In Proceedings of the Thirteenth International Conference on Machine Learning (/CML-96), pp. 364-372, 1996.
- [Rasmussen, 1992] E. Rasmussen. Clustering Algorithms. In Information Retrieval (W. B. Frakes and R. Baeza-Yates ed.), Prentice-Hall, New Jersey, 1992.
- [Rus and de Santis, 1997] D. Rus and P. de Santis. The Self- Organizing Desk. In Proceedings of the Fifteenth Interna- tionl Joint Conference on Artificial Intelligence (/JCA/- 97), pp. 758-763, 1997.
- [Salton, 1971] G. Salton (ed). The SMART Retrieval System- Experiments in Automatic Document Processing, Pren- tice-Hall, New Jersey, 1971.
- [Zamir and Etzioni, 1998] Zamir and 0. Etzioni. Web Document Clustering: A Feasibility Demonstration. In Proceedings of the Twenty-First International ACM SIGIR Conference, pp. 46-54, 1998.
References were extracted automatically from the PDF and may contain errors.
Full text extracted automatically from the PDF; figures, tables and equations may differ. The PDF is the version of record.
1 Introduction
An important problem in clustering is how to decide what is the best set of clusters for a given data set, in terms of both the number of clusters and the membership of those clusters. In this paper we present an empirical evaluation of four crite ria for measuring the quality of different sets of clusters. In particular, we demonstrate how these criteria can be applied to non-hierarchical clustering of search engine results.
The focus of our work is the problem of document cluster ing,_ which is ~ ~ajor application of clustering techniques. While the feastblitty of document clustering has been dem onstrated since the 1970's (Salton 1971), in recent years there has been a growth in applications for this technology. Example applications include personal document manage ment (Rus and de Santis 1997), sharing information between a community of users (Davies et al. 1996), and clustering search results (Leouski and Croft 1996, Zamir and Etzioni 1998). In all of these applications, it is not known a priori how many clusters exist in the document set. One way around this problem is to find a fixed number of clusters. However, this imposes artificial constraints on the search for structure in a document set. A different approach is to search for alternative sets of clusters, and apply a quality criterion to decide which is the best partition of a document set.
The three main contributions of our work are as follows . We have ?eveloped four criteria for determining the quality of clustenng. We have evaluated the sensitivity of these cri ter!a in a practical document clustering application, i.e., clus tenng the results returned by a search engine. We have compared these results with the number of clusters chosen by a group of 10 human subjects. We begin in the next sec tion by describing the problem of document clustering in more detail. In Section 3, we describe the four criteria we have developed for evaluating the quality of clusters. We then provide the results of an empirical evaluation of our cri teria in Sections 4 and 5. Finally, in Section 6 we compare our approach to related work in the area of clustering.
2 Document Clustering
The context of our work is the development of tools for clus tering the results returned by search engines on the Internet. When a search engine is given a query, e.g., 'agents', it responds with a set of search results R;. Each search result is a sho.rt description of a web page that matches the query. In practice, a large number of results are returned, and the user is faced with the daunting task of filtering out irrelevant results. These irrelevant results arise because the query terms ~an a_ppear in many different contexts, e.g. , travel agents or mtelhgent agents. Even within a single context there can be multiple sub-topics, e.g., intelligent agent software or intelli gent agent conferences. Consequently, we are interested in automatically clustering related search results so users can easily explore the underlying topics that match their query.
In order to solve this problem we have followed the stand ard model for document clustering as developed by Salton (1971). This model has three main features. First, each docu ment is represented by a vector of word frequencies, where c_ommonly ?c~urring words have been excluded using a stop hst or heunsttc feature selection techniques. Second, a dis tance measure is defined as a function of these document vectors, so that we can quantify the similarity or distance between any pair of documents in the vector space. Finally, a clustering algorithm uses this distance measure to group related documents into clusters.
The clustering algorithm groups the search results R; into a ~et of clusters cj" It is important that clusters can be qmckly generated, and easily scanned by the user. Conse quently, we have used a non-hierarchical, single-pass clustering algorithm (Rasmussen 1992). We use this clustering algorithm to assign each result R; to a single cluster, so there is no overlap between clusters. Therefore, the clusters form a partition of the document space, which we refer to as P. In principle, a result could be assigned to multiple clusters. However, this can make it harder to characterise and differ entiate clusters.
The clustering algorithm proceeds as follows. The first search result R 1 is used to initialise the first cluster C1. For each of the remaining results R;. we need to assign R; to the nearest cluster, or start a new cluster if none is sufficiently close. In order to compare a result R; to a cluster c 1 , we rep resent c 1 by its centroid. The centroid of c 1 is the average of the word frequency vectors corresponding to the results that have already been assigned to c 1 . We can then calculate the distance between R; and the centroid of each class c 1 . If the distance to the closest cluster centroid is less than a threshold T, then we assign R; to that cluster and update its centroid. Otherwise, all clusters are a distance greater than T from the search result, so we create a new cluster using R;.
Using this algorithm we can generate different partitions by varying the threshold T. Large threshold values will result in a small number of general clusters, while small threshold values produce a larger number of more specific classes. Consequently, we can explore a range of different partitions by stepping through different values of T. This raises the question of which is the best partition, i.e., how do we judge whether one partition better reflects the inherent similarities of the search results than another?
3 Four Quality Criteria for Clustering
In order to determine the quality of a partition, we have defined criteria that evaluate a partition with respect to the following measures described in Dubes and Jain (1979):
- Compactness - This is a measure of cohesion or unique ness of objects in an individual cluster with respect to the other objects outside the cluster, e.g., the average similar ity of objects within the cluster. The greater the similarity, the greater the compactness.
- Isolation - This is a measure of distinctiveness or separa tion between a cluster and the rest of the world, e.g. , high est similarity to an object outside the cluster. The smaller the similarity, the greater the isolation.
Ideally, we need to generate partitions that have compact, well-separated clusters. Hence, our criteria combine the two measures to return a value that indicates the quality of the partition. The value returned is minimised when the partition is judged to consist of compact well-separated clusters, with different criteria judging different partitions as the best one.
In each of our criteria, we have used a simple similarity/ distance based measure to evaluate compactness and isola tion, rather than statistical tests of significance used in multi variate analysis of variance. This is done both for computational efficiency and due to the inadequacy of MANOVA tests to provide quantitative measures of cluster validity (Dubes and Jain 1979).
In our discussion of each of the criteria, R; represents an object or search result, c 1 represents a cluster and Cjc its cen troid. Gc is the global centroid. S(R;.R,J is the similarity between two search results R; and Rk> where R; and Rk are represented by their frequency vectors, and their similarity is calculated using the cosine coefficient (Rasmussen 1992). D( R;,R,J represents the distance or dissimilarity measure and is calculated as 1 - S( R;,Rk).
3.1 Minimum Total Distance (CJ)
In this criterion, we minimize the total of the sum of dis tances of objects to their cluster centroids and the sum of the distances of the cluster centroids from the global centroid. The value for each partition is computed as follows:
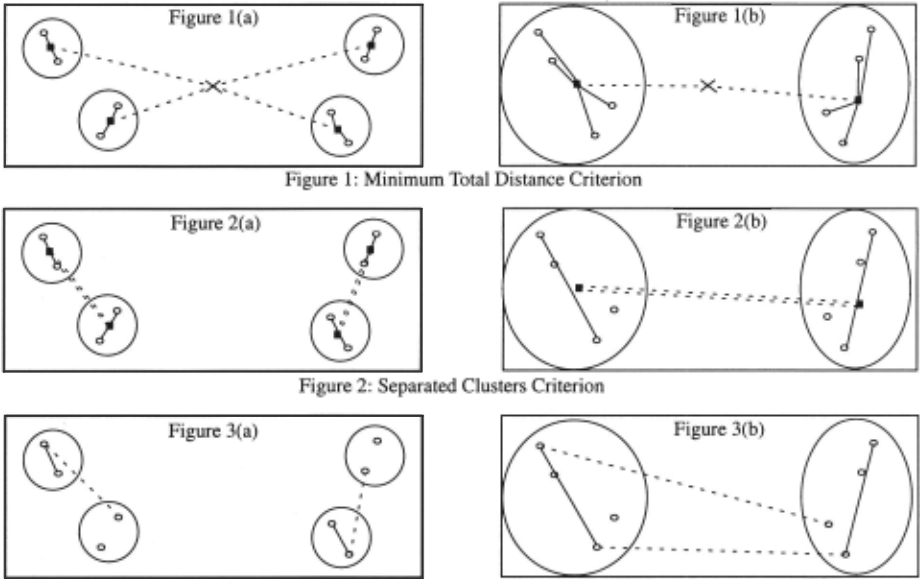
The first term is the intra-cluster distance (solid lines in Figure 1) and represents the compactness of clusters. It is small when the objects are close to their cluster centroids, e.g., when there are a few compact clusters (Figure la) and increases as the number of clusters decreases and the clusters are spread out (Figure lb). The maximum value is reached when the number of clusters is 1.
The second term is the inter-cluster distance (dashed lines in Figures la and lb) and represents the isolation. It is small when there are a few large clusters, and increases to its max imum value when there is one document per cluster.
Hence, when the threshold Tis small and there is one doc ument per cluster (the null hypothesis), the total of the two terms is simply the second term, i.e., the sum of the distances of the objects from the global centroid. If the data set is non random, the total then reduces as new clusters are formed. As clusters get large and diverse, the first term becomes larger, and the total of the two terms increases until it reaches the maximum value when there is only one cluster. The sec ond term is then 0 and the first term is the sum of the dis tances of the objects from the global centroid. Thus, the two boundary conditions of the null hypothesis and a single clus ter return the same value.
In general, this criterion prefers partitions with small spe cific clusters that are far from the global centroid. This is because several large inter-cluster distances are then replaced by a single large inter-cluster distance and several small intra-cluster distances. When clusters are more gen eral, the intra-cluster distances get larger, thus overwhelming the advantage of the single inter-cluster distance.
3.2 Separated Clusters (C2)
In this criterion, we measure cluster quality by maximizing the separation of clusters relative to their compactness. Com pactness is computed by determining the weakest connection within the cluster, i.e., the largest distance between two objects R; and Rk within the cluster (solid lines in Figure 2). The more compact a cluster, the smaller the distance. Isola tion is computed by determining the strongest connection of a cluster to another cluster, i.e., the smallest distance between a cluster centroid and another cluster centroid (dashed lines in Figure 2). The more distinct a cluster the larger the distance. Wecompute this criterion as follows:
This value is defined only when there is at least one clus ter with more than one object, and only when there is more than one cluster in the partition. As such, this index is not defined for the boundary conditions of the null hypothesis and a single cluster.
As shown in Figures 2a and 2b, both the numerator and denominator for each cluster increase as the threshold T increases. However, the relative change depends on the com pactness and isolation of the clusters. In addition, there are more terms as the number of clusters increases. Hence, this criterion is likely to be minimised when there are larger number of more specific clusters.
3.3 Object Positioning (C3)
In this criterion, the quality of clustering is determined by the extent to which each object has been correctly positioned or classified. To compute this, for each object Rb we com pute the weakest connection within the cluster, i.e., the larg est distance between objects Ri and Rk within the cluster (solid lines in Figure 3). In addition, we compute the strong est connection of this object to the outside world, i.e., the smallest distance between objects Ri and Rm, where Rm belongs to a different cluster (dashed lines in Figure 3). The extent to which the object is incorrectly positioned is given by the difference between its weakest internal connection and strongest external connection. Hence this criterion is given by the following equation:
where (Ri,Rk) E cj and Rm e cj"
For the null hypothesis, the internal connection for each object is 0. However, the closest external object may be very close, so the criterion does not necessarily have the smallest value. When there is only one cluster, there are no external connections, and the index attains its maximum value.
Figures 3a and 3b show the connections for two objects when there are four clusters (Figure 3a) and when there are two clusters (Figure 3b). As shown pictorially, both dis tances increase as the number of clusters decreases. How ever, the increase in the second term is often larger when there are fewer clusters. Hence, this criterion prefers large general groupings to small specific groupings.
3.4 Number of Objects Correctly Positioned (C4)
In this criterion, the quality of clustering is determined by the number of objects that have been correctly positioned or classified. The more objects that are correctly positioned, the better the quality of clustering. An object Ri belonging to cluster cj is correctly positioned if its intra-cluster similarity, i.e., average similarity to other objects in the cluster, is greater than the inter-cluster similarity, i.e., average similar ity to objects outside the cluster. Intra-cluster similarity is computed using the following equation:
The inter-cluster similarity is computed as follows:
For singleton clusters, i.e., clusters with one element, the intra-cluster similarity is 0, hence, the object is always incor-
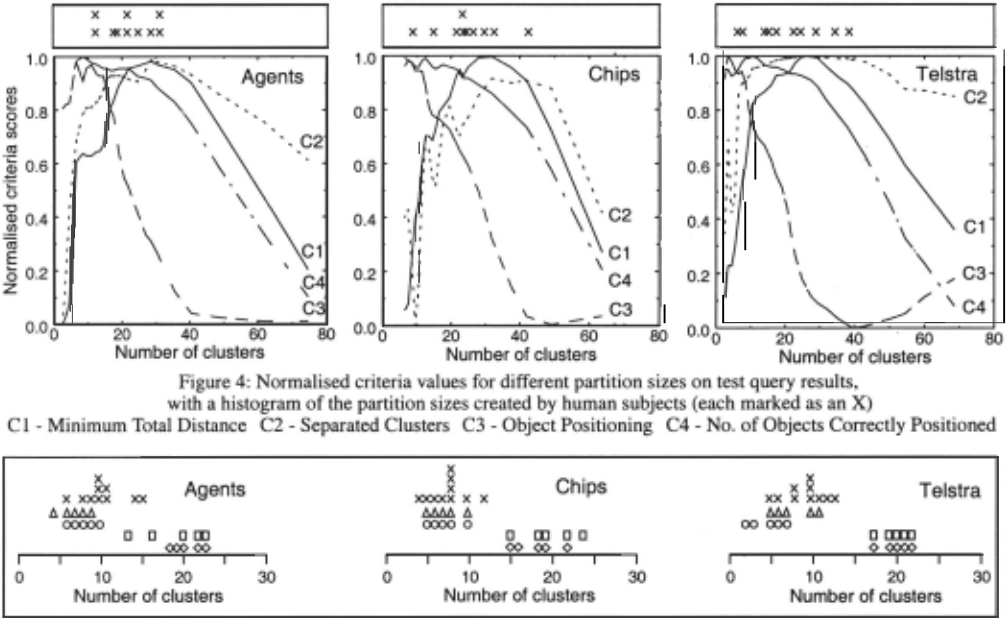
- Figure 5: Histogram of the number of non-singleton clusters for each human subject, and top 5 partitions by each criterion o- Minimum Total Distance (Cl) o- Separated Clusters (C2) o- Object Positioning (C3) t:.- Number of Objects Correctly Positioned (C4) x- Human subject
rectly positioned. Thus, for the null hypothesis, no object is correctly positioned. When there is exactly one cluster, the inter-cluster similarity is 0. Hence, all objects are per fectly positioned. Thus, unlike the Minimum Total Dis tances measure, this criterion prefers one boundary condition to the other. In other partitions, the number of well-positioned objects depends on each object's intra cluster and inter-cluster similarity. However, since objects in singleton clusters are always counted as incorrectly positioned, this criterion prefers large clusters rather than a few compact clusters and some singleton clusters.
4 Evaluation
Our first goal was to evaluate the sensitivity of each crite rion, and the spread between different criteria, on alterna tive partitions of the same set of search results. To study sensitivity, we consider whether one partition is clearly better than the rest, or whether there are several partitions that are all close to optimal. To study spread, we consider the extent to which different criteria agree in their choice of the optimum partition. Our second goal was to compare how a group of human subjects cluster the same set of search results, in order to determine whether they exhibit a similar spread in their choice of the optimum partition.
Our test data was generated by issuing three queries to the AltaVista search engine (http://www.altavista.com).
These queries were 'agents', 'chips' and 'Telstra'. The first two query terms are used in many different contexts, while the third query is a company name that has many sub-topics corresponding to different product lines. For each query we received 100 search results, which include the title and URL of the matching web page, as well as a short summary.
In order to assess how our criteria ranked different parti tions of the same data, we first needed to generate a range of different partitions for each data set. This was done by repeatedly applying our clustering algorithm with increasing values of the clustering threshold parameter T (see Section 2). As T increased, the number of clusters in the partition decreased. We then assigned a value to each partition using each of our four criteria. The resulting values have been plot ted in Figure 4. The horizontal axis of each graph corre sponds to the number of clusters in a partition, while the vertical axis indicates the value of each criterion for each partition. This enables us to compare the sensitivity of each criterion as the number of clusters varies.
For ease of comparison in Figure 4, the values returned by the criteria have been normalised to lie in the range 0 to I, where better partitions have higher values. Note that this is the opposite of the formulas given in Section 3, where the best partition produced the minimum value of the criterion. However, we found that the graphs were easier to interpret visually when the sign was reversed. It also simplifies comparison with the histogram of results from the human sub jects. In addition, we have smoothed these curves using a running average of length 2. This makes it easier to visually compare the underlying trend of each criterion, with little effect on their sensitivity.
We also gave the search results for the 3 test queries to 10 human subjects, and asked them to cluster the search results by hand. Their results appear as a histogram above each graph in Figure 4, where each point indicates the number of clusters found by that human subject. We can thus compare the spread between our four criteria and our human subjects.
In many cases, the partitions found by both the clustering system and our human subjects contained a large number of singleton classes. In order to test whether this distorted the results in Figure 4, we have plotted histograms in Figure 5 of the number of non-singleton clusters found by our four crite ria and our human subjects. Due to space restrictions, for each criterion we have plotted only the best 5 partitions.
5 Discussion
As shown in Figures 4 and 5, there is a large variability in the number of clusters that human subjects generated for the same document sets. For instance, for the 'agents' query, the number of clusters ranges from 12 to 31 and the number of non-singleton clusters ranges from 6 to 15. This indicates that some subjects prefer general groupings while others pre fer tight specific groupings.
Analysis of the cluster groupings generated by human subjects indicates that subjects formed conceptual groupings that were not necessarily apparent from the words in the summary. However, different subjects generalise at different levels of granularity. For instance, when clustering the search results of the 'agents' query, 5 subjects grouped software, mobile, intelligent and autonomous agents into a single clus ter, which we refer to as AI agents. 3 subjects grouped AI agents into two clusters: mobile and other intelligent agents. 2 subjects split these documents into three clusters, but the cluster groupings were different.
This same variability is also exhibited by the four criteria for cluster quality, with different criteria preferring different levels of generalisation (Figure 4). For instance, for the 'agents' query, the number of clusters in the best partition ranges from 9 (9 non-singleton) to 28 (23 non-singleton), which is in line with the variability found in the human clus ters. Even with a single criterion, there is a whole range of partitions that are near-optimal, i.e., the value returned is within 5% of the value for the best partition. However, the location and width of the range varies between criteria.
The Minimum Total Distances criterion (C1) prefers many small specific clusters to a few large general clusters. For instance, for the 'agents' query, the best partition has 28 clusters out of which 23 are non-singleton. The AI agents group discussed earlier is split into five groups: software, intelligent, autonomous, mobile and others that did not fall into the above groups. In general, this criterion has a narrow optimal area indicating high sensitivity, e.g., for the 'agents' query, four other partitions are near-optimal and the number of clusters for these partitions range from 23 ( 19 non-single ton) and 32 (22 non-singleton).
The Separated Clusters criterion (C2) also prefers many small specific clusters to a few large general clusters, e.g., for the 'agents' query, the best partition has the same number of clusters, and the AI agents group is again split into five groups although the actual groupings are different. In gen eral, the sensitivity of this criterion is data-dependent with large optimal areas for some queries such as 'Telstra' and very narrow optimal areas for other queries.
The Object Positioning criterion (C3) prefers a few large general clusters to many small specific clusters. For instance, for the 'agents' query, the best partition has 10 clusters out of which 8 are non-singleton, and the AI agents group dis cussed earlier is split into two groups with software, autono mous and mobile agents grouped together. In general, this criterion has a narrow optimal area indicating high sensitiv ity, e.g., for the 'agents' query, two other partitions are near optimal and the number of clusters for these partitions range from 7 (5 non-singleton) and 10 (8 non-singleton).
The Number of Objects Correctly Positioned criterion (C4) also prefers a few large general clusters to many small specific clusters. For instance, the best partition of the 'agents' query has 8 clusters, all with more than one object. The AI agents group discussed earlier is split into two groups in the best partition, with MIT software agents in one group and other intelligent agents in the other group. In general, this criterion has a very wide optimal area indicating low sensitivity, e.g., for the 'agents' query, 16 other partitions are near-optimal and the number of clusters for these partitions range from 2 (2 non-singleton) and 22 (19 non-singleton).
Given the diversity of partitions generated by human sub jects and our evaluation criteria, there is no single clustering methodology or cluster quality criterion that is useful for all users. However, preliminary studies into the use of clustering as an exploratory tool during retrieval indicates that cluster ing is useful in quickly eliminating large sets of retrieved results (Zamir and Etzioni 1998). The choice of clustering methodology and quality criterion is dictated by a user's preferences for generalisation, and a clustering algorithm with varying thresholds and different quality criteria is one method for catering to a user's generalisation preferences. Criteria C1 or C2 may be used when users want tight specific clusters, and criteria C3 or C4 when users require a few gen eral clusters. We have found from further testing on a wide range of queries that the above difference in behaviour between these criteria is consistent.
The sensitivity analysis indicates that even for the highly sensitive criteria, such as C1 and C3, there are a number of partitions that are optimal. Hence, for applications that require real-time response, such as clustering search results, only a few thresholds need to be explored in order to provide a near-optimal rather than the best partition.
6 Related Work
One of the main studies of clustering criteria was made by Milligan and Cooper ( 1985), in which they performed an empirical evaluation of 30 different criteria. Their focus was on stopping rules for hierarchical clustering. They tested these criteria on simulated data sets involving a maximum of 5 clusters and 8 attributes. In contrast, we have focused on non-hierarchical clustering of practical data sets, where our data sets have 50-100 attributes. These practical differences motivated our interest in a sensitivity analysis of clustering criteria for such large and complex data sets.
Our study has concentrated on distance-based clustering, which relies on a similarity function to compare vectors describing the objects to be clustered. An alternative class of clustering algorithm is known as mixture modelling, where the objects to be clustered are generated from a mixture of probability distributions of a known type. Oliver et al. ( 1996) conducted an empirical comparison between a Minimum Message Length criterion and several other statistical criteria on simulated data. However, our experience has been that a mixture modelling approach is difficult to apply to document clustering, due to the problems in finding suitable underlying distributions for term frequencies in documents.
Leouski and Croft (1996) performed an empirical evalua tion of methods for clustering search results. Their emphasis was the representation of documents and the performance of different clustering techniques. While they examine how to evaluate clustering techniques in terms of precision and recall, they do not provide quality criteria that can be applied as the clusters are being generated. In addition, they focused on hierarchical clustering of full-text documents.
The problem of clustering results from a search engine has also been studied by Zamir and Etzioni (1998). They use a technique called Suffix Tree Clustering, which first clusters documents that contain common phrases. They then merge clusters based on the proportion of documents in common between two clusters. It is difficult to make a direct compari son between the quality of their clusters and ours, because they can assign a result to more than one cluster, and they used a fixed number of clusters in their tests. The aim of their experiments was to assess the relevance of clusters to the original query, based on a manually assigned value of rele vance. In contrast, our aim has been to detect the number of clusters in the search results, and assess the sensitivity of numerical criteria as well as human judgement in the choice of this number of clusters.
Macskassy et al. (1998) have studied how a group of human subjects clustered the results of 10 search queries. They reached the conclusion that humans show considerable variation in how they cluster search results, which matches our own experience. We have extended this result by making a comparison between the sensitivity of humans and numeri cal criteria to the number of clusters. We have shown that the numerical criteria also reflect the range in the number of clusters found by our human subjects.
7 Conclusion and Further Work
We have developed several alternative criteria for determin ing the quality of clustering. These criteria are designed so that different criteria prefer cluster sets that generalise at dif ferent levels of granularity. We have evaluated our criteria for sensitivity and spread in a practical application. In addi tion, we have compared the partitions chosen by our criteria with those generated by human subjects.
Our analysis demonstrates that our criteria match the vari ability exhibited by human subjects, indicating there is no single perfect criterion. Instead, it is necessary to select the correct criterion to match a human subject's generalisation needs. We show how this matching may be done using a clustering algorithm with varying thresholds and different quality criteria. The number of thresholds examined may be adjusted to provide the required computational efficiency.
Our next step is to explore the behaviour of our criteria with non-document data sets and to test the suitability of our criteria as stopping rules for hierarchical clusters. In addi tion, we plan to extend our criteria to study overlapping clus ters such as those generated by Zamir and Etzioni (1998).
Acknowledgements
We hereby acknowledge the permission of the Director, Technology Strategy and Research, Telstra Corporation, to publish this work.
@inproceedings{ijcai1999p129,
  title     = {An Evaluation of Criteria for Measuring the Quality of Clusters},
  author    = {Raskutti, Bhavani and Leckie, Christopher},
  booktitle = {Proceedings of the Sixteenth International Joint Conference on
               Artificial Intelligence, {IJCAI-99}},
  publisher = {International Joint Conferences on Artificial Intelligence},
  editor    = {Thomas Dean},
  pages     = {905--909},
  year      = {1999},
  note      = {Natural Language Processing},
  url       = {https://ijcai.org/proceedings/1999/129},
}
TY - CPAPER TI - An Evaluation of Criteria for Measuring the Quality of Clusters AU - Raskutti, Bhavani AU - Leckie, Christopher T2 - Proceedings of the Sixteenth International Joint Conference on Artificial Intelligence, IJCAI-99 PB - International Joint Conferences on Artificial Intelligence PY - 1999 SP - 905 EP - 909 UR - https://ijcai.org/proceedings/1999/129 ER -Copied
Machine-readable versions of this paper, for tools and AI agents:





