
Improved Classification for a Data Fusing Kohonen Self Organizing Map Using A Dynamic Thresholding Technique
Proceedings of the Sixteenth International Joint Conference on Artificial Intelligence. Machine Learning. Pages 828-831.
© 1999 International Joint Conferences on Artificial Intelligence
Abstract
The use of linear data fusion is a fast developing area in the field of military information and combat systems. However, the use of data fusion in conventional application areas is not as wide spread. To date linear data fusion has been used only in applications in which substantial knowledge of both the problem domain and the sensor devices in use are available. However, in applications such as condition monitoring the problem domain can be very complex, with little or no knowledge about the interactions between measured parameters. This paper describes the use of non-linear self-learning or self-organising systems as a tool for data fusion, since these systems can learn complex interrelationships between a number of parameters, and use this information as a tool for improved classification.
- [Alag, 1996] Satnam Alag, Kai Goebel, and Alice Ag- gino. A Framework for Intelligent Sensor Validation, Sensor Fusion, and Supervisory Control of Automated Vehicles in IVHS. Intelligent Systems Research Group, Department of Mechanical Engineering, UC Berkley, 1996.
- [Anderson, 1995] James A. Anderson. An Introduction to Neural Network. MIT Press, ISBN 0-262-01144-1, 1995.
- [Bishop, 1995] Christopher Bishop. Neural Networks for Pattern Recognition. Oxford University Press, ISBN 0-19-853864-2, 1995.
- [Lou, 1986] Lou R.C., and Kay M .G. "Multisensor Inte- gration and Fusion in Intelligent Systems", IEEE Transactions on Systems, Man and Cybernetics, Vol. 19, No.5, 1989.
- [Harris, 1993] Harris Tom. Neural Networks in Machine health Monitoring. Professional Engineering , July/August, 1993.
- [Kohonen, 1989a] Teuvo Kohonen. Self-Organization and Associative Memory -Third Edition. Springer- Verlag, ISBN 0-387-51387-6, 1989.
- [Kohonen et al., 1988b] Teuvo Kohonen. G. Barna, and Chrisley R. . Statistical patter recognition with neural networks: Benchmarking studies. Proceedings of the IEEE International Conference on Neural Networks, San Diego, 1988.
- [Reilly et al., 1982] Reilly D.L., Cooper LN. and El- baum C. "A Neural Model for Category Learning", Biological Cybernetics, 45, pages 35-44, 1982.
- [Taylor and Macintyre, 1998a] Odin Taylor, and John Macintyre. Adaptive Local Fusion Systems for Novelty Detection and Diagnostics in Condition Monitoring. In Sensor Fusion: Architectures, Algorithms, and Applica- tions II, Belur V. Dasarthy, Editor, Proceedings of SPIE, Vol. 3376, pages 210-218, 1998.
- [Taylor and Macintyre, 1998b] Odin Taylor, and John Macintyre. Modified Kohonen Network for Data Fusion and Novelty Detection within Condition Monitoring. Proceedings of EuroFusion98, pages 145-154, 1998.
References were extracted automatically from the PDF and may contain errors.
Full text extracted automatically from the PDF; figures, tables and equations may differ. The PDF is the version of record.
1 Introduction
The reliable operation of machinery in the industrial sector is of major importance due to the ever-increasing demand for profitability in the competitive marketplace. Failure of critical machinery at an unexpected time can devastate a company's ability to maintain production and keep a competitive position. Organisations can in crease the productivity and reliability of such machines by the use of condition monitoring.
Condition monitoring is a well-established term that describes a number of predictive maintenance technolo gies enabling skilled engineers to determine the current state of a machine and diagnose any problem that might be present. However, the number and availability of these skilled personnel is limited and they are most likely to be external to an organisation, which results in machinery health checks being carried out on a sched uled off-line basis.
Complex machines provide data from multiple sources such as vibration, temperature and pressure, which demonstrate non-linear behavior and are difficult to analyze with normal techniques due to the complexity of the interactions. The process of data fusion allows more information to be gained from the synergy of these mul tiple sensors than would be gained from one single sen sor [Alag, 1996; Lou, 1989].
Due to the complexity of condition monitoring applica tions, and the lack of kno"wledge about the domain, a self-learning system is needed to fuse these complex relationships into a model that can be used to represent normal operating behavior. This model can then be used to identify changes from the normal operating behavior, for example the development of a mechanical fault, and flag this up as a novel condition.
Self-organising neural networks, especially the archi tecture proposed by Kohonen [Kohonen, 1989a] have been used successfully over the years in variety of appli cations. These self-organizing neural networks have the ability to learn by example the general characteristics of similar items in an unseen data set and to group these into different classifications, or clusters. To classify new input patterns after training has completed, the data is compared for similarity to the learned groupings using a Euclidean distance metric. The winning neuron in the network is identified as having the smallest Euclidean Distance to the new input data, and the classification of the new input is determined to be the same as the win ning neuron.
The Kohonen algorithm maps higher dimensional data into a lower dimensional representation and implements a nearest neighbor approach for classification of new patterns. However factors such as outliers and misrepre sented data can affect this and give false classifications. Kohonen networks are naturally grouped with other al gorithms such as LVQ and Nestor algorithms, which are in fact modified versions of k-nearest neighbor classifi ers [Reilly et al., 1982; Kohonen et al., l988b]. It is known that for a problem where its is assumed that eve rything is known about the data the best possible classi fier for a probabilistic system is a Bayes classifier [An derson, 1995; Bishop, 1995].
Another method for improved classification for Koho nen networks, is the use of thresholds around the neu rons within the network to act as a decision boundary to stop false classification occurring. A false classification could be a new input pattern that is a significant dis tance away from the winner, but is still classified as belonging to that group. Alternatively a new pattern may be close to a group of neurons or neuron, but these neurons may represent outliers in the data where the data density is sparse.
A method is needed to dynamically set these thresholds so as to set a large threshold around tightly grouped neurons and smaller thresholds around loosely con nected neurons. This gives an approximation of the probability density of the data by indicating, that it is more likely that closely grouped neurons represent areas of data that are frequently winning, whereas loosely coupled and dispersed neurons, although representative of the data are less likely to give accurate classifica tions.
1.1 Overview
This paper looks at the implementation of a method for automatically setting thresholds for the problem that has been outlined above, using a Kohonen Self-Organizing Map (SOM) . The implementation is based within a small Siemmens microprocessor in a hardware device and is used for a modular, real world, on-line condition monitoring application. The overall NEURAL-MAINE project will not be discussed here, but the method of assigning thresholds will be examined in closer detail. The application involves the use of on-line self organizing maps to learn the normal running state of a machine and identify when a transition from this state occurs [Harris, 1993]. The normal state for this problem is modeled by fusing a number of different sensor types and learning the representation of this state, passing new data through the model and identifying when a sig nificant deviation from the norm has occurred, that is, a novel condition.
2 Proposed Method
Previous methods of using threshold values with a Ko honen SOM included the use of a single value, which places a threshold around the entire learned data space [Taylor and Macintyre, 1998a] . This method although crude, was effective with low dimensional, normally distributed data. However with more complex higher dimensional data the algorithm failed due to misclassi fications.
Another approach uses a static threshold value for each neuron within the Kohonen network, so when a winning neuron is identified, the distance of the new pattern is compared to the threshold [Taylor and Macintyre, 1998b] . If the distance is greater than the threshold then this is classified as a novelty, as shown in Formula 1, where D is the distance form the wining neuron and Tis the threshold level for that neuron.
However due to the distribution of neurons relating to the data, outliers for example had the same threshold as tightly grouped neurons, which allows severe misclassi fications. This method requires the threshold to be set manually, which is not appropriate for on-line real-time systems. Although an improvement, the approach is still too likely to misclassify outlying unseen data.
The Kohonen algorithm roughly estimates the probabil ity distribution of the data by clustering more neurons to a data space region that is well represented by input patterns. For a thresholding algorithm to work effi ciently and effectively, it should also model the distri bution of the neurons. The distribution of the neurons should have the affect on the thresholds that the closer and more dense a number of neurons, the larger the in dividual neuron threshold should be. This is because there is a higher probability that any new data point occurring in the same region , or close to the region, is likely to belong to the class represented by those neu rons. A group of sparsely distributed neurons should have small thresholds. This will result in new data which is in the area of the sparse representation being less likely to be classified as normal, or belonging to the class represented by those neurons. This method allows small, virtually insignificant thresholds to be assigned to neurons, in effect rendering them inoperable as a classifier. This eliminates the problems mentioned with the previous two approaches. Thus a new data point must be very close to the outlier or stretched position to be classified as normal, or belonging to that class.
The approach used to implement this is to use the lateral distance between the Kohonen neurons as a basis to set the thresholds dynamically and in real time, without the need for a user interaction. The algorithm steps through each neuron in the Kohonen network and finds the clos est of its neighboring neurons using Euclidean distance.
The Euclidean distance is normalised to a range of -5 to +5, where -5 represents a exact match of new data to an existing neuron, and +5 represents the furthest distance measured within the map. The normalised distance is then passed through a sigmoid function, which gives an output in the range 0 to 1. Finally the output of the sig moid is inverted by subtracting the output value from 1. The result is an activation level which is a normalised representation of the Euclidean distances, with larger thresholds for densely packed neurons, and lower thresholds for sparse representations.
The number and type of sensing devices that could be connected to the hardware module can vary greatly, and the output that they generate can vary dramatically. The sensitivity of these parameters must be taken into con sideration, as the range of values and the sensitivity of fault types to particular parameters vary considerably.
For normalization of the data, a technique was needed that would keep the sensitivity correct and scale the in coming data into the same range for the neural network. Another problem encountered with our application was that data was being presented in real time that needed to be learned, and due to hardware requirements a pool of data could not be gathered, stored and analyzed for normalization purposes. The technique used in the ap proach was to use a modified version of Vector Aug mentation (or unit sphere). This allowed the incoming values from the sensors to be scaled as a pattern and not as entire set of data, which has so far proved to be ef fective and accurate.
An indication of the sensitivity of faults was determined using the outputs of the Kohonen network. This was done by applying a novelty metric to calculate a sensi tivity value, as shown in Formula 2. Where D is the Euclidean distance of the new input from the winning neuron and Tis the winning neurons Threshold.
Previous approaches for applying such a threshold use hard limited values. The new approach gives a better representation of the degree of sensitivity of a develop ing fault.
3 Data, Training and Results
Data for testing was provided by Leatherhead Food Re search Association, who provides technical and support information relating to processes in the food industry for it members. Data was collected from a machine that produces UHT (Ultra Heat Treated) milk products, over a number of states. The states included a normal run ning state, two foul (blockage fault) conditions and two unexpected errors.
The Normal running state involved no blockages in the UHT process as the product was passed through the system. The fouling conditions occurred when the prod uct blocked the heat exchanger plates and caused a fault and the two unexpected errors, occurred during the run ning of the machine causing the process to be shut down. The data sets compromised of eight parameters, including temperature, pressure and flow readings.
The Kohonen based novelty detector was trained on the normal running state only with one pass (i.e. the learn ing mimicked real-time operation by passing once through the data set gathered during run-up and a short period of steady state operation), as this simulates the normal operating condition of the hardware-based sys tem. To test for novel conditions, new data is passed into the trained network. If the new data is within the threshold, it will be classified as normal. If the new data is not like the learned data and outside of the threshold, then it is classified as a novelty or unknown class.
As a baseline for comparison, the novelty detector was trained as mentioned previously, but with the dynamic threshold setting (the proposed method) disabled. In its place an arbitrary threshold was assigned by running an unseen normal data set through the novelty detector and using the average winning distance (278.1) as the threshold level for the network. The normal data was then re-run through the network along with the four fault conditions and the results recorded.
| E ~ ~ E ::: "" ~z | ._ </) o E ·~ 0 .... z«i Cl.. | I > 0 </) z ·~ c:ia:l z | ~:9 01)0 o::l.C .... </) ~ ~ > .... -<~ | ~ ~ OJ)U "" c .... "" ~ .... ;> -~ -<o |
| Normal | 335 | 46 | 278.1 | 277.03 |
| Foul I | 167 | 167 | 278.1 | 2756.67 |
| Foul2 | 319 | 319 | 278.1 | 3401.495 |
| Friki 1 | 245 | 245 | 278.1 | 3085.196 |
| Friki 2 | 205 | 205 | 278.1 | 2008.983 |
The average threshold for each pattern set will be exactly the same as each neuron within the network has the same arbitrary threshold. Results from the arbitrary setting are poor as by using just the winning distance information you are not incorporating any information about the clustering of data within the self-organized map.
The novelty detector was then re-trained in the same way as mentioned previously, but this time with the dynamic thresholding activated. Data which had not previously been seen by the network, and represented normal running state, was then passed through the network to validate that it could correctly identify normal states, as shown in Table 2. As can be seen in Table 3, the average Euclidean distance for normal patterns is 188, whereas for the fault conditions there is a substantial difference in the distance. The average threshold value is approximately the same, as the same network trained on normal data only was used with the fault data passed through it. The slight fluctuation in the average threshold is due to the firing of the different neu rons within the network as each has its own threshold.
| E v v E ;:: <'l ~z | ...... V) o E · V 0 ..... z~ 0... | > 0 V) z ·1l ov z | v::s! 000 <'l..C: .... V) v v ;> .... -<~ | v v OI)U <'l c .... <'l v ..... ;> - ~ -<o |
| Normal | 335 | 0 | 2302 | 188 |
| Foul I | 167 | 95 | 2301 | 2758 |
| Foul2 | 319 | 245 | 2300 | 3393 |
| Friki 1 | 245 | 169 | 2300 | 3684 |
| Friki 2 | 205 | 16 | 2301 | 2015 |
The four fault conditions all contain normal data that progresses into a fault condition. The novelty detector correctly identified the normal state as normal, fault conditions as novel , and the severity measure indicated the increasing deterioration of the fault condition as shown in Figure 4. By examining the results, the first few patterns of the fault conditions were identified as novel, this was due to the machine having a brief start up period, which was not represented in the normal state training data.
Further testing including brief start up data with the normal data proved to be ineffective as the Kohonen was learning on a one pass basis, and the number of patterns representing start up to that of normal state was only a small proportion and varying. The way the Kohonen algorithm performs learning "fades" the start up data out, as there is more representational data in the normal state data. This is not really a problem, as the project (at this level) requires an indication that a transition from the normal state has occurred, any other state will be dealt with by a higher level of the NEURAL-MAINE system.
I
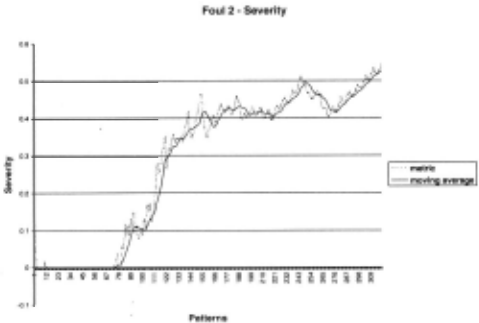
By comparing the results of the dynamic thresholding and the arbitrary thresholding techniques, it can be seen that the dynamic method considerably outperforms the arbitrary one. The arbitrary methods could improve, with more complex analysis, but performance will never match that of the dynamic technique since the informa tion contained within the lateral connections of the Ko honen network are not used.
The novelty detector was also tested with a number of synthetic data sets, to test the function of the normali zation and sensitivity, and to test the accuracy of the novelty detector. Five test sets were generated by Neural Computer Sciences which mimicked a number of sen sors connected to a machine component, each having varying sensor outputs (high and low values), and varying sensitivities. The synthetic data sets contained a run-up and normal running state, which progresses into a fault condition. To mimic the real operation of the neural network when embedded in the hardware device, the neural network was trained in a "one pass" mode as with the previous real UHT plant data. The novelty de tector trained with the first 800 patterns of each data set, which simulated the system being activated when a machine was started, run up and settled into a steady state. After the 800 patterns had been presented, the neural network then examined the rest of the data set and classified the new inputs as either normal or novel. The results are shown in Table 5
| E v v E ;:: <'l ~z | ...... V) o E . v 0 ..... z~ 0... | I ;> 0 V) z ·1l o"V z | v::s! coo <'l..C: .... V) v v ;> .... -<~ | v v OI)U <'l c .... <'l v ..... ;> -~ -<o |
| Trial 1 | 2000 | 693 | 1024 | 1685 |
| Trial 2 | 2500 | 25 | 1170 | 509 |
| Trial3 | 2500 | 1143 | 518 | 51 |
| Trial4 | 2500 | 1152 | 1461 | 1011 |
| TrialS | 2000 | 1104 | 1700 | 744 |
The pattern set Trial 1 mimicked a normal run up for the first 300 patterns with a steady run of the next 1200 patterns and the final 500 patterns indicating a slow degradation into a fault condition. Trial 2 mimicked a quick run up for the first 230 patterns, then stayed in a steady state for the rest of the data set. However, the steady state was interrupted by a number of single er ratic novelties simulating a transient fault . Trial 3 had a very quick startup time of the first 100 patterns, and then settled into a steady state for the rest of the data set. Again transient novelties were detected, which in creased in frequency and severity towards the end of the data set. Trial 4 had another quick start up of the first 100 patterns, stabalising into a steady state for another 1000 patterns. During the steady state a number of vio lent single novelties were detected, with a "noisy" steadily increasing fault detected during the last patterns of the data set. Trial 5 had a quick startup for the first 100 patterns, followed by a steady state for the next 900 patterns, with a steady fault detected in the last 1000 patterns. The novelty and sensitivity readings also showed that in the fault (of Trial 5) a repeating violent novelty was occurring.
The novelty detector successfully identified the occur rence of these faults, and the severity could be visualised as the fault progressed by use of the severity metric.
4 Conclusions
The methods described here were developed with a need for speed, accuracy and automation as the data fusion component is being embedded into a small microproces sor based hardware system. This hardware system will be the basis for the NEURAL-MAINE project and will be used on a number of real world condition-monitoring applications from small processing machinery to large steam turbines.
Using arbitrary threshold levels is just not feasible, as this is not accurate enough. Furthermore the combina tions of possible data sets in future applications makes the generic calculation of a threshold value impossible. The dynamic method outperforms the arbitrary method and can be used in general applications. This is because the technique uses the information stored within the lateral connections of the Kohonen map (which de scribes the clustering of the data) as a basis for dynami cally setting individual neuron threshold values.
The methods were tested using synthetic data, which mimicked extreme sensor readings, and real data was used from a UHT machine. Both data sets were used in testing and the dynamic method performed accurately with no user intervention.
The sensitivity metric also produced more output infor mation as this gave an indication of the severity of the fault. For the gentle fouling conditions of the UHT ma chine, the severity measure is a gently slow increase. The sudden faults caused violent, powerful sensitivity readings. And the final UHT unexpected fault showed an error at startup and a small time of settling into nor mal state. The severity metric was just on the scale, which indicated that the fault was just on the bounds of normality and did eventually settle into a normal state.
The initial version of the algorithm looks at only the closest neuron, but future versions will investigate the use of k-nearest neurons to see if this improves classifi cation.
@inproceedings{ijcai1999p118,
  title     = {Improved Classification for a Data Fusing Kohonen Self Organizing Map Using A Dynamic Thresholding Technique},
  author    = {Taylor, Odin and MacIntyre, John and Tait, John},
  booktitle = {Proceedings of the Sixteenth International Joint Conference on
               Artificial Intelligence, {IJCAI-99}},
  publisher = {International Joint Conferences on Artificial Intelligence},
  editor    = {Thomas Dean},
  pages     = {828--831},
  year      = {1999},
  note      = {Machine Learning},
  url       = {https://ijcai.org/proceedings/1999/118},
}
TY - CPAPER TI - Improved Classification for a Data Fusing Kohonen Self Organizing Map Using A Dynamic Thresholding Technique AU - Taylor, Odin AU - MacIntyre, John AU - Tait, John T2 - Proceedings of the Sixteenth International Joint Conference on Artificial Intelligence, IJCAI-99 PB - International Joint Conferences on Artificial Intelligence PY - 1999 SP - 828 EP - 831 UR - https://ijcai.org/proceedings/1999/118 ER -Copied
Machine-readable versions of this paper, for tools and AI agents:





