
The Representation and Use of a Visual Lexicon for Automated Graphics Generation
Proceedings of the Fifteenth International Joint Conference on Artificial Intelligence. Natural-language Processing and Graphical Presentation. Pages 1056-1064.
© 1997 International Joint Conferences on Artificial Intelligence
Abstract
Most automated graphics generation systems employ either a constructive or a parametric graphics synthesis approach. Constructive graphics synthesis is a deductive approach that builds visual presentations from scratch by gluing together the most basic visual variables. Conversely, parametric graphics synthesis defines a set of parametrized visual models and interprets the information to be presented through instantiation of the selected model. To increase efficiency, we have combined parametric and constructive approaches in a system called IMPROVISE. In this paper, we focus on the parametric aspect of our approach. We present a comprehensive, general, and extensible formalism to represent a visual lexicon for use in automated graphics generation. A visual lexicon is a collection of parametrized primitive visual objects that serve as building blocks for constructing more complex visual presentations. We also illustrate how this representation can be effectively employed to aid the selection and instantiation of a visual lexical item in the graphics generation process. Examples are given from IMPROVISE to demonstrate the representation and use of this visual lexicon.
- Arens, Y., Hovy, E., and Vossers, M. (1993). The knowledge underlying multimedia presentations. In Maybury, M., editor, Intelligent Multimedia Interfaces, chapter 12, pages 280-306. AAAI PressfThe MIT Press, Menlo Park, CA.
- Bertin, J. (1983). Semiology of Graphics. Univ. of Wisconsin Press, Madison, WI. (trans.
- by W.J. Berg).
- Casner, S. (1991). A task-analytic approach to the automated design of graphic presentations. ACM Trans. on Graph- ics, 10(2):111-151.
- Cohen, P. and Feigenbaum, E., editors (1989). The Handbook of Artificial Intelligence, volume 3, chapter XV. Plan- ning and Problem Solving. Addison-Wesley, Reading, MA.
- Elhadad, M., McKeown, K., and Robin, J. (1997). Floati:-~:; constraints in lexical choice. J. of Computational Lin- guistics. To appear.
- Gates, D., McCardell, R., Takeda, K., and Nirenburg, S. (1991). Generation lexicons. In Goodman, K. and Niren- burg, S., editors, A Case Study in Knowledge-Based Ma- chine Translation, chapter 6, pages 145-163.
- Gnanamgari, S. (1981 ). Information Presentation Through Automatic Graphic Displays. PhD thesis, Univ. of Penn.
- Goldsmith, E. (1984). Research Into Illustration: An Ap- proach and A Review. Cambridge University Press, Cambridge.
- Lohse, G., Biolsi, K., and Rueter, H. (1994). A classification of visual representations. Communications of the ACM, 37(12):3~9 .
- Mackinlay, J. (1986). Automating the design of graphical presentations of relational information. ACM Trans. on Graphics, 5(2):110-141.
- Marks, J. (1991). A formal specification scheme for network diagrams that facilitates automated design. J. of Visual Languages and Computing, 2(4):395-414.
- Robertson, P. (1991). A methodology for choosing data rep- resentations. IEEE Computer Graphics and Applica- tions, 11(3):56-67.
- Roth, S. F. and Mattis, J. (1991). Automating the presentation of information. In Proc. IEEE Conf. on AI Applications, pages 90-97.
- Russell, S. and Norvig, P. (1995). Artificial Intelligence: A Modem Approach. Prentice Hall, Englewood Cliffs, NJ 07632.
- Senay, H. and Ignatius, E. (1994). A knowledge-based sys- tem for visualization design . IEEE Computer Graphics and Applications, 14(6):3~7.
- v~•ernecke, J. (1994). The Inventor Mentor: Programming Object-Oriented 3D graphics with Open Inventor. Addi- SO!'l Wesley, Reading, MA.
- Zhou, M. and Feiner, S. (1996). Data characterization for au- tomatically visualizing heterogeneous information. In Proc. IEEE lnfoVis'96, pages 13-20, San Francisco, CA.
- Zhou, M. and Feiner, S. (1997). Top-down hierarchical plan- ning of coherent visual discourse. In Proc. IU/'97, pages 129-136, Orlando, FL.
References were extracted automatically from the PDF and may contain errors.
Full text extracted automatically from the PDF; figures, tables and equations may differ. The PDF is the version of record.
1 Introduction
Automated graphics generation is a computationally complex task. Most research systems that have been devel oped to explore it use one of two approaches: parametric graphics synthesis and constructive graphics synthesis.
Parametric graphics synthesis defines a set of parame trized visual models. It analyzes the data attributes, maps the data attributes onto the parameters of the models, and instan tiates the visual parameters of the selected model to interpret the data (e.g., [Robertson, 1991]). In contrast, constructive graphics synthesis does not predefine a set of visual models.
t This research is supported in part by DARPA Contract DAALOI-94-K0119, the Columbia University Center for Advanced Technology in High Performance Computing and Communications in Healthcare (funded by the New York State Science and Technology Foundation), the Columbia Center for Telecommunications Research under NSF Grant ECD-8811111, and ONR Contract N00014-94-1-0564.
Instead, it reasons about visual design principles (e.g., [Mackinlay, 1986]) and attempts to compose visual presenta tions from scratch by gluing together the most basic visual variables [Bertin, 1983] to form a coherent whole.
We are developing a system called IMPROVISE (Illustra tive Metaphor Production in Reactive Object-oriented VISual Environments) that can automatically generate visual presentations using a combination of parametric and con structive approaches. Unlike most of the constructive sys tems (e.g., [Mackinlay, 1986; Roth and Mattis, 1991]), IMPROVISE constructs a wide variety of visual presentations, including 2D static graphs and 3D animations, to convey het erogeneous information [Zhou and Feiner, 1996]. IMPROVISE begins by sketching abstract plans from scratch to create par tially specified visual presentations. These vague descrip tions are progressively replaced by more complete descriptions [Zhou and Feiner, 1997]. In a top-down fashion, a complex visual presentation is recursively built by using primitive visual objects that can be handled by a rendering component. We refer to a collection of the primitive visual objects as a visual lexicon. Each primitive visual object in the lexicon is called a visual word or a visual lexical item.
A visual word can be any type of visual form, ranging from a 2D static text string to a video clip. Rather than list all the possible primitives and their combinations or construct them from scratch, we abstract and parametrize the basic visual forms. We have developed a comprehensive, general, and extensible formalism to represent a visual word. Much like a lexical component in natural language generation sys tems [Gates eta!., 1991; Elhadad eta!., 1997], the represen tation is not only comprehensive enough to capture the syntactic, semantic and pragmatic features of each word, but is also compact enough for the visual words to be easily manipulated by the design process. Furthermore, the formal ism is general enough to support a wide range of visual forms, including 3D graphical models, images, and video. The representation can also be easily extended to accommo date new visual forms.
Based on the lexical representation, we have formulated a set of constraints to guide the selection and instantiation of a visual word. Those constraints come from a wide variety of sources including: syntax (e.g., only certain visual words can be used in a composition), semantics (e.g., only certain visual words can be used to fulfill a particular informationseeking goal), and pragmatics (e.g., available resources, such as a type of display, require certain types of visual words).
In the rest of the paper, we first briefly discuss several parametric graphics synthesis systems in Section 2. Then we present our representation formalism for the visual lexicon in Section 3. Based on the representation, we postulate a set of constraints that guide the selection and instantiation of a visual word. Finally, in Section 4 we present our conclusions and discuss possible future work.
2 Related Work
The foundation of parametric graphics synthesis is a set of parametrized visual models. Through careful examina tion, the mapping between the visual attributes of the models and the data properties can be established in a formal and systematic manner. Most systems that employ a parametric approach are quite similar but have minor differences in the methodologies they use to map data onto their visual models. Nevertheless, systems can be differentiated by the richness and flexibility of their parametrized visual models, as well as their capabilities to compose various models into a coherent presentation.
BHARAT [Gnanamgari, 1981] was developed at Uni versity of Pennsylvania to generate 2D displays for quantita tive information: pie graphs, bar graphs, and line graphs. It maps numeric data to one of these graphs determined by the data characteristics. Once a graph type is selected, it is instantiated based on the data properties and its syntactic parameters.
Robertson's natural scene paradigm (NSP) [Robertson, 1991] maps data variables to various features of a 3D realistic natural scene, such as surface condition, sur face height, and density based on data characteristics. He postulates a set of mapping rules to correlate the properties of the natural scene, the data characteristics, and the user's interpretation goals. · NSP focuses on representing scientific or statistical data sets, it does not address how to represent qualitative (i.e., non-quantitative) information.
VISTA [Senay and Ignatius, 1994] is a knowledge-based visualization system that suggests various visual techniques for a given data set and also allows the user to modify the design interactively. Compared to other parametric systems, VISTA offers a much richer set of visual techniques that can effectively express a wide range of scientific data. Further more, it employs a sophisticated compositional design approach to design a composite visual display. VISTA parti tions a large data set into simple sets of data, selects unused primitive visualization techniques to represent each small data set, and assembles all selected primitive visualization techniques together. Like NSP, VISTA also emphasizes sci entific visualization and does not address visual techniques for representing qualitative information.
3 Visual Lexicon Representation and Usage
Since most parametric synthesis systems have focused on presenting quantitative information, their representation formalisms usually are not comprehensive or general enough to handle heterogeneous information. Moreover, most of their parametrized visual models are characterized by their syntactic features: the semantics and pragmatics of the mod els are either ignored or simplified. However, to effectively synthesize visual presentations, we need a comprehensive representation of each model that captures its syntactic, semantic, and pragmatic features. The representation formal ism should also be general and extensible. In our case, each visual word in the lexicon corresponds to such a model. To meet these criteria of comprehensiveness, generality, and extensibility, we have adopted an object-oriented paradigm to represent a visual word.
3.1 Representation
A visual word is always associated with a single domain
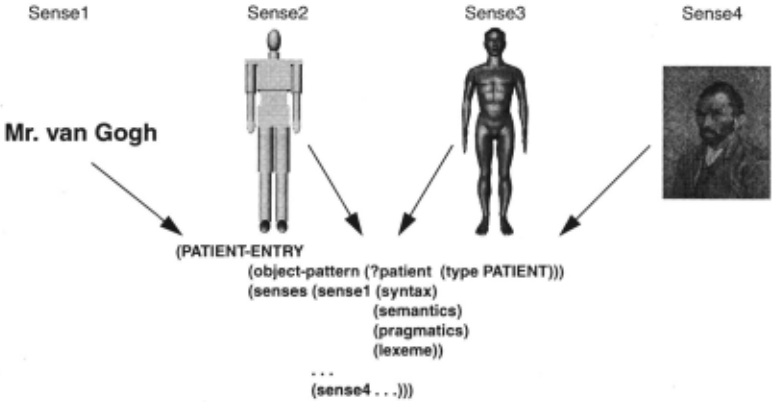
#Text (sense1 (syntax (category VISUAL-UNITY) (subcategory TEXT) (media Graphical-Model)))# Simple body model # Complex body model #Image (sense4 (syntax (sense2 (sense3 (syntax (syntax (category VISUAL-UNITY) (category VISUAL-UNITY) (category VISUAL-UNITY) (media Image TIFF))) (subcategory 3D-SHAPE) (subcategory 3D-SHAPE) (media Graphical-File))) (media Graphical-File)))object. However, each domain object can be represented by one or more visual words. In a visual lexicon, we say that a domain object has multiple senses. For example, an instance of object PATIENT could be displayed as one of the senses shown in Figure 1. Each sense (i.e., visual word) has its syn tax, semantics and pragmatics in the context of graphic design. In addition, a graphical expression, called a lexeme, is also stored.
Object Pattern
To map an object onto a visual word, we first need to know the object pattern including the type, attributes, and other object characteristics [Zhou and Feiner, 1996]. As shown in Figure 1, variable ?patient stands for an instance of PATIENT. More complex patterns can also be represented through pattern description keywords. Currently, we have implemented two keywords: type and attribute. Type speci fies the domain of the object, while attribute restricts the objects to a subset that satisfies the specified attributive con straints. For example, to represent any PATIENT whose age must be greater than 20, we use:
(object-pattern (?patient (type PATIENT) (attribute(> :age 20)))) Note that the name of each attribute is preceded by a":".
Syntax
Syntax describes the structure or pattern of a visual word. In particular, category, subcategory, and media together specify the syntactic features (Figure 2).
Category provides the type of a visual word based on the visual hierarchy described in [Zhou and Feiner, 1997], while subcategory further classifies the type information. For example, a visual word is an instance of a VISUAL-STRUC TURE. More specifically, it is in the TABLE-CHART subcate gory. Although we could go even deeper to further distinguish the visual word types, we have found a two-level Semantics hierarchy to be adequate thus far.
name of a file that contains all the graphical expressions. For example, a human model might be expressed in Inventor [Wernecke, 1994] file format in graphical model mode as : Human{ Head { . . . } Body { Chest { .. . } Waist{ .. . } . .. }
Alternatively, this description can be kept in a file named "human.iv" in graphical .file mode. Image mode signifies that the current visual object is an image file. Optionally, it can be followed by an argument to indicate the image format as shown in sense4 of Figure 2. The last media category, movie, indicates the current visual object is a video clip. Similar to image, it can also be further qualified by appending a type argument (e.g., MPEGl). ·
The advantage of providing media information is to simplify the process of handling multiple media formats and to make the system more general and extensible.
Usually, we specify a set of abstract visual operations (e.g., Scale, and Move) at a high level without worrying about the implementation details for different media. At a lower level, based on the provided media information, the abstract operations are realized by media-specific proce dures. Hiding the details of abstract visual operations makes it easier to extend the system. Consider the abstract visual operation Scale. Scale transforms the modeling matrix for a graphical model, which can change the dimensions of an image. To support a new media format, we only need to write a set of procedures to perform the Scale operation for the new medium without affecting the rest of the knowledge base.
While syntax focuses on describing the structure or pat- . IMPROVISE is designed to deal with a wide variety of tern of a visual word, semantics abstracts the meaning of the visual presentation forms (i.e., visual media formats) . We syntactic features, summarizes the thematic roles of a visual allow four media formats: graphical model, graphical .file, word, and identifies the scope of its role. Figure3 shows the image, and movie. semantic features for the PATIENT-ENTRY.
A graphical model describes a visual object in a particuSemantic sense specifies the abstraction of syntactic fealar graphics language. In graphical model mode, all graphitures of a visual word, while semantic role indicates what a cal expressions are explicitly written out as a lexeme. visual word is capable of when it participates in a visual preHowever, in graphical .file mode the lexeme refers to the sentation. Moreover, semantic scope elaborates how well a
#Text (sense1 (semantics (role Identify) (scope Naming) (sense LABEL)))# Simple body model (sense2 (semantics (role Locate) (scope SpatiaiPosition)# Complex body model (sense3 (semantics (role Locate) (scope Spatial Position) (sense SYMBOL)))# Image (sense4 (semantics (role Identify) (scope Appearance)(sense SYMBOL))) (sense PORTRAIT)))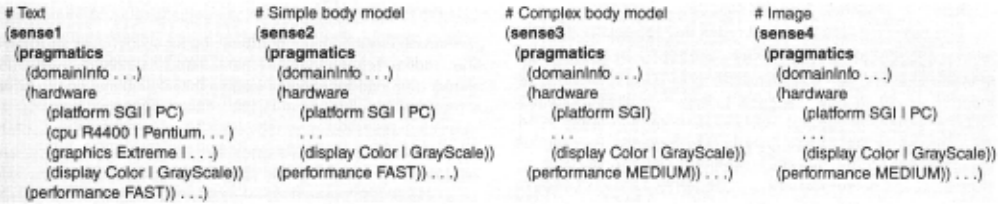
visual word can perform in the specified role. In Figure 3, sensei is a label that can only identify the patient by naming, but sense4 is a portrait that can identify the physical appear ance of the patient.
Pragmatics
In language or image understanding, pragmatic features usually refer to the roles or influences that the language or image possesses to help the user understand distinguishing features and appropriate contexts (e.g., [Goldsmith, 1984 ]). To facilitate visual design, we have extended the connotation of the pragmatic features of a visual word. Not only do we include word features that are directly related to the charac teristics of the user and context, such as the user's identity, expectations, and application type, but we also cover factors that describe the relationships between the word and the design or execution environment, such as the hardware requirements (e.g., display type) of the word. Since model ing users and system environments is a complex task itself, we concentrate on a few types of information that are partic ularly useful. They are domain information, hardware requirements, and performance estimation. Figure 4 lists the pragmatics of each word in PATIENT-ENTRY, with domain information omitted since they all share the same one:
(domainlnfo
(appType MEDICAL) (audienceType NURSE I DOCTOR))The pragmatics features of sensei in Figure 4 can be read as: the text representation of a patient's name is suitable for both nurses or doctors in a medical application. More over, this text can be rendered on a SGI or PC with color or grayscale display. The rendering speed of such a text string is fast (e.g., under a millisecond).
Although the pragmatic features involve domain-spe cific information, we can consolidate all domain-specific information by expressing it in a disjunctive form. For exam ple, if we want to use the PATIENT-ENTRY for both medical and military logistics applications, we can write:
(domainlnfo ·(info1 (appType MEDICAL) (audienceType NURSE I DOCTOR)) (info2 (appType LOGISTICS) (audienceType MEDIC I DOCTOR)))Lex erne
In a visual lexicon, each lexeme is a graphical represen tation of a visual word. Each type of representation (graphi cal model, graphical file, image, and movie) is actually a parametrized template. For example, the lexeme of sensei in PATIENT-ENTRY is:
(lexeme (VISUAL-UNITY (geometry (Text2
(string (get-name ?patient))))))
This says that the visual word is an instance of VISUAL UNITY with a geometry of 2D text, which in turn requires that the string be the name of a patient. Embedding proce dures in the representation can be very useful. It eases infor mation encoding by abstracting the common features of a visual word and expressing them in a procedural format. Suppose that every patient's picture is stored as an image in the knowledge base, and is named by the patient's ID num ber with a suffix ".tif'. Instead of explicitly listing all the patients and the file names of their pictures in the visual lexi con, we can use a single expression:
(lexeme (IMAGE (fileName (string-cat (get-id ?patient) ".tif")))) This states that the file name can be constructed by concate nating the patient's ID and the suffix ".tif'.
To be consistent with the constructive theme of IMPRO VISE, the visual lexicon stores only visual words that repre sent atomic objects. Visual representations for composite objects are built from scratch by piecing together their com ponent representations.
3.2 Usage
IMPROVISE's visual lexicon is first searched to select a visual word for a given object and then the parameters of the selected visual word are instantiated.
Visual Lexicon Selection
As described above, only atomic objects can be directly matched against the object-pattern specified in a visual lexi con entry. For example, suppose the task is to display patient Jones's demographics information to a nurse in a medical application. In our case, "demographics" is a composite object whose component objects include name, age, and gen der. The system iteratively refines the abstract plan for accomplishing the task and reaches the point where it must decide how to represent the "age" object. At this point, the system needs to match the object description (i .e. , Jones Age) against each object-pattern in the lexicon. The pattern matching is conducted by unifying the object description with an object-pattern. If the unification is successful , then all the visual words for the specific object-pattern become candidates, of which one will be selected to represent the object. In this example, the two unified entries are:
Object: (Jones-Age· (type PHYSICAL-ATTRIBUTE))
Pattern-1: (?attribute (type ATTRIBUTE))
Note that the two matched types are not necessarily the same. But PHYSICAL-ATTRIBUTE is indeed a subclass of ATTRIBUTE. For generality, matching by inheritance is allowed. If an object description matches more than one object-pattern, the system always chooses the most specific one. The lower the object type is positioned in the domain ontology hierarchy, the more specific the object type is. Moreover, the more attributive constraints an object pattern has, the more specific the pattern is. Naturally, the more spe cific object pattern inherits the lexemes that are defined for more general object patterns. Suppose there is another object-pattern:
Pattern-2: (?attribute (type PHYSICAL-ATTRIBUTE))
In this case, pattern-2 is used instead of pattern- I and patter2 also inherits all lexeme expressions defined in pattern- I . Moreover, through unification, the variable specified in the object-pattern is bound to the matched object. Thus, variable ?attribute is bound to object Jones-Age.
The task of the selection stage is to single out the most appropriate candidate. Many factors can affect the decision. We have established a set of syntactic, semantic, and prag matic constraints to aid the selection.
Syntactic constraints. Syntax governs the pattern formation in a synthesis process [Marks, 1991]. Syntactic features specified at different visual presentation levels are used to fil ter out undesired patterns to keep them from participating in higher-level patterns. Figure 5 was automatically generated by IMPROVISE to present a patient's information summa,·y to a nurse. The top-level visual description for the entire dis play is a STRUCTURE-DIAGRAM [Lohse et al., 1994], which is a subtype of VISUAL-STRUCTURE. The syntax of a STRUC TURE-DIAGRAM requires that its core component be a VISUAL-UNITY that is not in the TEXT subcategory. In this case, the core component could be one of the patient's visual representations shown in Figure 1.
Based on the descriptions in Figure 2, all visual words satisfy the syntactic constraint except sensei which is a TEXT. (The patient name in Figure 5 is not generated through defining the core component, but as part of the demographics information.) However, there are still multiple candidates that need to be ruled out.
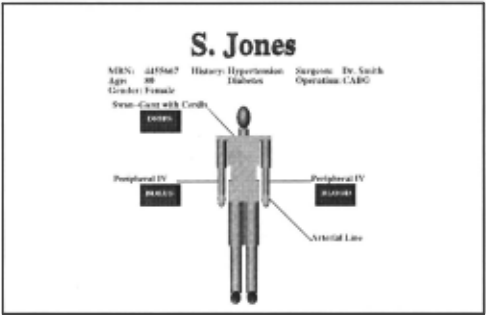
Semantic Constraints. While syntactic constraints guarantee that visual representations have valid structures, semantic constraints can be used to ensure that the syntactically valid structures are also perceptually correct. Semantic constraints can come from different aspects. One type arises from infor mation-seeking goals [Casner, 1991]. These constraints are evaluated by matching the semantic requirements to the role or scope description of the visual word. Some visual words can play some roles to a certain extent to meet the goals while others cannot. In the example of Figure 5, the task actually requires locating positions on the patient's body so that other information can be arranged around the body. By this criterion, only two choices remain: sense2 and sense], since only these two can locate body positions.
Another type of constraint is specified by high-level visual preferences. These constraints usually require that the selected visual word have a certain visual sense (e.g., be a symbol instead of a portrait), which in turn defines the potential usability of the visual word [Arens et al., 1993]. For example, a symbolic 3D graphical model can be viewed from different angles, while a portrait image cannot. In our case, the core component of the STRUCTURE-DIAGRAM is required to be a symbol. Fortunately, since both sense2 and sense] satisfy the requirements, there is no conflict.
In case all semantic constraints can be satisfied but result in a conflict set, we order the constraints by decreasing importance: first information-seeking goals, then visual pref erences. This order in tum determines the importance rank ing of the semantic features of a visual word: role, scope, and sense. In other words, when semantic constraints help determine visual word selection, a visual word should be weighted first to see whether it can fill the role to achieve the information-seeking goals, as measured by the scope of its role. While not posing any threat for achieving any informa tion-seeking goals, sense can be considered last to see whether the user's or application's visual preference can be met.
Pragmatic Constraints. Pragmatic constraints can be used to further filter out some of the undesired candidates. Like other constraints, pragmatic constraints also arise from a wide variety of sources. We have formulated several types of constraints that are most important to our applications. They come from the following aspects: application situation (including presentation type, targeted audience, and loca tion) , available hardware, criticality, and timing. Continuing with our patient example, a set of system pragmatic con straints is specified as:
(appSituation
(type SUMMARY) (audience NURSE) (location CARDIAC-ICU)) (hardware (platform PC) (display MEDIUM_RESOLUTION & COLOR)) (timing SHORT_ TIME) (criticality CRITICAL)More specifically, the system needs to present the patient's summary to a cardiac ICU nurse in a short time.
The presentation will run on a PC with a medium-resolution color display. Recall that the candidates left, after screening by both syntactic and semantic constraints, are sense2 and sense3. Based on Figure 4, sense2 is eventually chosen over sense3 since sense2 meets both timing and hardware con straints. This filtering process is done by checking the list of pragmatic features (e.g., performance) of each candidate against the pragmatic constraints (e.g., timing). Based on the success of the match, the candidate set is further pruned.
As in ordering different semantic constraints, we also rank those pragmatic constraints based on their importance: application situation, criticality, timing, and hardware.
Unlike other graphics generation systems, IMPROVISE does not require a specific order of constraint satisfactiOn (e.g., satisfying pragmatic constraints before syntactic con straints) in its design process. Instead, IMPROVISE allows the constraints to float with the design process [Elhadad eta!., 1997] and solves them when the time is right. If there is enough evidence to indicate that a constraint is satisfiable, then IMPROVISE asserts this fact by taking appropriate actions (e.g., eliminating unwanted candidates). Otherwise, IMPRO VISE defers its decision until more information is available. Thus, IMPROVISE operates in a least-commitment manner [Cohen and Feigenbaum, 1989] and avoids unnecessary backtracking over arbitrary decisions.
Visual Lexicon Instantiation
After a visual word is selected, it will be instantiated once there is enough information to supply parameter values. Like selection process, the instantiation also adopts a least commitment algorithm: no instantiation is made unless there is enough information.
Instantiation involves two steps. The first step is to replace the object variable specified in the object-pattern. This is straightforward: the object variable is replaced, wher ever it appears, with the name of the object with which the variable is unified. For example, if variable ?patient is bound to patient Jones, an expression such as (get-name ?patient) will be replaced by (get-name Jones). The second step deals with the parameters in a lexeme. For conciseness and efficiency, only key information is explicitly expressed in a lexeme. For example, if text is chosen to represent patient Jones's name, the lexeme in the visual word specifies:
(Text2 (string (get-name Jones)))
However, this is inadequate for realizing the name: addi tional information, such as text font or text color, needs to be supplied. Certainly, default values can be provided as part of the knowledge base (as they are in IMPROVISE), but default values are not always the desired ones. Moreover, different visual words have a different set of parameters and the num ber of parameters can be large (e.g., 10 to 15). Instead of explicitly expressing all parameters for each word in the visual lexicon, a set of variables is automatically generated to represent those parameters once a word is selected. In our example, the expression is actually expanded as:
(Text2
(string (get-name Jones)) (font ?font-1) · (color ?color-1)Instantiating each variable in this extended format is a challenging task because effectiveness and consistency must be taken into account. Effectiveness constraints from various sources restrict the variable to certain values. For example, if the system runs on a very slow platform, it would probably be better to display a 3D graphical model as a wireframe instead of with shaded polygons. Thus, the parameter draw mode for this particular graphical model might take value wireframe instead of solid.
Unlike most text generation systems that try to use para phrasing to avoid repetitions, most graphics generation sys tems try to maintain design consistency by reusing the same visual cues whenever possible [Zhou and Feiner, 1997]. Unless there is a good reason to do otherwise, similar objects should appear alike in the course of visual presentation. Using variables in visual word descriptions eases this task. For example, if a consistency rule asserts that all text objects that represent a patient's name should appear in the same font and color, then all the variables representing font and color in the text can be co-referred (e.g., ?font-1 is ?font-2, and vice versa). In other words, if any one of them is instan tiated, all co-referred variables are instantiated at the same time to the same value.
There are other factors that also need to be taken into account in instantiation; for example, instantiating one vari able could affect the instantiation of another. Assuming that the current background color is instantiated to blue, then per ceptual rules demand that the text color should not be instan tiated to red.
4 Conclusions and Future Work
We have implemented a system that combines a con structive graphics synthesis approach with a parametric graphics synthesis approach. In this paper, we have pre sented the core component of our parametric approach. A visual lexicon is used to generate visual descriptions for atomic domain objects during synthesis. We have described a comprehensive, general, and extensible formalism to repre sent the lexical entries. Figure 6 summarizes all possible val ues that are used to describe the syntax and semantics of a visual word. However it is worth noting that some of the val ues are correlated; for example, if syntactic category takes VISUAL-UNITY as its value, then its subcategory can never be a TABLE-CHART. Theoretically, we could encode complex visual representations such as TIME-CHART in a visual word. To retain the flexibility and extensibility of constructive graphics synthesis, we usually construct complex visual pre sentations from scratch while keeping already-made simple visual representations in the visual lexicon. Furthermore, we have formulated a set of constraints to guide the selection and instantiation of the visual lexical items in parametric synthesis.
We believe that this hybrid takes advantage of both para metric and constructive approaches to make graphics genera tion more powerful, efficient, and flexible. As in a constructive approach, the system is inherently flexible and extensible. As in a parametric approach, we gain efficiency by providing a reduced search space and facilitate knowl edge encoding through reuse of visual words.
| Syntactic | Semantic Descriptions | |||
|---|---|---|---|---|
| Slots | Descriptions Value Description | Slots | Value Description | |
| Category | VISUAL-STRUCTURE TABLE-CHART TIME-CHART | VISUAL-UNITY IMAGE VIDEO TEXT | Sense | LABEL LIST PLOT SYMBOL |
| Subcate- gory | BAR-GRAPH LINE-GRAPH PIE-GRAPH GRAPHICS-MODEL GRAPHICS-FILE | 2D-SHAPE 3D-SHAPE GRAPHICS-MODEL GRAPHICS-FILE IMAGE | Role | PORTRAIT CLUSTER IDENTIFY LOCATE DISTINGUISH |
| Medium | [TIFF I RGB I GIF I PICT) VIDEO [MPEG1 I SGI I QTIME) | Scope | PROPOSITION SPATIAL-RELATION CONCEPT-FUNCTION | |
Several areas could be further improved to make the approach more systematic and comprehensive. One is to use a good computational model (e.g., a probability model) to describe various constraints more accurately. As most of the constraint values are expressed qualitatively in discrete val ues (e.g., short and long describe the timing information), a better model can be used to provide more precise quantita tive measurements. Probabilistic reasoning [Russell and Norvig, 1995] could also be incorporated to aid the genera tion process and model constraints. Last, but not least, the capabilities of each visual word need to be further studied to allow a more comprehensive understanding of various visual forms.
@inproceedings{ijcai1997p153,
  title     = {The Representation and Use of a Visual Lexicon for Automated Graphics Generation},
  author    = {Zhou, Michelle X. and Feiner, Steven},
  booktitle = {Proceedings of the Fifteenth International Joint Conference on
               Artificial Intelligence, {IJCAI-97}},
  publisher = {International Joint Conferences on Artificial Intelligence},
  editor    = {Martha E. Pollack},
  pages     = {1056--1064},
  year      = {1997},
  note      = {Natural-language Processing and Graphical Presentation},
  url       = {https://ijcai.org/proceedings/1997/153},
}
TY - CPAPER TI - The Representation and Use of a Visual Lexicon for Automated Graphics Generation AU - Zhou, Michelle X. AU - Feiner, Steven T2 - Proceedings of the Fifteenth International Joint Conference on Artificial Intelligence, IJCAI-97 PB - International Joint Conferences on Artificial Intelligence PY - 1997 SP - 1056 EP - 1064 UR - https://ijcai.org/proceedings/1997/153 ER -Copied
Machine-readable versions of this paper, for tools and AI agents:





