
On Biases in Estimating Multi-Valued Attributes
Proceedings of the Fourteenth International Joint Conference on Artificial Intelligence. Learning. Pages 1034-1039.
© 1995 International Joint Conferences on Artificial Intelligence
Abstract
We ana lyse the biases of eleven measures for estimating the quality of the multi-valued attributes. The values of information gain, ]measure, gini-index, and relevance tend to linearly increase with the number of values of an attribute. The values of gain-ratio, distance measure, Relief , and the weight of evidence decrease for informative attributes and increase for irrelevant attributes. The bias of the statistic tests based on the chi-square distribution is similar but these functions are not able to discriminate among the attributes of different quality. We also introduce a new function based on the MDL principle whose value slightly decreases with the increasing number of attribute's values.
- Bairn, 1988
- P.W. Bairn. A method for attribute selec- tion in inductive learning systems. IEEE Trans. on PAM!, 10:888-896, 1988.
- [Breiman et al., 1984] L. Breiman, J .H. Friedman, R .A. Olshen, and C.J. Stone. Classification and Regression Trees. Wadsworth International Group, 1984.
- [Kira and Rendell, 1992] K. Kira and L. Rendell. A practical approach to feature selection. Proc. Intern. Conf. on Machine Learning (Aberdeen, July 1992)
- D.Sleeman and P.Edwards (eds.), Morgan Kaufmann , pp .249-256.
- [Kononenko, 1994] I. Kononenko. Estimating at- tributes: Analysis and extensions of RELIEF . Proc. European Conf. on Machine Learning (Catania, April 1994), L. De Raedt and F.Bergadano (eds .), Springer Verlag, pp.171-182.
- [Li and Vitanyi, 1993] M. Li and P. Vitanyi . An in- troduction to J( olmogorov Complexity and its appli- cations, Springer Verlag , 1993.
- [Mantaras, 1989] R.L. Mantaras. ID3 Revisited : A dis- tance based criterion for attribute selection. Proc. Int . Symp. Methodologies for Intelligent Systems, Char- lotte, North Carolina, U.S.A., Oct. 1989.
- [Michie, 1989] D. Michie. Personal Models of Rational- ity. ]. of Statistical Planning and Inference, Special Issue on Foundations and Philosophy of Probability and Statistics, 21, 1989.
- [Press et al., 1988] W .H. Press, S.A . Teukolsky, W .T. Vettering, B.P. Flannery. Numerical recipes in C: The art of scientific computing, Cambridge University Press, 1988.
- [Quinlan, 1986] R. Quinlan . Induction of decision trees. Machine Learning, 1:81-106, 1986.
- [Rissanen, 1983] J .R.Rissanen J . A universal prior for integers and estimation by minimum description length. Annals of Statistics , 11 :4 16-431 , 1983.
- [Smyth and Goodman, 1990] P . Smyth and R .M. Good- man. Rule induction using information theory. In . G .Piatetsky-Shapiro and W .Frawley ( eds.) J( now/edge Discovery in Databases, MIT Press, 1990.
- [White and Liu, 1994] A.P. White and W.Z. Liu. Bias in information-based measures in decision tree induction . Machine Learning, 15:321-329 , 1994.
References were extracted automatically from the PDF and may contain errors.
Full text extracted automatically from the PDF; figures, tables and equations may differ. The PDF is the version of record.
1 Introduction
In top down induction of decision trees various impurity functions are used to estimate the quality of attributes in order to select the "best" one to split on. However, various heuristics tend to overestimate the multi-valued attributes. One possible approach to this problem in top down induction of decision trees is the construction of binary decision trees. The other approach is to intro duce a kind of normalization into the selection criterion, such as gain-ratio [Quinlan, 1986] and distance measure [Mantaras, 1989].
Recently, White and Liu [1994] showed that , even with normalization, information based heuristics still tend to overestimate the attributes with more values. Their ex periments indicated that x 2 and G statistics are superior estimation techniques to information gain, gain ratio, and distance measure. They used the Monte Carlo sim ulation technique to generate artificial data sets with at tributes with various numbers of values. However, their scenario included only random attributes with the uni form distribution over attributes' values, generated Ill dependently of the class.
where all the logarithms are of the base two. The infor mation gain is defined as the transmitted information by a given attribute about the object's class:
In order to avoid the overestimation of the multivalued attributes Quinlan [1986] introduced the gain-ratio:
Mantaras [1 989] defined a distance measure D that can be rewritten as [White and Liu, 1994] :
Smyth and Goodman [1990] introduced the ]-measure for estimating the information content of the rule which is appropriate for selecting a single attribute-value for rule generation:
A straightforward generalization gives the attribute se lection measure:
Another selection measure related to information theory is the average absolute weight of evidence [Michie, 1989]. It is based on plausibility which is an alternative to en tropy from the information theory. Let odds= p/(1-p) . The measure is defined for only two class problems:
and it holds W E1 = W E2. A straightforward general ization can be used for multi-class problems:
2.2 Gini-index and RELIEF
Breiman et al. [1984] use gini-index as the (nonnegative) attribute selection measure:
Kira and Rendell [1992] defined the algorithm RELIEF for estimating the quality of attributes. RELIEF effi ciently deals 0 with strongly dependent attributes. The idea behind is the search for the nearest instances from the same class and the nearest instances from different classes. Kononenko [1994] showed that , if this "nearest" condition is omitted, the estimates of RELIEF can be viewed as the approximation of the following difference of probabilities:
which can be reformulated into:
where
is highly correlated with the gini-index. The only differ ence to equation (6) is that instead of the factor
In our experiments, besides Gini and Relief , we evalu ated Gini' as well in order to verify whether this differ ence to equation (6) is significant or not .
2.3 Relevance
Bairn [1988] introduced a selection measure called the relevance of an attribute. Let for a given attribute value j be
The relevance of the attribute is defined with:
2.4 x 2 and G statistics
The measures based on the chi-square distribution use the following formula:
where p(x)n is the chi-square distribution with D de grees of freedom and X 0 is the value of the statistic for a given attribute. Press et al. [1988] give the algorithms for evaluating the above formula . We have two statistics that are well approximated by the chi-square distribu tion with (V- 1)(C- 1) degrees offreedom [White and Liu, 1994], x 2 and G:
and
2.5 MDL
According to the minimal description length principle [Rissanen, 1983; Li and Vitanyi, 1993] the problem of selecting the best attribute can be stated as the problem of selecting the most compressive attribute. Let us have the following transmission problem. Both, the sender and the receiver have the description of the number of attributes A, the number of possible values for each at tribute V, the number of possible classes C, and the de scription of the training examples in terms of attribute values. But only the sender knows the correct classifi cation of examples. This information should be trans mitted by minimizing the length (the number of bits) of the message. The sender may either explicitly code the class for each training example or may select the "best" attribute and encode, for each value of the selected at tribute , the classes of the examples having that value of the attribute. Therefore, either we have one coding scheme for the prior distribution of classes, or we have a separate coding scheme for each value of the attribute with the associated posterior distribution. For each cod ing scheme a decoder has to be transmitted as well.
The number of bits, that are needed to explicitly en code classes of examples for a given probability distribu tion, can be approximated with entropy H c times the number of training examples n . plus the number of bits needed to encode the decoder. For any coding rule the sufficient information to reconstruct the decoder is the probability distribution of events, i.e. classes . Therefore, if n .. is known , to reconstruct the decoder, the receiver needs to reconstruct only n; ., i = l..C - 1 ( nc. can be then uniquely determined) . There is n. + C- 1 over C- 1 possible distributions. Therefore, the approximation of the total number of bits that we need to encode the classes of n .. examples is:
and the approximation of the number of bits to encode the classes of examples in all subsets corresponding to all values of the selected attribute is:
The last term (log A) is needed to encode the selection of an attribute among A attributes . However, this term is constant for a given selection problem and can be ig nored. The first term is equal to n .. HGIA· Therefore, the MDL' measure that evaluates the average compression (per instance) of the message by an attribute is defined with the following difference Prior_MDL ' - PosLMDL ' normalized with n .. : MDL'= Gain+
However, entropy He can be used to derive MDL ' if the messages are of arbitrary length . If the length of the message is known, the more optimal coding uses the logarithm of all possible combinations of class labels for given probability distribution:
This gives better definition for MDL:
0.25 k (a)
3 Experimental scenariO
We adopted and extended the scenario of White and Liu (1994). Their scenario included the following variations of settings: the number of classes was 2 and 5, the distri bution of classes was uniform (except in one experiment when they used a non-uniform distribution) and there were three attributes with 2, 5, and 10 possible values which were randomly generated from the uniform distri bution independently of the class. They performed the Monte Carlo simulation by 1000 times randomly gener ating 600 training instances with the above properties. The quality of all attributes was estimated using all mea sures described in Section 2 and the results of each mea sure were averaged over 1000 trials.
We extended the scenario in the following directions:
1. We tried the following numbers of classes: 2, 5, 10, and the following numbers of attribute values: 2, 5, 10, 20, 40
2. We used also informative attributes. The attributes with different number of values are made equally infor mative by joining the values of the attribute into two subsets: {1, ... , (V div 2)} and {(V div 2 + 1) , ... , V} , corresponding to two values of the binary attribute. The probability that the value is from the subset depends on the class while the selection of one particular value in side the subset is random from the uniform distribution. The probability that the value is in one subset is defined with :
We tried various values for k: (k = 0, 1, 2) which de termines how informative is the attribute. For example, for 2 possible .classes with uniform distribution, the in formation gain of the two-valued attribute is 0.13 bits if k = 1 and 0.32 bits if k = 2, and for 10 possible classes it is 0.66 bits if k = 1 and 0.77 bits if k = 2. However , the biases of all measures were not very sensitive to the value of k. In the next section we give the results for k = 1.
3. We tried also various non-uniform distributions of attribute values for uninformative attributes and also various non-uniform distributions of classes for each possible distribution of attribute values (uniform, non uniform, informative). The biases of all measures were independent of the distribution of classes and for unin formative attributes also independent of the distribution of attribute values. The graphs in the next section are for uniform distribution of classes.
4 Results
We will show here two different results: for irrelevant (uninformative) and informative attributes . We will present results jointly for the measures with the simi lar behavior.
4.1 Linear bias in favor of multivalued attributes
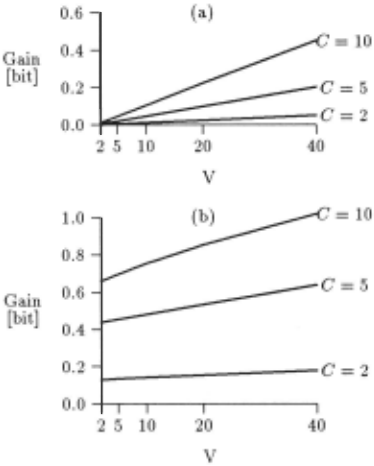
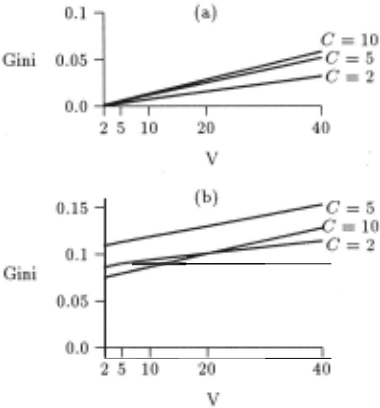
The values of measures increase linearly with the number of values of attributes, in all different scenarios and for all different numbers of classes, for the following measures: Gain (1) , J (4), Gini (6), and Gini' (8). On Figures 1 (a) and (b) the values of Gain are depicted. ]-measure has similar graphs.
Note that the scale of the graph for Gini is not com parable to the scale for Gain. Gini and Gini' have prac tically identical graphs. The difference to Gain is that Gini tends to decrease with the increasing number of classes, which seems to be undesired feature for selection measures. This is shown on Figure 2 (b) where the values of Gini for higher number of classes, where attributes are even more informative (see eq. (15)), are lower than the values for lower number of classes. This becomes even more obvious for more informative attributes (e.g. for k = 2 in eq. (15)), where the graph becomes similar to that on Figure 3 (b) except that for Gini all curves are straight lines with higher slope.
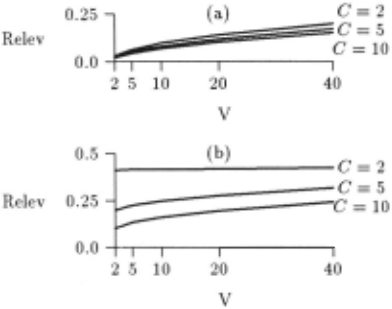
Relev (9) has similar behavior like gini-index, except that the estimates increase less than linearly with the number of values of attributes. Figure 3 shows this. Note that relevance tends to decrease with the increasing number of classes even though the attributes for prob lems with more classes are more informative.
4.2 Exponential bias against the informative multivalued attributes
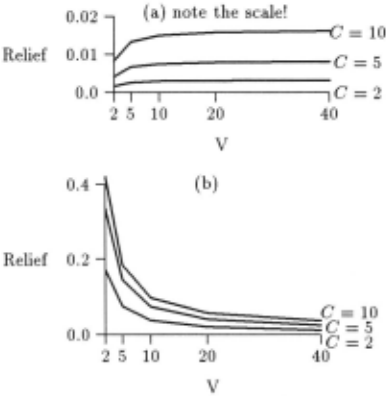
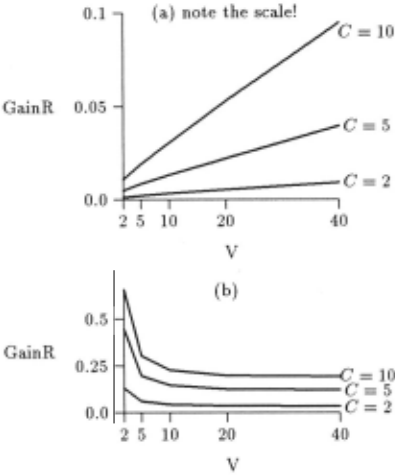
The estimates of informative and highly informative at tributes decrease exponentially with the number of val ues of attributes for GainR (2), 1 - D (3), and Relief (7). However , for irrelevant attributes, all three measures exhibit the bias in favor of the multivalued at tributes. The estimates of Relief increase logarithmi cally with the number of values while for 1 - D and GainR the estimates increase linearly. Figure 4 shows both biases for Relief and Figure 5 shows both biases for GainR . The performance of 1- D is very similar to that of GainR . Note the different scales for irrelevant and informative attributes. ·This shows that the bias in favor of the irrelevant multi valued attributes is not very strong and is the lowest for Relief .
4.3 Slight bias against the multivalued attributes
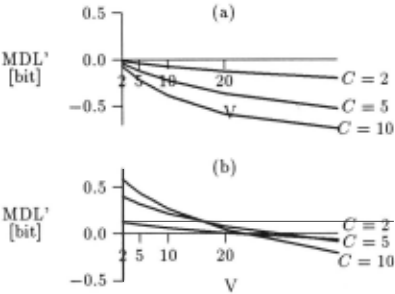
MDL' (13) exhibits the bias against the multi valued at tributes. MDL' almost linearly decreases with the num ber of values of attributes in all scenarios , as is shown on Figures 6 (a) and (b). As expected, from the definition in eq. ( 13), the bias (the slope of the curve) is higher for the problems with the higher number of classes. Namely, the number of classes influences the number of bits needed to encode the decoders .
MDL ' is always negative for irrelevant attributes and , therefore, the irrelevant attributes are always consid ered as non-compressive. For informative attributes the compression decreases with the number of values of at tributes.
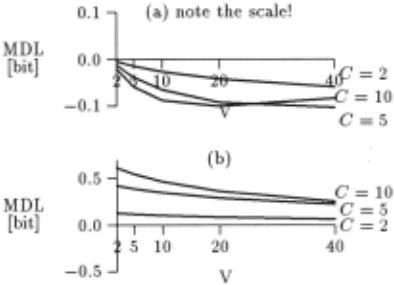
MDL (14) has similar behaviour as MDL ' for irrele vant attributes, however , the slope of the curves is lower and all informative attributes are considered compres sive. This is shown on Figure 7.
The behavior of WE (5) is not stable. The reason may be in the use of the non-differentiable function (absolute values). The behavior seems to be somewhere between Relev (for irrelevant attributes) and MDL ' (for informa tive attributes). This is shown on Figure 8. Like MDL ', WE decreases faster for the problems with more classes.
4.4 Almost unbiased but also non-discriminating measures
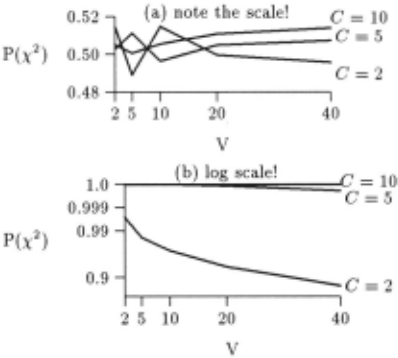
Figure 9 (a) shows that P(x 2 ) defined with eq. (10) and (11) is unbiased, i.e. its values do not show any tendency with increasing number of values of attributes. However, this measure is not able to distinguish between more and less informative attributes . All informative attributes (for k = 1 and 2 in eq. (15)) have P(x 2 ) = 1.00000 ... , regardless of the number of values. In fact, when using floating point, in the case when C = 2 and V > 5, we detected that P(x 2 ) differs from 1.0 in sometimes ex otic decimal places (like 37th decimal place). Of course this is the problem of computer precision and numerical evaluation of eq. (10). But the fact is, that on most com puters without special algorithms this measure will not be able to distinguish between attributes with different quality, which makes the measure impractical. Someone may argue, that in the cases .when P(x 2 ) = 1.0 the value of x 2 could be used. This can be done only when com paring the attributes with exactly the same number of values (the same degree of freedom) which is not very useful .
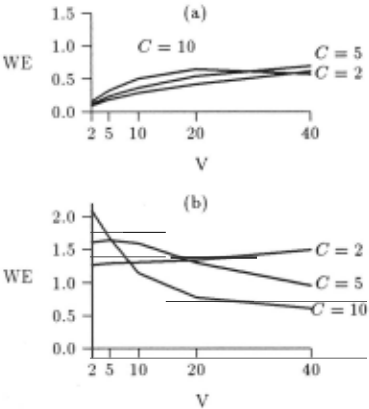
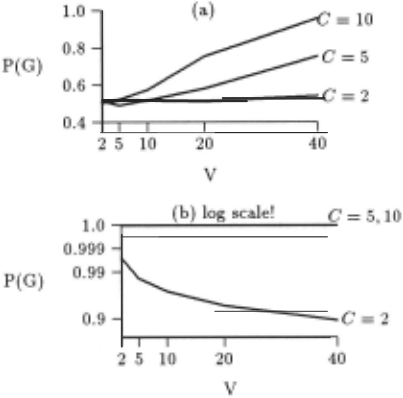
Figure 10 (a) shows that P(G) defined with equations (10) and (12) overestimates the multivalued attributes, which is not in agreement with the conclusions by White and Liu [1994]. Their conclusions seem valid if the fig ure is limited to C = 2 and 5 and V = 2, 5 and 10, which was their original scenario. Besides, P(G) has the same problems as P(x 2 ) with informative attributes. Its values for informative attributes are all equal to 1.0.
We verified this for P(x 2 ) and P( G) by varying the parameter k in eq. (15): k =0.0, 0.25, 0.50 ... As soon as k > 0 all attributes are too informative and both statistics get the value 1.0. The results in Figures 9 (b) and 10 (b) for k = 0 show the biases for P(x 2 ) and P( G) against the multivalued attributes for slightly informa tive attributes.
note te scale!
5 Conclusions
While our results with the original scenario by White and Liu are the same, an increase of the number of at tribute values shows a slightly different picture and fur ther variations of the scenario reveal that their conclu sions should be considered with caution. P( G) shows clear bias in favor of irrelevant multivalued attributes. P(x 2 ) and P( G) measures seem to be biased against the informative multi valued attributes. However, the prob lem of evaluating the correct value with the given com puter precision makes this functions impractical as they are not able to discriminate between the attributes of different quality.
From our results we can conclude that the worst mea sures are those whose values in all different scenarios tend to increase with the number of values of an at tribute: information gain, ]-measure, gini-index, and relevance. Some of the measures (gini-index and rel evance) exhibit an undesired behavior: their values de crease with the increasing number of classes even though the attributes for problems with more classes are more informative. However, the weight of evidence and MDL (13) show similar tendency but only with the increasing number of attribute's values. For MDL, this behavior can be explained in terms of the number of bits required to encode the decoders. For uninformative attributes, the bias of WE is similar to the bias of relevance, how ever, its bias is not stable.
The performance of gain-ratio, distance measure, and Relief , which all use a kind of normalization, is simi lar. The values exponentially decrease for informative attributes and increase for irrelevant attributes. For ir relevant attributes the performance of Relief seems to be better, as the bias in favor of multivalued attributes is not linear but rather logarithmic. However, the exponential bias against the multivalued attributes can hardly be justified and more conservative bias may be more accept able.
The purpose of this investigation was to analyse the performance of various measures on multivalued at tributes, independent to other attributes . We used the name Relief for the function (7) which is derived from the original function of RELIEF by omiting the search for the nearest instances. Among all the measures only RELIEF (together with the search for the nearest in stances) is non-myopic in the sense that it is able to appropriately deal with strongly dependent attributes. Besides, RELIEF can also efficiently estimate continuous attributes [Kira and Rendell, 1992]. The extensions in troduced in the algorithm RELIEFF [Kononenko, 1994] enable it to efficiently deal with noisy data, missing val ues, and multi-class problems. All these important fea tures, together with the relatively acceptable bias de scribed in this paper, make RELIEFF a promising mea sure.
The values of two new selection measures based on the MDL principle slightly decrease with the increasing num ber of attribute's values. This bias is stable and seems to be better than the bias of other selection measures. The selection measures have natural interpretation and also show when the attribute is not useful at all: if it is not compressive, i.e. when the value of MDL' (13) or MDL (14) is less than or equal to zero. MDL seems more appropriate than MDL': it uses optimal coding and its graphs have lower (negative) slopes which indicates lower bias against the multivalued attributes.
Acknowledgments
I thank Matevz Kovacic, Uros Pompe, and Marko Rob nik for discussions on the MDL principle and for com ments on earlier drafts of the paper .
@inproceedings{ijcai1995p134,
  title     = {On Biases in Estimating Multi-Valued Attributes},
  author    = {Kononenko, Igor},
  booktitle = {Proceedings of the Fourteenth International Joint Conference on
               Artificial Intelligence, {IJCAI-95}},
  publisher = {International Joint Conferences on Artificial Intelligence},
  editor    = {Chris S. Mellish},
  pages     = {1034--1039},
  year      = {1995},
  note      = {Learning},
  url       = {https://ijcai.org/proceedings/1995/134},
}
TY - CPAPER TI - On Biases in Estimating Multi-Valued Attributes AU - Kononenko, Igor T2 - Proceedings of the Fourteenth International Joint Conference on Artificial Intelligence, IJCAI-95 PB - International Joint Conferences on Artificial Intelligence PY - 1995 SP - 1034 EP - 1039 UR - https://ijcai.org/proceedings/1995/134 ER -Copied
Machine-readable versions of this paper, for tools and AI agents:





