
A Cognitive Model of Figure Segregation
Proceedings of the Twelfth International Joint Conference on Artificial Intelligence. Cognitive Modeling. Pages 366-371.
© 1991 International Joint Conferences on Artificial Intelligence
Abstract
When humans look at a complex and ambiguous figure, they divide it into several elemental figures. This human visual characteristic is called figure segregation. There is a problem when constructing a cognitive model for figure segregation. That is, one interpretation is selected by most people for some figures, and several interpretations are selected almost equally for other figures. This paper discusses the deciding selection frequency problem. First, a geometrical function is introduced for describing line figures. Next, several Gestalt features (such as symmetry, continuity, etc) are defined using the function. Then, by applying linear multiple regression analysis, the characteristic value of each interpretation is obtained, and the selection frequency is calculated. The results of a psychological experiment show that the model proposed here can simulate human visual perception in figure segregation fairly well.
- [Kanizsa, 1979] G. Kanizsa. Organization in Vision : Euay8 on Ge!talt Perception. Praeger Publishers, 1979.
- [Metzger, 1953] W. Metzger. GESETZE DES SEHENS. Verlag von Waldemar Kramer, Frankfurt am Main, 1953.
- [Shimaya and Yoroizawa, 1988] A. Shimaya and I. Yoroizawa. A figure segregation cri- terion based on human visual characteristics. IEICE Technical Report, PRU88-72, 1988. (in Japanese).
- [Shimaya and Yoroizawa, 1990a] A. Shimaya and I. Yoroizawa. Automatic creation of reasonable in- terpretations for complex line figures. Proc. of 10th International Conference on Pattern Recognition, Vol. !:pages 480-484, 1990.
- [Shimaya and Yoroizawa, 1990b] A. Shimaya and I. Yoroizawa. Quantitative analysis on figure segrega- tion. ITEJ Technical Report, VAI'90-18:pages 55-60, 1990. (in Japanese).
- [Spoehr and Lehmkule, 1982] K. T. Spoehr and S. W. Lehmkule. Vi!ual Information Processing. W. h. Freeman and Company, New York, 1982.
- [Tuijl, 1980] H.F .J .M. van Tuijl. Perceptual interpreta- tion of complex line patterns. journal of Ezperimen- tal P!ychology: Human Perception and Performance, vol.6, No.2, 1980.
- [Uesaka and Tajima, 1976] Y. Uesaka and K. Tajima. An interpretative model of figure segregation. Trans. of IEICE, Vol.59, D-1, 1976. (in Japanese).
References were extracted automatically from the PDF and may contain errors.
Full text extracted automatically from the PDF; figures, tables and equations may differ. The PDF is the version of record.
1 Introduction
What is figure segregation ? When humans look at a complex and ambiguous figure, they divide it into sev eral elemental figures (Figure 1 ). In psychology, this characteristic of human visual perception is called figure segregation. How can we construct a cognitive model of figure segregation ? Why is it difficult ? It is difficult because there are two processes to be considered.
(1) How to create a small number of natural interpre tations from an infinite number of possible interpreta tions.
(2) How to decide selection frequencies among those interpretations. (in other words, how to estimate which interpretation will be selected by what percentage.)
Although research on figure segregation modeling is very limited, some research has been reported [Uesaka and Tajima, 1976] [Tuijl, 1980]. However, these models do not include process (1) at all and treat only process (2), and even in the process (2), there are the problems stated below.
(a) they decide segregation characteristic vale with a single measure; therefore, their algorithms are not robust and hard to improve.
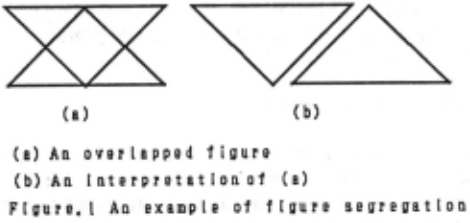
(b) their algorithms only estimate which interpreta tion is likely to be selected more; therefore, they cannot estimate selection frequency.
We have already reported the automatic creation of reasonable interpretations for complex and ambiguous figures to cover process (1) [Shimaya and Yoroizawa, 1990a]. This paper discusses process (2). In order to solve problems (a) and (b), it is necessary to simulate human visual perception. We first introduce a general ized total curvature function for describing line figures in section 2. Five Gestalt factors(such as symmetry, con tinuity, etc) of each subfigure are defined with the to tal curvature function in section 3. Two more factors among the subfigures are defined in section 4. The ef fectiveness of each factor is examined from the results of a psychological experiment in section 5. Then by apply ing linear multiple regression analysis, the characteristic value of each interpretation is obtained, and the selec tion frequency is calculated in section 6. Section 7 is the conclusion that the model proposed here can simulate the human visual perception in figure segregation fairly well.
2 Description of a line figure
In order to check the geometrical characteristics of an in terpretation, it is necessary to describe each subfigure in the interpretation. Initially, the subfigure is a closed line figure of two dimensions. Curvature can completely de scribe any two-dimensional smooth line figure. Let s be the length of a line from a starting point and (:z:(s), y(s)) represents a point using X-Y co-ordinates. Then curvature k(s} of the point is given as
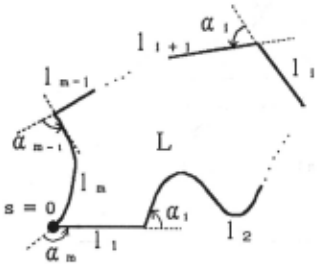
However, the curvature itself is not suitable for de scribing line figures because it is not defined at the cor ners. Therefore, we introduce the total curvature func tion 8( 8) in order to describe general line figures. The to tal curvature function is originally the integral of curva ture and defined with only smooth curves, but it can be applied to non-smooth curves by adding the angles at the discontinuous points in curvature[Uesaka and Tajima, 1976]. Now let's consider the line figure L (Figure 2}. Let L be composed of m pieces of smooth arcs It, l2, ... , lm. a, is the discrete part between l, and li+l· Let 8i be the length from the starting point to the end point of arc i. Then 8(8) at a point at distances (8n ~ 8 < 8n+d from the starting point is defined as
where
k,(8) : curvature of a point on line segment i a, : the angle from the tangent at the end point of l, to the tangent at the starting point of li+l· Let -7r < a,~ 7r.
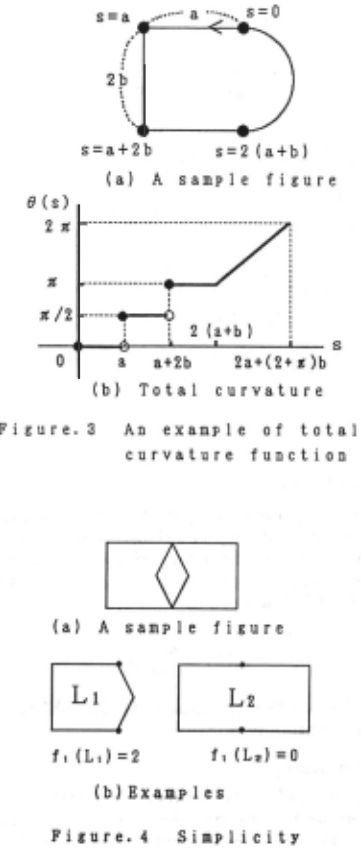
An example of 8(8) is shown in Figure 3. Note that if the starting point and tracing direction of a line figure is given, then 8( 8) of the figure is uniquely decided and that if 8(8) is given, the line figure is uniquely decided.
3 Description of Gestalt factors
Figure segregation has been discussed in psychology, es pecially by Gestalt psychologists. They claimed that several factors( symmetry, continuity, etc) play an impor tant role in figure segregation [Metzger, 1953] [Spoehr and Lehmkule, 1982]. However, they only claimed the general effect of those Gestalt factors in figure segrega tion. In other words, their analyses were qualitative. In order to construct a cognitive figure segregation model, it is necessary to give quantitative measure to those fac tors [Shimaya and Yoroizawa, 1988]. Therefore, we give quantitative definitions of the Gestalt factors in each subfigure with total curvature function. In this section, simplicity, continuity, symmetry, regularity, and convex ity of subfigures are defined with 8(8).
3.1 Simplicity
The number of discrete points in 8( 8) at the cross points of a subfigure represents the simplicity of the fig ure(Figure 4}. Therefore, if 8(8) of subfigure L has m discreation at cross points, then the simplicity of L is defined as
It can be said that the smaller ft of a subfigure is, the simpler it is.
3.2 Continuity
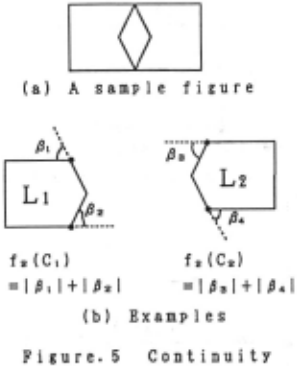
The discrete parts of 9( 8) at the cross points corre spond to the continuity of subfigures in a certain seg regation(Figure 5). Therefore, if the 9(8) of subfigure L has m discrete parts (/31 ,/32, ... , /3m) at cross points, continuity of L is defined as
It can be said that the smaller h of a subfigure is, the better it's continuity is.
3.3 Symmetry
If subfigure L (whose total curvature is 9( 8)) is symmet ric with respect to an axis, there exists a starting point which satisfies the following equation(Figure 6).
where S is the total length of L. The line which con nects the starting point and the point at a distance of S/2 becomes the symmetrical axis.
Thus, symmetry of L with regard to axes can be de fined as
where 9z(8) is the generalized total curvature of L when the starting point is x. This definition means that the symmetry of a subfigure corresponds to the minimum distance of 9( 8) between the subfigure and a symmetrical figure which has the same length.
Similarly, if subfigure L is symmetric with regard to n th order of rotation (in other words, if L returns to it's original shape by rotating at least 360/n degree), then there exists a starting point which satisfies the following equation(Figure 7).
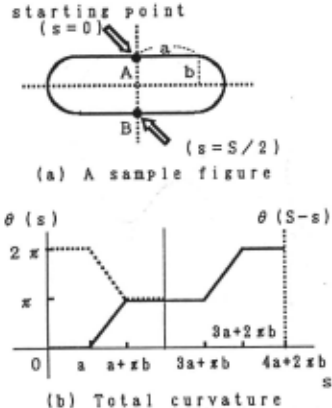
Thus, symmetry of L with regard to rotation can be defined as
Then, symmetry of L is defined as
if L has n symmetrical axes and also is symmetric with m th order ofrotation, then h(L) is redefined as follows.
This means that parallelograms and trapezoids that have a symmetrical axis are the same level of symmetry. It can be said that the smaller h of a subfigure is, the more symmetric it is.
3.4 Regularity
It is difficult to say how much regular a figure is. Hu mans feel circular arcs and straight lines are very regular. Therefore, in order to check the regularity of a subfigure, we first approximate 9( s) of component lines to that of straight lines or circular arcs. The curvature of circular arcs is constant and the curvature of straight lines is 0, therefore, both of their 9( 8) can be described by a linear function of s. If a given figure L is composed of m pieces of smooth lines(h,l2, ... ,lm), it is approximated as
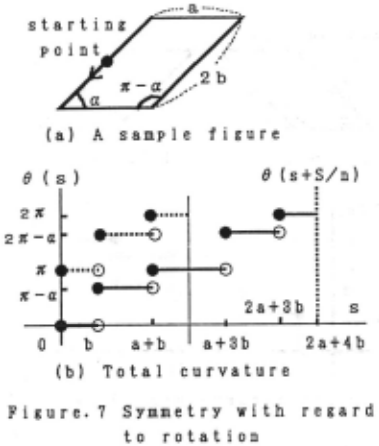
where
Li : length of line li
Si : length of the line from starting point to the end of line li
8( s) : total curvature of L
~. bi : constants
Further, if a subfigure is composed of only circular arcs and straight lines, the figure is considered to be more regular. Therefore, regularity of subfigure L is defined as
where Dc(L) is the D(L) when all the arcs of L is approximated by circular arcs, and D,(L) is the D(L) approximated by straight lines. It can be said that the smaller / 4 of a subfigure is, the more regular it is.
3.5 Convexity
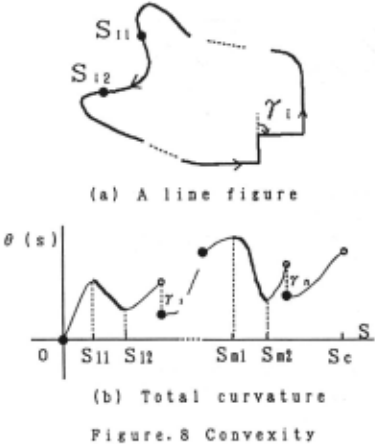
Convexity and concavity may have something to do with the selection of interpretations. Convex lines have a pos itive curvature, and concave lines have a negative curva.. ture. Note one line may have both concave and convex segments in any order. Remember that the total cur vature is originally the integral of curvature. Thus, de creasing 8( s) values indicate that the su bfigure is concave at these points. Note that there are two ways in which 8(s) values decrease: continuous and discontinuous.
If 8( s) of subfigure L is composed of m continu ously decreasing parts and n discontinuously decreasing parts(Figure 8), then the convexity of Lis defined as
It can be said that the smaller /s of a subfigure is, the more convex it is.
3.6 Gestalt factors of an interpretation
Five Gestalt factors of a subfigure have been defined. In figure segregation, several subfigures are combined into an interpretation of the complex and ambiguous figure. Each subfigure has five Gestalt factors and by averaging the corresponding factors of the subfigures, an equiva.. lent set of five Gestalt values can be created for each interpretation.
If interpretation I is composed of m subfigures, then the Gestalt values of each interpretation are defined as
where /i(k) is the Gestalt value of subfigure k.
4 Characteristics among the subfigures
The five Gestalt factors mentioned in section 3 are de fined with each subfigure. However, it seems that there exist some characteristics that are defined among several subfigures [Shimaya and Yoroizawa, 1990b]. Therefore, we introduce two more characteristics.
4.1 Overlap
In figure segregation, it is felt that subfigures over lap each other or just connect with each other(Figure
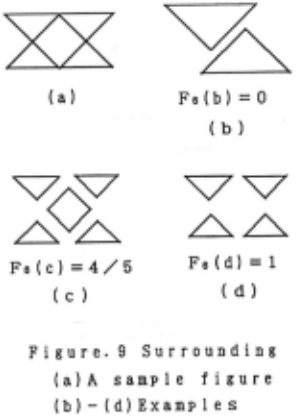
9). This may have something to do with the selec tion frequency. Let interpretation I has n subfigures Ct, C2, ... , C,.. then, the overlap of I is defined as
f 6(C,) = 0 : if C1 satisfies condition 1 or condition 2 but f 6 (C,) = 1 : otherwise
where
condition 1: C, does not share line elements in com mon with other subfigures and C1 overlaps other subfig ures.
condition 2: all the line elements of C, are inner lines (lines that are not the border lines between the original figure and the background), and all of them are shared with some other subfigures which do not include one an other.
The value of F6 is small when the original figure is in terpreted as several subfigures that overlap( Figure 9(b)). If the original figure is interpreted otherwise, then F6 becomes smaller if there exist subfigures that are sur rounded by other subfigures(Figure 9(c),(d)).
4.2 Similarity
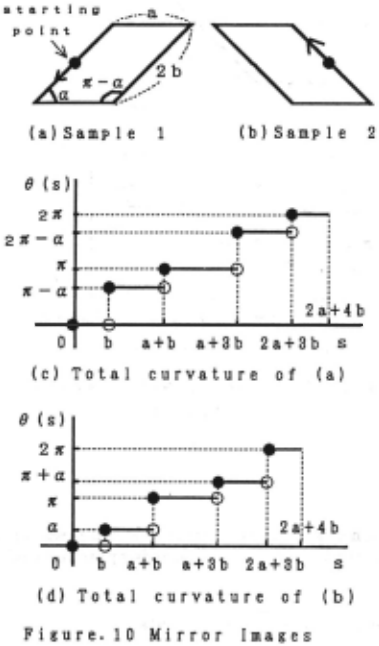
It seems that subfigures resembling each other may have something to do with figure segregation. Humans feel two figures look like each other when they are similar or when they are mirror images of each other.
Suppose 81(s) is the total curvature of subfigure C1, and 8; ( s) is that of C;, S, is total length of C,, and S; is that of C;. LetS,~ S;.
If subfigures C, and C; are similar, then there exists a start point which satisfies the following equation.
where
Thus, similarity of C, and C; can be defined as
where 8iz(s),8jz(s) is 8,(s),8j(s) when the starting point is x.
Mirror images are not similar, but humans think they look like each other. If C, and C; are mirror images of each other, then there exists a start point which satisfies the following equation(Figure 10).
Thus, similarity of C1 and C; concerning mirror image can be defined as
Thus, similarity of C, and C; can be defined as
If interpretation I has k subfigures, then similarity of I can be defined as the average of 1i3.
It can be said that the smaller F1 of an interpretation is, the more similar the subfigures are in it.
5 Significance of each Gestalt factor
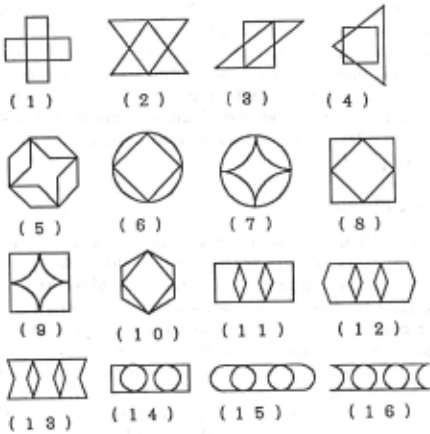
In order to check the significance of the seven Gestalt factors, a psychological exp.eriment was conducted. Six teen ambiguous figures were shown to twenty subjects. Figure 11 shows the sample figures. Each subject was asked to draw the most natural interpretation for each sample figure. Fifty-six kinds of different interpretations were obtained. Gestalt values of each interpretation can be calculated as shown in sections 3 and 4.
The significance of each Gestalt factor is calculated from the correlation coefficient between the Gestalt val ues ~nd the selection result as shown as Table 1. In Table 1, column G corresponds with the number of sub jects who drew each interpretation.
Statistics give the limit of significance 'YM, by the next equation.
where
n: number of samples £ : risk
| F1 | F2 | Fs | F" | Fs | F6 | F1 | G | |
|---|---|---|---|---|---|---|---|---|
| F1 | 1.00 | 0.50 | 0.28 | 0.16 | 0.21 | 0.71 | -0. 10 | -0.68H |
| F2 | 1. 00 | 0.05 | 0.03 | 0.67 | 0.62 | -0.03 | -0.4P¥ | |
| Fs | 1. 00 | 0.29 | -0.04 | 0.37 | -0.42 | -0.60H | ||
| F" | 1. 00 | 0.02 | 0.16 | -0.19 | -0. 29¥ | |||
| Fs | 1.00 | 0.27 | 0.09 | -0.14 | ||||
| F6 | 1. 00 | -0.26 | -0.66H | |||||
| F1 | 1. 00 | 0.40H | ||||||
| G | 1. 00 |
* ···significant with 5% risk
**···significant with 0. 5% risk
Table Correlation coefficient
tn_1 (£): t-distribution with n- 1 degrees of freedom and with the risk of £
Because the number of samples is 56, the limit of sig nificance 'YM is as follows.
The following results can be seen in Table 1.
(1) SimplicityF11 symmetryF3 , and overlapF6 are much more significant with 0.5% risk. Therefore, they are very important factors in figure segregation.
(2) Continuity F2 and similarity F1 are s~gnificant with 0.5% risk. Therefore, these two are also Important fac tors.
(3) RegularityF4 is significant with 5% risk.
( 4) Is is generally believed that humans prefer con vex figures rather than concave figures [Kanizsa, 1979]. However according to this psychological experiment, convexit;F5 is not significant. It can be said that in fig ure segregation, even if the convexity seems significant, there exist other more significant factors.
6 Figure segregation estimation
Linear multiple regression analysis was conducted using Gestalt values as predictor variables and the number of the people who selected the interpretation as the crite rion variable. By doing this, an equation which estimates the interpretation selection frequency is obtained as fol lows.
| Po | {J1 | {J2 | {J! | P. | Ps | {J6 | {J7 | |
|---|---|---|---|---|---|---|---|---|
| coefficient | 11.36 | -5.53 | -1.98 | -4.36 | -1.24 | 0.75 | -I. 09 | 2. 20 |
| t-value | ·~ | 3.70 | 1.09 | 3.62 | 0.88 | 0.47 | 0.64 | 1.87 |
lopotg
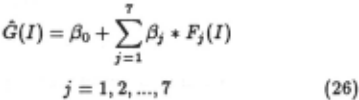
where G(I): the criterion variable of interpretation I.
f3o: a constant.
{3i: the partial regression coefficient.
Fi: Gestalt values of interpretation I.
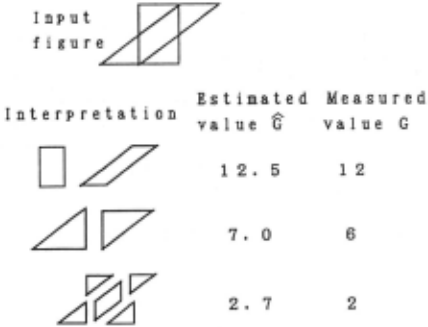
Table 2 shows the partial regression coefficients and their t-values. Figure 12 shows an example. G is the frequency selection value obtained by equation (26) and G is the number of people who actually selected the in terpretation.
Multiple correlation R between G and G is,
This indicates that equation (26) agrees fairly well with the experimental results. The characteristics of this model are as follows.
1) Ability of estimation
Figure segregation models have been reported, but they only indicate which interpretation is most likely to be selected. This model can completely estimate which interpretation is selected most and in addition to that, can estimate the selection frequency of each interpreta tion fairly well.
2) Robustness of the algorithm
The Gestalt factors shown in this paper are quite gen eral and independent of sample figures. Also, if a new Gestalt factor is found, it is very easy to put the fac tor into this model. This easy modification character is very important when constructing a model of psychologi cal effects because it is very difficult to make an initially complete model. This model is well constructed from this stand point.
7 Conclusion
It is very difficult to simulate human visual perception using computers. Figure segregation is one of the hard est problems to conquer. In order to achieve this, it is necessary to describe human visual characteristics in figure recognition. Therefore, we defined Gestalt factors such as symmetry and continuity with total curvature function. The significance of each factor was examined by a psychological experiment. Then, by applying linear multiple regression analysis, selection frequency of each interpretation was estimated. This model can simulate human visual perception in figure segregation very well. Also, it should be noted that the model proposed here and in [Shimaya and Yoroizawa, 1990a] is quite general and easy to apply to practical applications such as map recognition or technical parts recognition.
@inproceedings{ijcai1991p55,
  title     = {A Cognitive Model of Figure Segregation},
  author    = {Shimaya, Akira and Yoroizawa, Isamu},
  booktitle = {Proceedings of the Twelfth International Joint Conference on
               Artificial Intelligence, {IJCAI-91}},
  publisher = {International Joint Conferences on Artificial Intelligence},
  editor    = {John Mylopoulos and Ray Reiter},
  pages     = {366--371},
  year      = {1991},
  month     = {8},
  note      = {Cognitive Modeling},
  url       = {https://ijcai.org/proceedings/1991/55},
}
TY - CPAPER TI - A Cognitive Model of Figure Segregation AU - Shimaya, Akira AU - Yoroizawa, Isamu T2 - Proceedings of the Twelfth International Joint Conference on Artificial Intelligence, IJCAI-91 PB - International Joint Conferences on Artificial Intelligence PY - 1991 SP - 366 EP - 371 UR - https://ijcai.org/proceedings/1991/55 ER -Copied
Machine-readable versions of this paper, for tools and AI agents:





