
An Architecture for Visualizing the Execution of Parallel Logic Programs
Proceedings of the Twelfth International Joint Conference on Artificial Intelligence. Logic Programming. Pages 870-875.
© 1991 International Joint Conferences on Artificial Intelligence
Abstract
This paper describes the development of an architecture and implementation of a graphical tracing system for the parallel logic programming language PARLOG. Novel features of the architecture include a graphical execution model of PARLOG; a range of representational techniques that allow the user a choice of perspective and granularity of analysis; and ongoing work on graphical tools that provide user-defined visualisations of their programs, either before the program is run, or afterwards by demonstration from a textual trace. The aims of the architecture are threefold: (1) to aid program construction and debugging by providing an informative graphical trace of the program's execution; (2) to provide the user with a choice of representational techniques, at a preferred level of granularity; and (3) to allow users to define their own visualisations, that more truly map onto their conception of the problem, and which support the way they wish to view the execution information.
- References Brayshaw, M. Visual Models of PARLOG Execution. September 1990. TR-64, Human Cognition Research Laboratory, The Open University, Milton Keynes, England.
- Brayshaw, M. Visualizing Cyclic Behaviour in Prolog. TR-66, Human Cognition Research Laboratory, The Open University, Milton Keynes, England, Dec'90.
- Brayshaw, M. and Eisenstadt, M. Adding Data and Procedural Abstraction to the Transparent Prolog Machine.
- In R.A. Kowalski and K.A. Bowen (Ed.), Logic Programming Cambridge, MA: MIT Press, 1988.
- Brayshaw, M. and Eisenstadt, M. A Practical Graphical Prolog Tracer. International Journal of Man-Machine Studies., 1991
- Conlon, T. Programming in PARLOG. Wokingham, UK: Addison-Wesley, 1989.
- Conlon, T. and Gregory, S. Debugging Tools for Concurrent Logic Programming, TR-90-22, Computer Science Department, University of Bristol, October 1990.
- Domingue, J. and Eisenstadt, M. A New Metaphor for the Graphical Explanation of Forward Chainging Rule Execution, Proceedings of International Joint Conference on Artificial Intelligence (UCAI-89), Detroit, 1989. 876 Logic Programming Eisenstadt, M., Retrospective Zooming: a knowledge based tracing and debugging methodology for logic programming. Proceedings of the Ninth International Conference on Artificial Intelligence (IJCAI-85 ). Los Angeles: Morgan Kaufmann, 1985.
- Eisenstadt, M., and Brayshaw, M. Graphical debugging with the Transparent Prolog Machine (TPM). Proceedings of the Tenth International Joint Conference on Artificial Intelligence (IJCAI-87). Los Angeles: Morgan Kaufmann, 1987. IJCAI
- Eisenstadt, M., and Brayshaw, M. The Transparent Prolog Machine (TPM): an execution model and graphical debugger for logic programming. Journal of Logic Programming, 5(4),pp. 277-342, 1988.
- Gregory, S. Parallel Logic Programming in PARLOG: The language and its implementation. Wokingham, UK: Addison-Wesley, 1987.
- Myers, B.A. Taxonomies of visual programming and program visualisation. Journal of Visual Languages and Computing, 1(1), 1990.
- Pinto, H. Implementing Meta-Interpreters and Compilers for Parallel Logic Languages in Prolog, AIAI-PR-14, University of Edinburgh, 1987.
- Ringwood, G.A. PARLOG86 and the Dining Logicians. Communications of the ACM., 31(1), pp. 10-25., January 1988.
- Ringwood, G.A. Predicates and Pixels, New Generation Computing, 1, pp.59-80, 1989.
- Utter, P.S. and Pancake, C.M. Advances in Parallel Debuggers:New Appraoches to Visualisation. Cornell Theory Center, CTC89TR18 12189, Cornell University, MY, 1989.
References were extracted automatically from the PDF and may contain errors.
Full text extracted automatically from the PDF; figures, tables and equations may differ. The PDF is the version of record.
1. Introduction
One of the central tenets of our current research on visualisation is that different visualisation techniques are optimal for different tasks and purposes. Any representation necessarily makes some things explicit at the expense of others. In this work I aim to show how using different presentation styles, which show different aspects of the execution process, can produce a practical visual model of a P ARLOG virtual machine, and one that can benefit teaching, tracing, and also debugging.
and Conlon (1989). A good review of program visualisation techniques can be found in Myers (1990) and Utter and Pancake (1989). A visual programming style front-end for PARLOG has been proposed by Ringwood (1989). Conlon and Gregory (1990) present an impressive system for the textual tracing of P ARLOG, including the ability to closely monitor (incremental) I/0, processes, and communication channels.
This paper will first briefly introduce a basic model of the visual execution of P ARLOG (see Brayshaw, 1990a for a fuller treatment). This model will then be generalised to show how we can embed it within a series of visual stories of a program's execution. There is an inherent problem in many representation systems that in defining a representation some things are made explicit, others implicit, some things highlighted, some hidden. By providing different prespectives on the execution behaviour of the program we will attempt to demonstrate how a fuller and more informed view of the program can be gained from looking at the program as its different faces are revealed in the series of visualisations. Then I shall discuss how we can further utilise these representational techniques so that users can modify them and produce their own visualisations, before finally adding some conclusions. All the representations use the same execution model, however the information is presented from different perspectives, emphasising different aspects of execution.
2. A visual execution model of P ARLOG
In this current work on PARLOG I am interested in PARLOG provides an interesting test case for the use of letting users get their own perspective on the program, and program visualisation, not only to try and generalise our one that suites their needs best. This has resulted in the own earlier work on visualisating Prolog (Eisenstadt and development of a repertoire of representation techniques that Bray shaw, 1987, 1988; Brayshaw and Eisenstadt, 1988, give the user complimentary perspectives, using different 1991), but also to deal with the special dynamics of levels of detail and abstraction. In addition users are able to parallelism and associated problems like starvation and come up with their own perspectives using special deadlock (e.g. see Ringwood, 1988). The basic model is visualisation defining tools.
built around the concept of the node representing a process, Background material to the current discussion can be found and the shading of the nodes indicating the process state (as in the following. PARLOG is described in Gregory (1987) in fig. 1 below).
User Defined Predicate
Built-In Predicate Evaluating Proof Succeeds Proof Fails
0
IJ
D ·
0

This then is the core. To it we now must add a more detailed execution model. The one I use is adopted from Conlon (1989), because it provides a good conceptual model for novices and experts alike of the workings of P ARLOG. It considers process evaluation to proceed in four stages, namely testlcommitloutputlspawn, which are discussed in detail below.
Test The clauses of the goal are tested to see if they are candidates. Clauses are tested via OR-Parallel search. For each clause, two tests, of head and guard, are carried out by AND-Parallel search. Clauses can be thought of as racing to be the frrst clause to satisfy both head and guard tests.
Commit The process commits to the first clause to pass the test stage. All other input matching or guard evaluation, associated with other possible candidate clauses, ceases. The commit stage marks the end of the race between the guards.
Output Once a clause has been committed to, any output arguments can then be bound.
Spawn The process then reduces to the sub-goals in the chosen clause body. As a result, concurrent sub processes are spawned, one for each of the subgoals. The process succeeds if all the sub-processes succeed. If however one of the conjunctive sub-processes fails, then the overall process goal fails. If the spawned (reduced to) goal is a leaf node in the execution space, then the call succeeds immediately and the goal succeeds.
Figure 2 considers how this maps onto a simple database query.
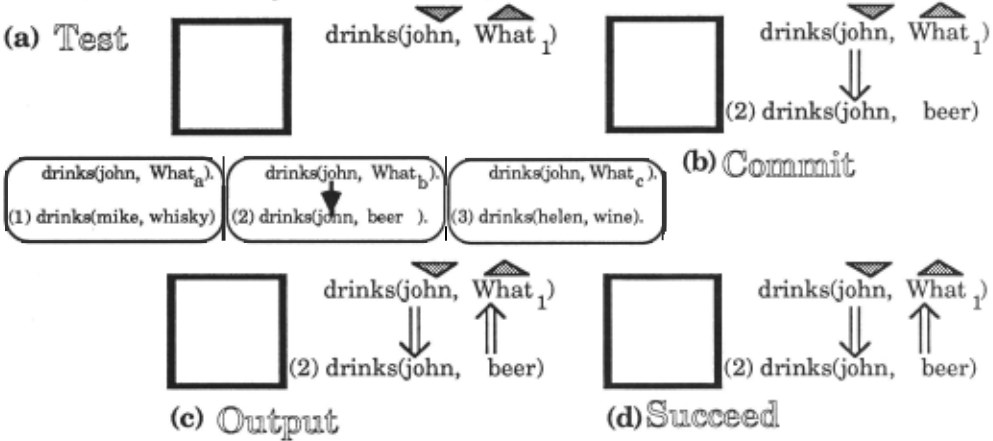
Let us now consider the actions of P ARLOG when doing this simple query. On attempting a goal, the process tests in parallel the head and the guard of all the clauses of the goal. In figure 2, we see that we are attempting to prove that drinks(jobn,What) is true against the database drinks(mike, whisky), drinks(john, beer), and drinks(belen, wine). At the top of the figuure we see the test phase of a goal evaluation (a). The icon on the left shows we are currently evaluating a goal. The goal itself is drawn to the right of it. The mode declarations (whether an argument is input or output) are shown by the shaded arrows above the goal. These correspond to the modes of the respective arguments. <eP indicates input, and is by number, however in the transient parallel evaluation spaces of the evaluation test phase, we show the temporary variable bindings subscripted by letter. Finally, arrows are used to show data-flow and pattern matching, in the same manner as Eisenstadt and Brayshaw (1988). Thus we can see that of the three possible clauses, only the second clause drinks(john,beer) matches the goal drinks(john, What1).
In the top part of figure 2, we can see that only clause two of drinks matches the database. As a result, clause two wins the test phase and is committed to. We write the name of the clause next to the node indicating the state of the process, and commit at that choice point. Any output variables can now be unified, as we see figure 2(c). Finally we spawn any new sub-processes in the body of the clause. As drinks is defined as a simple fact, the evaluation now succeeds as we see in the final snapshot, and hence we can see that the overall evaluation has succeeded with the result drinks(john, beer).
The view we have just given is a very fine-grained account of the executon process. We can however develop a much coarser grained model, suitable for monitoring much larger programs. We do this simply by omitting details of the
,e, .,.._1!11111 .... output. Thus we can see that drinks's first argument must be input, and its second output. When we match the heads in parallel we produce a local evaluation space for each clause, as shown in the three boxes below the main process state icon. We can thus see at a glance what the different possible binding enviroments are. The goal is shown at the top of the box, the attempted head match below. Database clauses are indexed by number on the left. Variables are shown renumbered by subscripts, to avoid name clashes. In the main body of the clause the renaming unification of the program and considering instead just the name of the process and its state, indicated by the icon on the left-hand-side. If I want to sec more information about the unification, the different possible binding environments in the test phase, or the data-flow arrow, I can use the same technique of zooming we introduced in (Eisenstadt and Brayshaw, 1987), to reveal more fine-grained information. Also notice that because the coarse grained representation is only a superset of the fine-grained view, I can arbitrarily interleave coarse and fine traces. I will demonstrate this notation further when we incorporate this account in different representational models.
3. Integrated multiple representations of PARLOG programs
So far we have only introduced a model of individual processes. We now need to say how these individual views can be related together to give a model of execution that considers a program made up of many of these nodes. All the views that are discussed are tightly integrated. The user can readily swap from one to the other. Coarse grained views can be opened out into fine-grained ones, and vice verca, by mouse-clicking on the nodes. All the views of the program also have a replay panel, so the trace history can be wound back to the beginning and browsed through, running it forward and back as the user sees fit. The basic modus operandi of the current system is that the user runs the program and then gets a visualisation of it after the run, the user being able to choose different representation style as appropriate. Other representations can be called up from a menu or the user can choose to build new representations (or usc an existing user-defined visualisation).
An AND/OR tree gives us our kernel prepresentation style. Amongst its strengths are its good mapping to the source code and compactness. Our basic representation is introduced below.
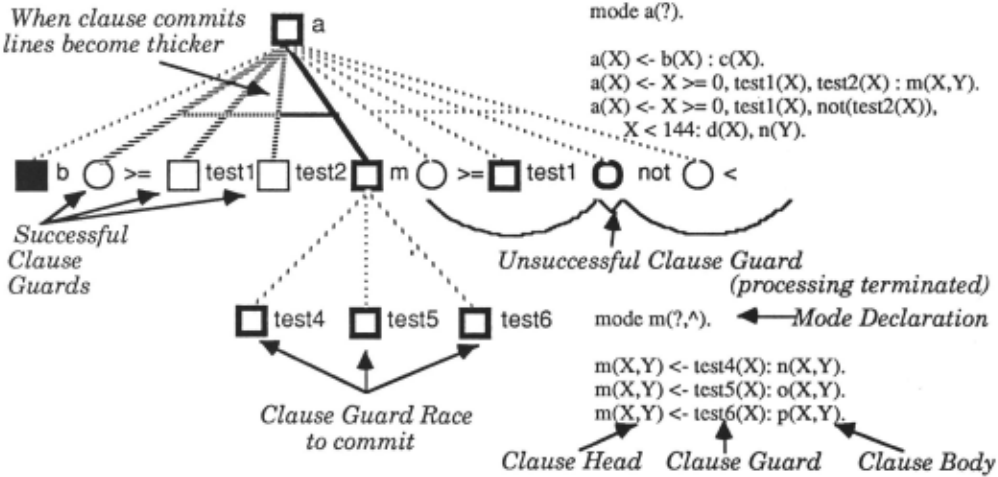
On the left we see the basic notation we use; ANDs are implies that these others have not been. Program dynamics distinguished from ORs by the conjunction bar linking arcs can be revealed by using the replay panel which can show in the tree. Alternative clauses can be viewed via ORs and what happens and when. When a clause commits processes conjoined sub-processes in a clause body as ANDs. Guards are shown in whatever state they were in when they were are distinguished by characteristic line stippling. Once the terminated, as this can be informative about how and why a processes commits to one particular choice, the successful particular process failed/successfully committed at a guards change to a broader hashed line style to distinguish particular point. Using dynamics, suspended goals can be them from the surrounding unsuccessful ones. These see as evaluating root nodes, their lack of activity showing unsuccessful nodes are left in whatever state they were in dynamically the suspension, and graphically we reinforce when the commitment took place. The fact that one of the this model by showing a line underneath to distinguish them clause guards is shown as being successful necessarily f r o m n o n - s u s p e n d e d n o d e s .
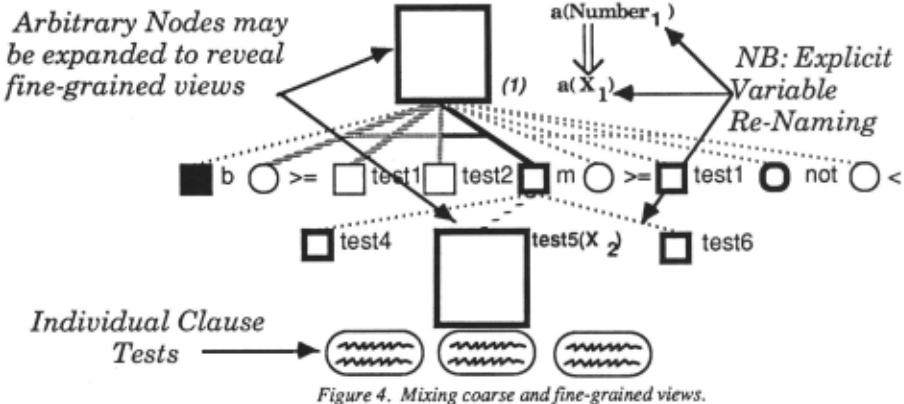
In figure 3 all the nodes that we dealt with were coarseenvironments for a are not shown by default, other than grained descriptions. As we noted earlier we can however when the process was in its test phase, but can be brought introduce fine grained information as well. To do this we up again and displayed as at the point of commitment, by can zoom in on selected nodes. In figure 4 above, we can mouse-clicking on the node. see the effect of doing this for the nodes a and testS. In Another description of P ARLOG can be in terms of many both cases we now have our fine-grained view of execution intercommunicating processes. According to such a model, again. Notice also, that at the moment that we have taken PARLOG can be thought of as a kind of object-oriented the snapshot in figure 4, testS is in the process of its test language. To support this view we have developed a process phase. We can see the individual clause evaluation communication model, illustrated in figure 5. environments below the bottom of the process node. The
2
integers sift print_primes
[2,3,41 Rest 30 1
Example of computing primes
using seive of Erastothenes
method.
Snapshot in mid-execution of the query
<- primes(lO). filter and sift are suspended
awaiting next integer value
Figure 5. A process communication model. We can see what data is being communicated and between whom, by looking at what information is on which channel. Notice, the re-occurring shapes caused by recursive filter and sift processes
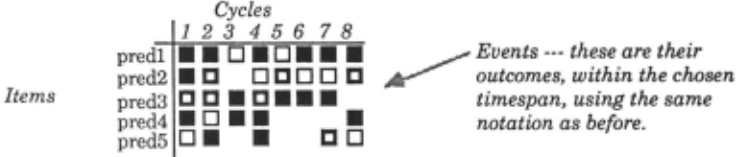
In this model we view each process as a node, and link the sections; the slices can come from arbitrary parts of the processes together according to the data-flow between them. program, hence arbitrary process communication can be On these links we show either the data-flow that has seen. It is important to remember, however, that the occurred in an incremental fashion, or just the new elements, relation between the two representations is essentially one of depending upon the user's preference. The nodes in the perspective; one representation emphasises control, making diagram are actually the same as those in the tree based data-flow implicit, the other pulls data-flow between views that we have been looking at previously. In the trees, processes out front, but hides the overall control relations each process was depicted by a node whose visual state between the processes. descriptor mapped onto that of the process. We can use the A final representation style we employ is based on the same notation in the data-flow diagrams. We can view these metaphor introduced in (Domingue and Eisenstadt, 1989). data-flow diagrams as horizontal cross sections of the trees. This metaphor aims to make repetetive or cycle-based However, the logical control shown in the trees is removed. behaviour explicit. In PARLOG, constructs like recursion The data-flow diagram need not be made up of simple crossallow us to conceptualise a program carrying out some form of repetetive process. Although we could detect this type of behaviour in the olhcr traces it would be implicit wilhin the trace representation we arc employing. The cycle table aims to make this explicit. The basic form is to consider a list of items to viewed on a per-cycle basis and place these items down one axis of the table. Down the other we consider the individual cycles. The cross section of these two axis then tells us what event happenned on what cycle to what item. In P ARLOG we have defined a default mapping between recursive processes and the cycle table. Likewise we can also look at guards on each invocation of a processes, so that each new guard becomes a new conceptual "cycle". Doing Lhis allows us to compare the behaviour of the guard on each sucessive invocation.
.
These representation styles form the basis of our library. the representation template chosen, and a user defmed Thus currently we can distinguish between three different visualisation produced. This is implemented as a sequential execution metaphors and two types of granularity. In the search of the trace history. However, as relative tempo~ next section we will discuss how to use these execution information is also preserved, simulated concurrency IS metaphors with new canonical units defined by the user. therefore J?Ossible. How thi.s p~oceeds depends on the Moreover the architecture is open to the extent Lhat we can representatiOn chosen, as we w1ll diScuss below. expand the system by embracing other metaphors of execution, whilst still maintaining our execution model and mappmgs may be produced by descnbmg the footpnnts of levels of granularity. The important notion has been the ability to see execution from different perspectives: goal reduction, process communication, and iteration.
4. User Defined Visualisations
One of the important proposed features of Lhis system is the provision for users to be able to define their own visualisations. This section will describe possible ways we are exploring to go about doing this. Taking any one of the representations as a template, users should be able to program a new mapping between Lheir program and the trace they have generated, Lhereby producing a new visualisation, of their own design. We have here tried to design additional tools that let the user write this mapping more easily, without getting involved in heavy code production to program the debugger. To this end we will discuss two tools. The first lets the user define visualisation by selecting nodes from the call graph of Lhe program before it is run. Thus the programmer can, a priori, decide what trace to see of his/her program, design Lhc trace, and then run the program. The second method works post execution. It allows the user to take a textual trace of the program and describe the mapping between representation template and textual trace in terms of it instances, as shown in Lhe trace. Thus the user can define his/her own visualisation based on a posthumous analysis of the trace. In addition however, Lhe most crucial concept that distinguishes these user defined mappings is that they need not be in terms of individual nodes in the underlying trace. Instead, groups of nodes can be considered as an individual cliche, and mapped as one into the representation template. Thus higher level descriptions of the program can be rendered in the visualisation by showing the mapping these higher level events have to the underlying symptomatic footprint they leave in the program trace. By thus analysing the program trace and detecting Lhe user defined footprints, Lhese events can then be mapped into In .trees and process communic~~on views ar.bitary individual nodes. Thus nodes in the tree need not be individual processes, but instead represent much larger cliches about the program. The way we propose to go about doing this is as follows. The template consists of an abstract model of the representation with a series of roles (e.g.nodes, links etc.) which the user has to instantiate with a series of generators. These are defined as clicht patterns to look for in the trace history, each such cliche is said to be defined by the characteristic footprint it leaves behind in the trace when it occurs. Each trace footprint has a script associated with it, that is defined using one of the two techniques we will discuss below. For each process, the tracer searches the trace history of the process and its spawned subprocesses. At specific points in the script, the script can allow for nested cliche patterns. Thus a script could say that between the call and exit of a particular process, go and look for cliches that occurred within this particular subtree. In this manner hierarchical abstractions can be produced.
For cycle tables the process is slightly different. Here, there are three critical things to define. The first is what event marks Lhe beginning of a new conceptual cycle. Then what are the items (termed agents) that we wish to consider on these cycles. Finally we have to define what are the events we wish to see. The algorithm then computes the following. It first looks for cycle events, starting from a particular root process, and searching downwards. Once it has found the intervals that make up the cycle, it then looks for each agent, to see which events cliches happenned to it in that particular cycle. If more than one event occurred the default is to show the last. Earlier ones can be picked up using the replay notion introduced earlier. Note that the dynamics of this display can be (though by no means need to be) very different from the parallel dynamics of the P ARLOG code underneath. In other words, this model can be used to map a different conceptual model of the machine, and indeed might be used to serialise out a particular piece of code, if that helped the user's conceptualisation of the problem.
In order to make the definitional process of these mappings more easy, we are constructing the following two tools.
4.1 Graphical techiniques for pre execution trace construction
This is a generalisation of a technique developed for Prolog in (Brayshaw, 1990b). The user is first asked to choose a representational style. For whatever style they choose, they have to fill in the role fillers in the template they wish to use. They can do this by identifying the footprint in terms of the program's call graph. The call graph plots out the potential execution space of a program. From it the user can then specify which nodes in the execution space they wish to group together, and in what calling structure, in order to specify the footprint of the cliche they are interested in. The footprint is produced by specifying a pattern of nodes from the call tree. The footprint they are defining is that pattern in the final execution trace that constitutes an instance of the concept they are defining. Each time they choose a node they are prompted to further conditionalisc their choice by adding a script to that node. The final script for the footprint is the conjunction of the scripts for the individual nodes. Variable naming is unique to the entire script and not just local to an individual node script, so constraints between local nodes can be so recongnised. The language for the scripts is Prolog, since this is the language in which the tracer is embedded. In order to write the script the user is given a menu based authoring tool.
The tool allows the user to say what the patterns in the trace for this footprint are. Legal patterns arc derived from the execution descriptors originally designed to describe Prolog execution (Eisenstadt, 1985), but here generalised to PARLOG. They include a call (with optional reference to a particular clause), call success or failure, and the options to be specific about the type of failure. To the left of this menu is the general script editing area. Users can type into this if they so wish, or edit what is there. Additional Pro log goals can further constrain the script. Additionally however the user can edit the script by means of a menu. Suppose we selected an example node called a in the call graph. The default script is that for this pattern to hold, a is simply called, and we can express this by the line call(a( , , )). However, we can make this pattern much more specific-:- We can see any calls to specific clauses of a (namely clauses 1,2, and 3), which resulted in failure due to sub-process failure. To do this and create the script, we have to choose the appropriate options from the menu, and then specify to a separate dialog what are the numbers of the clauses we wish to consider. Nodes can be added to a footprint by repeatedly selecting them from the call graph and defining scripts in this way. The calling structure specified from the call graph between the individual nodes is also made a precondition of the script. Once a cliche definition is complete a double click ends the definition process. Where appropriate the user can call upon an icon editor to define a special symbol for that cliche or choose to use the built in representational styles. This definitional processes can be repeated to define any number of cliches.
4.2 Defining visualisations from the textual trace of a progam
This second technique attempts to allow the user to work from a textual trace of the program. The textual trace has the same symptom descriptors as we saw in the previous section, again adopted from Eisenstadt(l985). Users can define a cliche, and associate it with the role filler of a template, by first choosing a representation style and a particular role. They can then define the cliche footprints by selecting instances of these footprints as they have manifested themselves in the runtime trace of the program. Several instances can be presented as examples of the footprint. Where the new is information is more specific, this is then added to the definition of the script defining the footprint. When generalisations are involved the tracer has a series of syntactic rules it follows (true automated generalisations not being possible without a model of the language semantics). So for example when two examples differ by an argument containing different literals, it is assume that the value doesn't matter and the values are replaced by a variable. Likewise the user can choose to automatically hollow out a term as short hand for making the example more generic. During the whole operation, the script that is being developed can be seen and edited, and augmented by additional constraints in Prolog. Once the scripts are defined, and depending upon the representation chosen, the new definitions are used to try and produce a new visualisation of the program. We see this process of visualisation production as potentially being an iterative one so that if the resulting views are not to the programmers' liking they can go back and edit the scripts to produce new ones. Scripts developed from the call graph descriptions can also be re-edited in this fashion, and in light of the actual program execution as seen in either the textually based traces, or the four graphical based views.
5. Scaling Issues and Other Approaches
Text tracing systems can be thought of as a type of program visualisation system. To convice yourself of this just consider the amount of layout, structuring and indenting that makes them readable. Like their graphical conterparts, to be successful they really have to present the required information in an acceptable manner. Thus any visualisation system, be it textual or graphical, has to think about scaleability, and when you consider scaleability, you have to consider the types of representations used. We have discussed ways of tackling the scaling issue for graphics elsewhere (Brayshaw and Eisenstadt, 1991). The point I want to make here is that there isn't some special dichotomy which dcstinguishes textual visualisations from graphical visualisations. Both are required to provide sufficient information, and selective information. Exhaustive program traces, in either mode, can be too unwieldy to use, if not useless, and take too long. For either system, what is required is an informative trace of a limited part of the program. I therefore believe that it is misleading to think that somehow text traces are "practical" while graphics ones not. They are different ways of exploring the information space, and what makes program visualisation exciting is finding what possibilities graphics affords for openning up new routes.
6. Conclusions.
In this paper I have argued for the use of different perspective techniques to visualise PARLOG. These have focused on an execution model, embedded within three metaphoric description of the system (goal reduction, process communication, and iteration), and portrayed either at fine, coarse, or user defined levels of detail. These techniques are currently being realised in an implementation that has been described in this paper. The system is written in Prolog using an extended and modified version of the P ARLOG meta-interpreter for a subset of the language developed in Pinto (1987).
The current development is particularly focussing on realising the type of flexibility of representation style discussed in section 4. In particular, one desirable future development would be to make the whole of the definitional process of these new footprints graphical, and minimise the amount of "programming" envolved.
7. Acknowledgement
This work is currently supported by MRC/SERC/ESRC UK Joint Research Council Grant #89/CS31, the support of which is gratefully acknowledged. The author would also like to thank Marc Eisenstadt for many discussions about visualisation and program debugging, and for detailed comments on an earlier draft of this paper.
8. References
Brayshaw, M. Visual Models of PARLOG Execution. September 1990. TR-64, Human Cognition Research Laboratory, The Open University, Milton Keynes, England.
Brayshaw, M. Visualizing Cyclic Behaviour in Prolog. TR-66, Human Cognition Research Laboratory, The Open University, Milton Keynes, England, Dec'90.
Brayshaw, M. and Eisenstadt, M. Adding Data and Procedural Abstraction to the Transparent Prolog Machine. In R.A. Kowalski and K.A. Bowen (Ed.), Logic Programming Cambridge, MA: MIT Press, 1988.
Brayshaw, M. and Eisenstadt, M. A Practical Graphical Prolog Tracer. International Journal of Man-Machine Studies., 1991
Conlon, T. Programming in PARLOG. Wokingham, UK: Addison-Wesley, 1989.
Conlon, T. and Gregory, S. Debugging Tools for Concurrent Logic Programming, TR-90-22, Computer Science Department, University of Bristol, October 1990.
Domingue, J. and Eisenstadt, M. A New Metaphor for the Graphical Explanation of Forward Chainging Rule Execution, Proceedings of International Joint Conference on Artificial Intelligence (UCAI-89), Detroit, 1989.
Eisenstadt, M., Retrospective Zooming: a knowledge based tracing and debugging methodology for logic programming. Proceedings of the Ninth International Conference on Artificial Intelligence (IJCAI-85 ). Los Angeles: Morgan Kaufmann, 1985.
Eisenstadt, M., and Brayshaw, M. Graphical debugging with the Transparent Prolog Machine (TPM). Proceedings of the Tenth International Joint Conference on Artificial Intelligence (IJCAI-87). Los Angeles: Morgan Kaufmann, 1987.
Eisenstadt, M., and Brayshaw, M. The Transparent Prolog Machine (TPM): an execution model and graphical debugger for logic programming. Journal of Logic Programming, 5(4),pp. 277-342, 1988.
Gregory, S. Parallel Logic Programming in PARLOG: The language and its implementation. Wokingham, UK: Addison-Wesley, 1987.
Myers, B.A. Taxonomies of visual programming and program visualisation. Journal of Visual Languages and Computing, 1(1), 1990.
Pinto, H. Implementing Meta-Interpreters and Compilers for Parallel Logic Languages in Prolog, AIAI-PR-14, University of Edinburgh, 1987.
Ringwood, G.A. PARLOG86 and the Dining Logicians. Communications of the ACM., 31(1), pp. 10-25., January 1988.
Ringwood, G.A. Predicates and Pixels, New Generation Computing, 1, pp.59-80, 1989.
Utter, P.S. and Pancake, C.M. Advances in Parallel Debuggers:New Appraoches to Visualisation. Cornell Theory Center, CTC89TR18 12189, Cornell University, MY, 1989.
@inproceedings{ijcai1991p128,
  title     = {An Architecture for Visualizing the Execution of Parallel Logic Programs},
  author    = {Brayshaw, Mike},
  booktitle = {Proceedings of the Twelfth International Joint Conference on
               Artificial Intelligence, {IJCAI-91}},
  publisher = {International Joint Conferences on Artificial Intelligence},
  editor    = {John Mylopoulos and Ray Reiter},
  pages     = {870--875},
  year      = {1991},
  month     = {8},
  note      = {Logic Programming},
  url       = {https://ijcai.org/proceedings/1991/128},
}
TY - CPAPER TI - An Architecture for Visualizing the Execution of Parallel Logic Programs AU - Brayshaw, Mike T2 - Proceedings of the Twelfth International Joint Conference on Artificial Intelligence, IJCAI-91 PB - International Joint Conferences on Artificial Intelligence PY - 1991 SP - 870 EP - 875 UR - https://ijcai.org/proceedings/1991/128 ER -Copied
Machine-readable versions of this paper, for tools and AI agents:





