
Analyzing Images Containing Multiple Sparse Patterns with Neural Networks
Proceedings of the Twelfth International Joint Conference on Artificial Intelligence. Learning Be Knowledge Acquisition. Pages 838-842.
© 1991 International Joint Conferences on Artificial Intelligence
Abstract
We have addressed the problem of analyzing images containing multiple sparse overlapped patterns. This problem arises naturally when analyzing the composition of organic macromolecules using data gathered from their NMR spectra . Using a neural network approach, we have obtained excellent results in using NMR data to analyze the presence of various amino acids in protein molecules. We have achieved high correct classification percentages (about 87%) for images containing as many as five substantially distorted overlapping patterns.
- Chen, C. "Statistical Pattern Recognition" . Spartan Books, 1973.
- Fu, K. S. and Mui, J . K. "A Survey on Image Seg- mentation" . Pattern Recognition, vol. 13, pp . 3-16, 1981.
- Fukushima, K. "Neural Network Model for Selective Attention in Visual Pattern Recognition and Asso- ciative Recall" . Applied Optics, vol. 26 , no. 23 , pp. 4985-4992, 1987.
- Gross, K-H ., Kalbitzer, H. R . "Distribution of Chemical Shifts in 1H Nuclear Magnetic Resonance Spectra of Proteins". Journal of Magnetic Reso- nance, vol. 76, pp 87-99, 1988.
- Jain, A. K. and Dubes, R . C. "Algorithms for Clus- tering Data". Prentice Hall , 1988.
- Kohonen , T . "Self-organized Formation of Topolog- ically Correct Feature Maps". Biological Cybernet- ics, vol. 43, pp . 59-69, 1982.
- Kohonen, T ., Barnes, G ., and Chrisley, R . "Sta- tistical Pattern Recognition with Neural Networks: Benchmarking Studies". Proc. IEEE Int. Conf. on Neural Networks, vol. 1, pp. 61-68, 1988.
- Nagao, M. and Matsuyama, T . "A Struct ural Analysis of Complex Aerial Photographs" . Plenum Press, 1980.
- Rumelhart, D. E., and McClelland , J . L. "Paral- lel Distributed Processing, Volume 1". MIT Press, 1987.
- Strong, G . W . and Whitehead, B. A. "A Solution to the Tag-Assignment Problem for Neural Networks". Behavioral and Brain Sciences, vol. 12, pp. 381-433, 1989.
- Wuthrich, K. "NMR of Proteins and Nucleic Acids" . John Wiley & Sons, New York , 1986.
References were extracted automatically from the PDF and may contain errors.
Full text extracted automatically from the PDF; figures, tables and equations may differ. The PDF is the version of record.
1 Introduction
Currently known image analysis methods are not very effective when applied to images containing large mul tiple overlapped sparse patterns. Such patterns consist of a small number of features dispersed widely in the image. The features are usually small in size: possi bly no larger than a single pixel. Such a classification problem is encountered when analyzing images obtained by certain types of Nuclear Magnetic Resonance (NMR) spectroscopy.
Neural networks offer potentially promising techniques for such problems, but few successful results have been reported in the literature on the application of neural networks to such complex image analysis tasks. One pos sible approach is to use Strong and Whitehead's physi ological model [10] which describes how humans can se quentially focus on each pattern contained in a complex image. Their model is a discrete-event simulation of ac tivities within human neurons. Due to the complexity of human neurons this model has only been tested with small input images.
The selective-attention neural network of Fukushima presents another approach for classifying overlapped pat terns [3] . The main problem in applying Fukushima's approach for large images is the huge size of the re quired network. As many as 41000 cells are needed for classifying patterns in a 19 x 19 image. Since practi cal applications require processing considerably larger (256 x 256) images, the computational requirements us ing Fukushima's model are too high.
We have developed a modular analyzer for the problem of analyzing images containing multiple sparse patterns. Each module detects the presence of patterns that be long to one class in the input image. Each module has two stages. The first stage is a feature detector based on clustering [5]. For each class of patterns, cluster analysis is used to identify those regions of the input image where features of the patterns belonging to that class are most likely to be found. The second stage of each module is a backpropagation-trained feed-forward neural network [9] that performs the tasks of thresholding and classifi cation. With this approach, we have been able to ob tain very high correct classification performance (87%) on 256 x 256 images with noisy test data.
In the next section, we discuss the problem of ana lyzing multiple sparse patterns, describe some details of the NMR analysis problem, and discuss previous work on this topic. In section 3, we describe details of our sys tem. Experiments and results are presented in section 4. Section 5 contains concluding remarks.
2 The problem
The images we analyze may contain many different 'pat terns'. Each pattern consists of several 'features'. A feature may be a group of neighboring pixels, or per haps just a single pixel. The locations of pixels may vary within a range determined by the feature. Hence the pattern-matching process has to allow for variability of pixel locations.
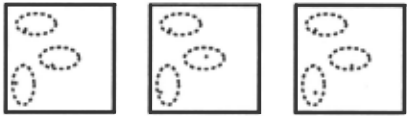
Figure 1 shows three images, each containing one pat tern (of the same class) which consists of three features. Each feature consists of a single pixel (indicated by a'+' symbol), which must occur somewhere within a known region (delineated by dashed ellipses in the figure).
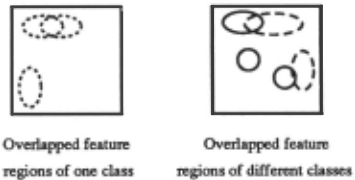
In the applications that we are interested in, feature regions for different classes do overlap, as shown in Fig ure 2. Consequently, a feature may lie within feature regions of several classes. Such a feature partially con strains the classification, although it does not permit us to decide unambiguously whether a particular class of patterns is present in the image. As noted by Rumelhart and McClelland [9), such problems are ideal candidates for neural network solutions.
A particular instance of this problem arises in the classification of NMR spectra. NMR spectroscopy is a powerful method for the determination of the three-dimensional structure of complex organic macro molecules such as proteins [11]. Proteins are long chains of smaller molecules called amino acids. Approximately 18 different types of amino acids are commonly found in proteins. The first step in analyzing the structure of a protein is to determine its constituent amino acids. One type of NMR spectroscopy used for this purpose is called Correlational Spectroscopy ('COSY').
The COSY spectrum of a protein is the result of the combination of the spectra of its constituent amino acids. The task of determining the constituent amino acids of a protein is therefore equivalent to the task of analyz ing an image containing multiple sparse patterns. The training set for our analyzer consists of a number of sam ple spectra for each type of amino acid. These spectra were generated from information about the distributions of peaks for each type of amino acid, tabulated in [4].
2.1 Definitions
Image representation: An input image is a two dimensional array of non-negative integers called 'in tensities'. We will represent an image by a set P = { P1, P2 , . .. , PN} of triples, where each triple P; = (P; ,:r: , P; , 11 , P; ,z) for 1 ~ i ~ N. The first two compo nents (P; ,:r:, P; , 11 ) of each triple identify the location of a non-zero element in the input image, while the third (P;, z) represents the intensity of that element. Chemists refer to each such triple as a peak.
An image P may contain several patterns (disjoint sub sets of P) . Each pattern is a collection of peaks associated with a certain amino acid class. The number of pat terns contained in an input image is not known a priori . Hence each image contains an unknown number of peaks (N) .
Pattern Description: In some cases, the same class may be identified by one of many different images. For instance, an amino acid c may give rise to tce,l ) or tce,2)·
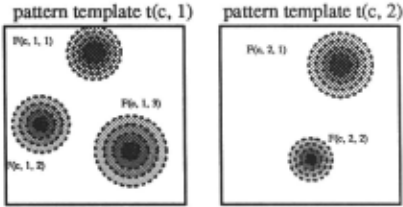
which are two different configurations. Therefore, we de fine a set Te of pattern-templates for each class c, where each pattern-template tce,i) characterizes one configura tion:
Each pattern-template is a set of f eature-templates:
A feature-template F(e ,j ,k) contains a complete specifi cation for a feature which could occur in a pattern be longing to class c. Feature-templates determine which features (peaks) are present in an input image:
where rce,j,k) is the center of a feature region and A(e,i, k ) is used to define how far the feature region extends around the center. As described in section 3, we obtain the values of r by cluster analysis and implicitly compute the values of .A when a neural network is trained.
2.2 Classification procedure
In this section, we describe our procedure for analyzing images with multiple patterns from C classes.
Matching a feature-template: This is the first step in pattern recognition. We must determine whether a peak in the input image matches a feature-template.
We say that a peak P; 'matches' a feature-template F(e, j ,k) if:
where g, the 'error function', is chosen to increase with distance lr- (P; ,:r: , P; , 11 )1 . Peaks with high intensity val ues (P; ,z ) match a feature template even when they are positioned far from the location of the feature template (r(e,j ,k)) · This is the reason for depicting feature tem plates with varying grey levels in Figure 3.
Matching a pattern-template: We say that an input image P 'matches' a pattern-template tce,j) if for each feature-template F (e, j ,k) E t ce,J)· there exists a unique peak P; E P, such that P; matches F (e ,j ,k )·
Classification: If an input image P matches a pattern template tce,j)· a pattern of class c is defined to be present in the input image. The overall analysis task is to determine all the classes whose features are present in the input image, hence the above procedure is repeated for every class.
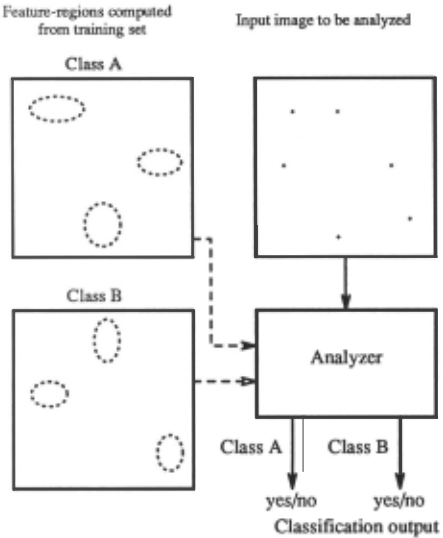
An overview of the classification process is depicted in Figure 4. In the example shown, the feature-regions for two classes are known to the analyzer. Using this knowl edge, the analyzer can determine whether a pattern of either class is present in the input image.
3 System description
In this section, we describe a modular analyzer for the analysis of images containing multiple sparse patterns. An important aspect of our system is the use of a clus tering algorithm to train feature detectors for each class. Our use of the term 'feature detection' to identify spa tial features in the patterns is to be distinguished from statistical parlance, where 'feature detection' may refer to the process of choosing the best set of variables to characterize a set of items [1].
3.1 Overview of the analyzer
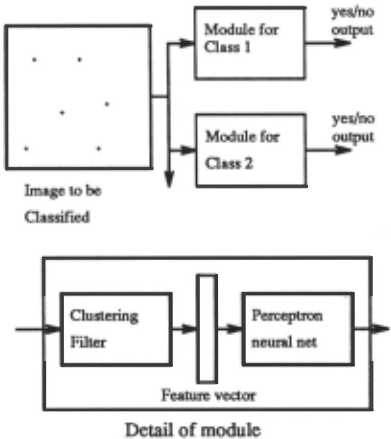
A block diagram of the analyzer is shown in Figure 5. Each module detects the presence of one class of pat terns. The modules work in parallel on an input image (presented as a list of peaks) .
Each module consists of two stages. The first stage, called a clustering filter, transforms the image into a 'fea ture vector'. The second stage is a perceptron-like feed forward neural network. The clustering filter computes the values of the matching functions, while thresholding is done by the neural network.
3.2 Clustering
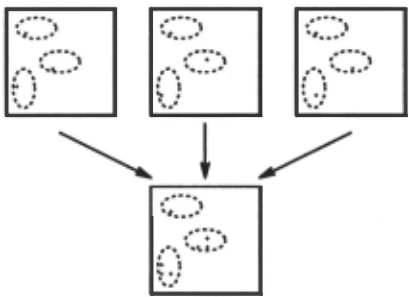
In machine vision systems, clustering is often used for image segmentation [8]. In our system, clustering is used to find the expected locations of features. We illustrate this with an example. Let the training set for some class c consist of the three images in Figure 1. Each image contains one pattern, which is known to belong to class c. These images have been superimposed in Figure 6. Clearly, the features occur in three clusters. The center of each cluster is the expected location of a feature.
The procedure may be summarized thus: for each class c, create a set Rc containing the locations of all features in an image created by superimposing all the training set images for class c. By applying a clustering algorithm to Rc, we determine the expected location of each feature, i.e., the cluster center.
We have investigated two clustering algorithms: the K-means clustering al~orithm [5] and the LVQ (Learn ing Vector Quantizer) l6]. We have found that the LVQ performs better for our problem. A benchmarking study by Kohonen et al. [7] also found that the LVQ produced better results than K-means clustering on several classi fication tasks.
3.3 The clustering filter
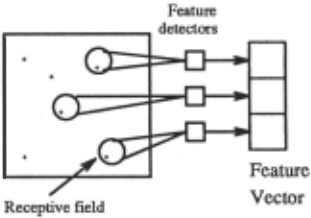
The role of each clustering filter (shown in Figure 7) is to extract relevant information from the input image for one class of patterns. A clustering filter consists of a number of feature detectors. A feature detector is a processing unit activated by the presence of a feature (peak) in its receptive field, a specific region of the in put image. The output of a feature detector is a real value which depends on the number of peaks present within its receptive field, the intensities of those peaks and their distances from the center of the receptive field. The output of a clustering filter is the 'feature vector', each element of which is the (real-valued) output from one feature detector in the filter .
In a filter for class c, the receptive fields of the fea ture detectors should coincide with the feature regions of class c. For simplicity, we use feature detectors with fixed size receptive fields in our system. Consequently, if a feature region is larger than the receptive field, sev eral feature detectors are required to cover it. We use the LVQ learning procedure to determine the position of each feature detector.
The output from a feature detector located at co ordinate r, when presented with an image P {P1, P2 , ... , PN} is:
The kernel function chosen is g(x) = expr"'' where r is a constant between 0.1 and 0.5. Although all peaks in the image are fed to the feature detector, it will actually respond only to those peaks which are very close to r. This is because for the values of T that we have chosen, the reciprocal of the kernel function g(x) drops to almost zero when x > 6. Therefore the feature detector only responds to peaks which lie within a radius of 6 pixels around its center, r.
As we noted previously, there are cases where two peaks sometimes occur very close together. We do not need to make any special provision for this situation. We use only one set of feature detectors to cover the combined feature region. The output from these feature detectors will be higher, but this is easily handled by the neural network.
3.4 The neural network
Although a clustering filter is trained to respond most strongly to patterns of a particular class, it is possi ble (due to overlap of feature-regions) that some of the detectors of one class may be activated when patterns of another class are presented. We use a feed-forward neural network to determine implicitly the appropriate thresholds for each pattern detector. This neural net work is trained after the clustering filters of the first stage have been trained and set up.
For each class c, the neural network (of the corre sponding module) must be taught to discriminate be tween feature vectors obtained from images containing a pattern of class c and feature vectors produced from images which do not contain patterns of class c.
We use backpropagation [9] to train the network. Backpropagation is a supervised learning algorithm in which a set of patterns to be learnt are repeatedly pre sented to the network together with their target output patterns. At the outset of a training session, the weights and biases are randomly initialized. For each pattern presented, the error backpropagation rule defines a cor rection to the weights and thresholds to minimize the square sum of the differences between the target and the actual outputs. The learning process is repeated until the average difference between the target and the actual output falls below an operator-specified level.
4 Results
In this section, we describe our experiments in training and testing the sparse image recognition system, and report the results obtained.
4.1 System parameters
To substantiate our approach, seven modules were trained for the NMR protein analysis problem. Each module can detect patterns corresponding to one amino acid. The final output from each module is a yes/no an swer about whether the respective class (amino acid) is judged to be present.
From among 18 possible amino acids, we trained mod ules for seven amino acids whose spectra appeared to be the most complex, with more peaks than the others. But in training as well as testing the modules , we used data which included peaks from the other 11 amino acids as well, and obtained good results in analyzing the pres ence of the seven amino acids for which modules were trained. This shows that an incremental approach is possible: upon building modules for the other 11 amino acids, we expect that our results will continue to hold.
Table 1a lists the parameters of each module. The names of the amino acids along with their one-letter codes are listed in the first column. The second column is the number of feature detectors in the first stage of each module. The third column shows the number of hidden layer nodes in the neural network which comprises the second stage of each module. These were approximately the smallest number of nodes required for convergence of the network training procedure, obtained by experi menting with various values.
| Module | Number of detectors | Hidden layer size |
|---|---|---|
| Alanine (a) | 4 | 10 |
| Cystine (c) | 10 | 20 |
| Aspartic acid ( d | 19 | 20 |
| Glutamic acid ( e | 14 | 10 |
| Phenylalanine (f | 26 | 10 |
| Isoleucine (i) | 19 | 20 |
| Valine (v) | 15 | 20 |
The training set consists of a total of 90 single-class images, with 5 for each of the 18 amino acids. The equa tion indicating how weights are changed using the error back-propagation procedure [9] is:
In each module, we used a value of 1J = 0.1 for the learn ing rate parameter, and a value of a= 0.05 for the mo mentum coefficient. The target mean squared error (to terminate the network training procedure) was set to be 0.01. During training, the target output for the networks was set to be 0.1 when the required answer was 'no' and 0.9 when the required answer was 'yes'. Weights in the network were updated only at the end of each 'epoch' (one sequence of presentations of all training inputs). Table 1 b shows the number of epochs needed to train the LVQ's and the feedforward (backpropagation) neu ral networks, for each module.
| Module | LVQ | Backpropagation |
|---|---|---|
| a | 10000 | 717 |
| c | 10000 | 2653 |
| d | 20000 | 452 |
| e | 20000 | 149 |
| f | 30000 | 3128 |
| i | 20000 | 503 |
| v | 20000 | 328 |
To investigate the effect of varying the receptive field sizes of detectors, we trained two versions of each mod ule with different values for r, the constant in the kernel function. When T = 0.5, detectors have small recep tive fields, whereas when T = 0.1, detectors have large receptive fields.
4.2 Experimental results
The goal of the experiments was to measure the cor rectness of overall classification when the system was presented with composite images containing several pat terns of different classes. Various experiments were per formed to test our sparse image analysis system on com posite images consisting of:
(i) different numbers of patterns;
(ii) with and without perturbations; and
(iii) for detectors with different receptive fields (r = 0.5 and T = 0.1).
To illustrate the testing method, consider a composite image created by superimposing two images with pat terns that belong to classes c and d. Correct classifica tion implies that this image should be classified 'NO' by modules a, e, i, f and v and 'YES' by modules c and d. We measure the percentages of correct classification, testing the modules in this manner on various composite images.
In the first set of experiments, we generated 1000 ex amples of each case: composite images containing 2, 3, 4 and 5 patterns respectively. In each set, the compos ite images were created by superimposing a randomly chosen set of images (each of a different class) drawn from the training set. The percentages of these images correctly classified by each module under different con ditions are reported in table 2, for T = 0.5 and T = 0.1.
From table 2, it is clear that error rates increase with the number of images (patterns) in the input image. This is because the receptive fields of different classes of pat terns overlap. Hence patterns of one class may partially activate feature detectors for other classes. As the num ber of patterns in the input image increases, it becomes increasingly likely that a feature detector may respond to artifacts arising from a fortuitous combination of pat terns belonging to other classes. This problem is further aggravated by increasing the size of the receptive fields , as shown in table 2.
| Module | r 0.5 | r 0.1 | ||||||
|---|---|---|---|---|---|---|---|---|
| -wo. ()f P&llerns 1n 1mue | 3 | ~ | 5 | f<o. 2 | of p&llerns 3 | m ~ | 1mage 5 | |
| & | 2 100 | 100 | 100 | 100 | 99.1 | 99.3 | 98.9 | 97.7 |
| c | 100 | 99.8 | 99.9 | 99.7 | 100 | 100 | 100 | 100 |
| d | 100 | 100 | 99.8 | 99.5 | 100 | 99.9 | 99.1 | 98.5 |
| e | 100 | 100 | 100 | 100 | 96. ~ | 9~.~ | 90.3 | 86.3 |
| 99.9 | 99.5 | 99.3 | 98.5 | 99.3 | 95.1 | 91.0 | 86 . ~ | |
| I | 98.0 | 96 . ~ | 96.~ | 95.7 | 99.9 | 99.6 | 99.6 | 99.3 |
| v | 100 | 100 | 100 | 99.6 | 99 . ~ | 99.2 | 98.7 | 94 .4 |
| Module | r 0.5 p&llerns m lm&Te | r 0 .1 Yo. patterns m tma.ge | ||||||
|---|---|---|---|---|---|---|---|---|
| Wo . of 2 | 3 | 4 | 5 | 2 | 3 | 4 | 5 | |
| a | 98.0 | 97.8 | 97.8 | 95.8 | 99.7 | 99.6 | 98.6 | 96.6 |
| c | 97.1 | 95.0 | 95.0 | 9~.0 | 99.7 | 99.3 | 99.0 | 99.2 |
| d | 98.6 | 97.1 | 95.5 | 9~.8 | 100 | 99.6 | 99.4 | 98.2 |
| e | 99 . ~ | 99.2 | 98.6 | 98.3 | 97.0 | 95.0 | 88.6 | 87.7 |
| f | 96.1 | 93.2 | 93.6 | 90 .1 | 98.9 | 97.0 | 89.8 | 84.6 |
| I | 96 . ~ | 9~ . 6 | 93.7 | 92.6 | 99.7 | 99.6 | 99. 7 | 99.1 |
| v | 98.3 | 97.0 | 96.4 | 95.1 | 99.8 | 99.4 | 96.7 | 95.5 |
| Module | r 0 .5 | r 0 .1 | in | image | ||||||
|---|---|---|---|---|---|---|---|---|---|---|
| No. of pa.Uerna tn | ima.Ie No. of patterns | |||||||||
| 2 | 3 | 4 | 5 | 2 | 3 | 4 | 5 | |||
| & | 92.0 | 85.8 | 82.5 | 80.7 | 94.6 | 90.9 | 86.8 | 86.1 | ||
| c | 9~ . 0 | 91.0 | 89.0 | 83.7 | 95.3 | 94 .0 | 92.7 | 89.7 | ||
| d | 89.2 | 85.7 | 79.0 | 76 . ~ | 95.2 | 94.6 | 92 .0 | 89.8 | ||
| e | 89.4 | 83.8 | 79.0 | 76.2 | 96.6 | 95.2 | 91.5 | 86.8 | ||
| f | 87.~ | 82.2 | 75.8 | 70.6 | 9~ . ~ | 89.8 | 84.8 | 76.8 | ||
| i | 89.8 | 82.8 | 77.5 | 74.4 | 95.5 | 93.6 | 93.2 | 89.7 | ||
| v | 90.0 | 85.8 | 80.8 | 75.5 | 9~.1 | 91.3 | 87.7 | 88.6 | ||
It is desirable to perform correct classification even in the presence of small errors or corrupted data. Hence, we tested our system with composite images produced by superimposing distorted versions of the training set images to the system.
Two series of experiments were performed, varying the amount of distortion in the test data, for small and large receptive fields (r = 0.5 and T = 0.1). In one set of ex periments, distortions were introduced by adding a ran dom integer in the range [-1, +1] to the coordinates of the peaks. The results of these are summarized in table 3. In another set of experiments, the distortion was in creased by adding random integers in the range [-3, +3] to the coordinates of peaks. These results are summa rized in table 4.
With the small receptive field system (r = 0.5), the combined effect of distortion and multiple patterns causes classification accuracy to deteriorate substan tially. On the other hand, classification capabilities of the large receptive field system (r = 0.1) are less af fected and degrade more gracefully with noise. This phe nomenon may be contrasted with the observation that the small receptive field system performs marginally bet ter on uncorrupted test data.
5 Concluding Remarks
In this paper, we have addressed the problem of analyz ing images containing multiple sparse overlapped pat terns. This problem arises naturally when analyzing the composition of organic macromolecules using data gath ered from their NMR spectra. Using a neural network approach, we have obtained excellent results in analyzing the presence of various amino acids in protein molecules. We have achieved high correct classification percentages (about 87%) for images containing as many as five sub stantially distorted overlapping patterns.
The architecture of our system is modular: each mod ule analyzes the input image and delivers a yes/no out put regarding the presence of one class of patterns in the image. Each module contains two stages: a clustering filter , and a feedforward neural network. An unconven tional aspect of our approach is the use of clustering to detect spatial features of patterns.
We performed a number of experiments to measure the correctness of overall classification when the system was presented with composite images containing several patterns of different classes. We tried two versions of the system, one with small receptive field detectors and the other with large receptive field detectors. In both cases, we observed that the rate of correct classification decreased as the number of patterns in the image was increased. ·To determine the ability of the system to cope with variations in the patterns, images with ran dom perturbations to the patterns were presented to the system in another series of experiments. In this case, we observed that the classification abilities of the large receptive field system are less affected and degrade more gracefully.
The classification process described in this paper is only the first step in the analysis of NMR spectra. It is of considerable interest to chemists to determine the precise association of the peaks in in the input image with different patterns. We are currently working on an extension to the system described in this paper to per form this task. We plan to refine the clustering algorithm to enable the use of feature-detectors with variable size receptive fields . We expect to improve performance by combining the evidence from multiple input sources, as is done in other NMR analysis methods.
Acknowledgments
We gratefully acknowledge the assistance received from Sandor Szalma and Istvan Pelczer of the NMR Data Processing Laboratory, Chemistry Department , Syra cuse University. The images for the training set were generated by a program written by Sandor Szalma.
@inproceedings{ijcai1991p123,
  title     = {Analyzing Images Containing Multiple Sparse Patterns with Neural Networks},
  author    = {Anand, Rangachari and Mehrotra, Kishan and Mohan, Chilukuri K. and Ranka, Sanjay},
  booktitle = {Proceedings of the Twelfth International Joint Conference on
               Artificial Intelligence, {IJCAI-91}},
  publisher = {International Joint Conferences on Artificial Intelligence},
  editor    = {John Mylopoulos and Ray Reiter},
  pages     = {838--842},
  year      = {1991},
  month     = {8},
  note      = {Learning Be Knowledge Acquisition},
  url       = {https://ijcai.org/proceedings/1991/123},
}
TY - CPAPER TI - Analyzing Images Containing Multiple Sparse Patterns with Neural Networks AU - Anand, Rangachari AU - Mehrotra, Kishan AU - Mohan, Chilukuri K. AU - Ranka, Sanjay T2 - Proceedings of the Twelfth International Joint Conference on Artificial Intelligence, IJCAI-91 PB - International Joint Conferences on Artificial Intelligence PY - 1991 SP - 838 EP - 842 UR - https://ijcai.org/proceedings/1991/123 ER -Copied
Machine-readable versions of this paper, for tools and AI agents:





