
The DIPMETER ADVISOR: Interpretation of Geologic Signals
Proceedings of the Seventh International Joint Conference on Artificial Intelligence. Expert Systems. Pages 846-848.
© 1981 International Joint Conferences on Artificial Intelligence
Abstract
The DIPMETER ADVISOR program is an application of AI and Expert System techniques to the problem of inferring subsurface geologic structure. It synthesizes techniques developed in_two previous lines of work, rule-based systems and s1gnal understanding programs. This report on the prototype system has lour main concerns. First, we describe the task and characterize the various bodies of knowledge required . Second, we describe the design of the system we have built and the level of performance it has currently reached . Third, we use this task as a case study and examine it In the light of other, related efforts, showing how particular characteristics of this problem have dictated a number of design decisions. We consider the character of the interpretation hypotheses generated and the sources of the expertise involved. Finally, we discuss future directions of this early effort. We describe the problem of "shallow knowledge" in expert systems and explain why this task appears to provide an attractive selling lor exploring the use of deeper models.
- Ancel C., et al., Well Evaluation Conference: Nigeria , Services Techniques Schlumberger, Paris, France, 1974.
- Buchanan B G, Feigenbaum E A, DENDRAL and Meta•DENDRAL, Art. Intel., 11 :5•24, 1978.
- Davis R, Buchanan B G, Shortliffe E H, Production rules as a representation, Art. Intel., 8:15•45, 1977.
- Duda R, et al. Development of a computer-based consultant for mineral exploration , SRI Report, Oct1977.
- Lesser V R, et al., Organization of the HEARSAY-II speech understanding system, IEEE Ttans ASSP, 23 :11•23, Jan 75.
- Reddy R. et al., The HEARSAY speech understanding system, Proc 3rd IJCAI, 185•193.
- Shortliffe E A, Computer-Based Medical Consultations: Mycin , 1976. WELL LOG IIELL LOG 4d 4d Figure 4 : Schematic of a Growth Fault .
References were extracted automatically from the PDF and may contain errors.
Full text extracted automatically from the PDF; figures, tables and equations may differ. The PDF is the version of record.
1. INTRODUCTION
Unlike fanciful movie images, oil is rarely discovered in gushers that send it spewing out of the ground. More typically, the discovery and draining of fields is a painstaking process involving inferred reconstruction of underground geology. The presence of prehistoric beaches, deltas, and faults several thousand feet underground are important information suggesting the likely location of oil -bearing formations.
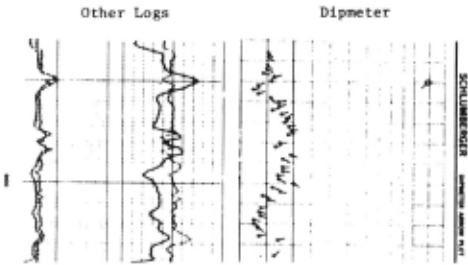
The reconstruction process is based in large part on measurements provided by a number of probes. The probes are lowered into a well and then slowly retrieved, measuring various physical properties of the rock every lew inches as they ascend. Since a log may be as much as 10,000' long, there is a significant amount of data to be interpreted.
2. THE SYSTEM
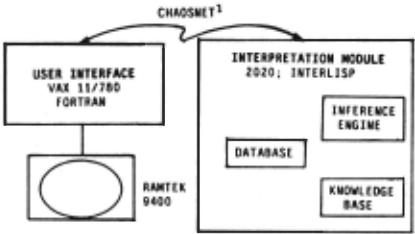
Figure 3 indicates the hardware configuration used to implement the system as well as the overall division of function.
2.1 User Interface
Interaction with the system is via the Ramtek, a high resolulion color display, primarily by using the mouse to point at various areas on the screen and to "push buttons" displayed there. A joyslick and keyboard are also available. The system includes facilities for data input and display, program control, and examination and modification of results produced by the interpretation system. Log data are accessible via either slow speed scrolling (for visual scan) or random access (for quick access to a particular segment of the log).
Considerable attention was paid to human engineering issues in designi'lg the interface. This, combined with sophisticated graphics facilities, results in a system that provides a range of powerful display features, yet is relatively easy to use.
2 .2 Log Interpretation Module
The overall organization of the log Interpretation module is shown in the right half of Figure 3. The knowledge base currently contains a few dozen rules that infer the existence of geologic structures from the presence of various features in a log. A sample rule is shown below.
If
there is redpattern 2 overafault, the direction of the red pattern is perpendicular to the fault, and
the 1 eng th of the red pattern is greater than 200 feet,
Then the fault is a growth fault.
The rules are written in a simple language referring to both features of the tog (e.g., red patterns) and geologic entities (e.g., faults). The premise part of the rule consists of one or more clauses, each of which is composed of a predicate on one or more patterns. The first clause of the rule above, for instance, Ia represented internally in a form approximated by
(ABOVE <red pattern> <fault interval>) where the items in <>'s are pattern specifiers matched against the data base (described below). The rules are currently quite simple in syntax and do not as yet make use of inexact inferences.
In addition to the rules, the knowledge base also contains a few simple feature detectors. These are procedures used to scan the log data and provide the initial level of data reduction.
1. The Chaoanet ia a high·speed broadcast packet network developed at MIT In 1976 and modeled alter Xerox's Ethernet.
2 . Characteristic pallerns on the toga are traditionally referred to by color names .. A "red. pallern" ia a sequence of tadpoles with smoothly lncreaamg dop magnotudo and relatively constant direction. A "blue pattern" Ia a similar sequence with smoothly decreasing magnitude.
The data base is the sys~em's repository for everything it currently knows about the well. It is structured in levels of successively more abstract information, ranging from the Initial log data at the bottom level, to hypotheses about large scale geological structures at the top level.
Conclusions are represented as patterns describing segments of the log. The inferred presence of a fault zone, for instance, is represented as
(FAULT 1376213790GROWTH63243163)
which indicates the top (13762'), bottom (13790'), orientation (along a line running from 63 to 243 degrees, roughly ENE to WSW), and direction of the downthrown block (153, SSE).
The inference engine provides the overall control in the system. It invokes subsets of rules in data·directed fashion, matching them against patterns in the data base and adding new conclusions wherever a rule matches successfully.
We view the overall process of log interpretation as one of data aggregation and abstraction, carried out in several passes over the log, each producing a successively more abstract description. As this view suggests, our work has benefited from the experience gained in previous rule·based and signal interpretalion systems, notably the Hearsay·ll [5] and Mycin [7,3) systems.
The DIPMETER ADVISOR program was developed using logs from the US gulf coast area and has begun to display a level of competence for that region comparable to that of a newly trained human interpreter.
3. INTERPRETING A LOG
In our current view, log analysis involves five major sources of expertise, applied in sequence: (i) validity check and initial data reduclion, (ii) determination of structural dip, (iii) analysis of faults, (iv) analysis of local geologic features, (v) assembly of a composite picture. The knowledge base is subdivided correspondingly and each subset of rules invoked in turn in the data·directed fashion noted earlier. A description of each phase is given below, simplified for brevity.
3.1 Initial Data Reduction and Validity Check
We begin by applying the feature detector operators, to produce the first level of data reduclion and abstraction. The first subset of rules is then invoked, examining the log for signs that the data are bad, and checking for several typical causes of error (e.g., mechanical malfunction of the dipmeter, operator error, etc.).
3.2 Structural Dip
Inclination of rock layers results from two different processes. Small scale processes (river flow, tidal action at shorelines, etc.) produce characteristically varying patterns that typically extend over 10 to 100 feet, while large scale processes (uplift or subsidence of a whole region) contribute additional, relatively constant dip, that extends 500 to 1 000 or more feet. The large scale phenomenon is referred to as structural dip. It is important for two reasons. First, it provides an indication of the overall orientation of the rock layers. This in turn indicates the likely dir~ction of flow of any deposits (hydrocarbons, being lighter than water, will "float uphill" through porous rock). Second, the structural dip is a "background" signal that must be removed before the small scale patterns can be detected and interpreted accurately.
3.3 Analysis of Faults and Missing Sections 3
When two regions slide past one another, porous rock layers may end up abutting non·porous layers, producing a trap where hydrocarbons collect. The detection and analysis of faults is thus an important part of the interpretalion process. The subset of rules dealing with fault analysis is invoked in this third stage, looking for discontinuities in structural dip and other signals of faulting action.
3. A miaalng section Ia a discontinuity in the pattern of rock leyera. Faults are one common cause of a missing section.
3.4 Stratigraphy
Features produced by small scale processes are termed stratigraphic. Once underlying structural dip has been subtracted, the characteristic "fingerprints" produced by these processes become clearer. A typical fingerprint is a collection of patterns found in a particular order and orientation on the log (e.g., a red pattern above a blue). Since we do not yet have a definition of the patterns precise enough to automate their detection, they are marked manually by the user, employing the graphics display and annotation facility.·
One subset of rules invoked at this stage analyzes the environment at the time of rock layer deposition (e.g., how deep the water was). A second subset then checks the patterns marked by the user, looking for known configurations, and uses this along with the environment information to infer the presence of stratigraphic features. Some of these features are indicators of hydrocarbon-bearing rock.
3.5 Composite Picture
Since geologic formations often extend over considerable horizontal distances, the same features may show up in other wells drilled in the same area. Thus, when data from multiple wells are available, it is sometimes possible to produce a composite picture that extends over several acres. We do not currently attempt to develop composite pictures.
4. NATUREOFTHETASK
As the discussion above suggests, log interpretation confronts issues similar to those encountered in previous efforts at signal interpretation. We have benefited from the experience gained in those efforts in designing and constructing the prototype system described here. But even our limited experience to date has demonstrated differences between this task and those attempted previously, differences that are interesting both for the perspective they supply on the possible variety in signal interpretation tasks, and for the directions they suggest for continued development of our system.
4.1 Character of the Task
Since our current program works with only some 50 or so distinct geologic entities, it is reasonable to ask whether the solution space is not in fact small enough to admit an exhaustive search.
An analogy to speech will help illustrate the difficulties that rule out such an approach. Imagine attempting speech recognition under the following conditions. There are multiple speakers who somtimes overlap (multiple geologic forces can be at work simultaneously). The speech is intermittent, in a noisy background (interesting geologic features are sparsely scattered on the logs; data are subject to the problems of making measurements on an uneven rock wall in a borehole filled with high pressure mud). There is a small vocabulary, but speech rate and pronunciation differ (there are relatively few distinct geologic entities, but they appear in different sizes and manifestations). Each speaker is generating words that are relatively unconnected (the presence of one geologic feature says relatively little about those around it).
Under these circumstances the difficulties arise not so much because the search space is large in the traditional combinatorial sense. Instead it is the character of a solution that makes the problem difficult: A log interpretation is a sequence of loosely constrained, at times overlapping features with interspersed periods of uninteresting noise. As we explore below, this has significant consequences for the system design.
4.2 Character of the Hypotheses Generated
Compared with previous efforts, there are interesting differences .here in the type, number, and density of interpretation hypotheses generated. First, there is, as suggested earlier, both a "global" (structural dip) and "local" (stratigraphic) component to the interpretation, reflecting the existence of two different kinds of forces at work. Second, interpretations, at least in the current state of the art, are in general quite sparse. A log several thousand feet long may present ·no more than a half-dozen interesting features. Third, there is a relatively ·low degree of ambiguity, especially as compared to, say, speech.
4. Eorlier we noted that log interpretation ia largely cognitive. The dotoclion of these patterns is an interesting unsolved problem Involving both cognitive and perceptual isauea.
Fourth, adjacent hypotheses constra1n . ea~h other only very weakly and there is relatively little constramt '":'posed by a sense of "global consistency" to . an . interpretation. Wh~t constraints exist arise from the continUity over ltm~ of g~ol~gtc forces and environments. Since depth in the well IS an mdtrect measure of time, there are constraints on the rate of change vs depth in the phenomena we expect to. see. Similnriy, there ~re limits to the extent of change in depositional enwonment (manne coast, inland mountain, etc.) over the whole well. These two
factors provide some local and global consistency, respectively, to the interpretation, but they constrain the space of possible interpretations very weakly. especially as compared to, say, the situation in speech. There, syntax and semantics impose strong constraints on word adjacency, while the entire utterance is constrained to be a legal sentence.
Finally, the analysis of any given feature can involve fairly extended chains of inference. For example, four inference steps are commonly required to discover and analyze the presence of a fault.
The differences in number and density of hypotheses generated have clear implications for the system design. The sparseness and low ambiguity of hypotheses simplifies things, since it means a reduced chance of combinatorial explosion and hence less need for careful scheduling or attention focusing devices. The paucity of local or global constraints, on the other hand, makes the problem more difficult, since each hypothesis must be evaluated much more "on its own merits", with less information available from those surrounding it.
4.3 Character of the Interpretation Expertise
A major consideration in constructing programs ot this sort is the character of the knowledge available, since this in large measure determines the appropriate problem solving architecture.
To illustrate this issue, consider the sources of expertise available to previous expert systems. Dendral [2) and Hearsay-1 [6) . for example, had generators constrained by knowledge about the problem at hand; knowledge about patterns in the mass spectrum (Dendra!) or plausible moves in chess (Hearsay). The existence of both a clearly defined solution space and strong constraints to focus the generator made generate . and test plausible.
Hearsay-11, by contrast, had no strong constraints on its solution space: The bibliographic retrieval task, for E'Xample, offered far less a priori constraint on the sentence than did chess. This made made the generation and testing of entire sentences infeasible. Instead, that system focused on hypothesizing and testing individual components of the solution (syllables, words, etc.) and found its constraints in the consistency between components (e.g., syllables have to form words, words have to form syntactically and semantically valid sentences, etc.).
Here we lack both a priori constraints on the solution and (as noted earlier) strong consistency between solution components. 5
As a result we have focused instead on what we do have: knowledge about the processes that produce the signal. The rules in the program reflect a very simple but growing knowledge of geologic forces .and phenomena ... deposition, faulting, erosion, compression, etc. .. . that produce the formations.
One consequence of all this is the strongly data-driven character of our program. With no a priori constraints on the solution and little information available from internal consistency checks, a pure generate and test or hypothesize and test approach would be inappropriate.
5. There is some a priori information in the different formatl'lnl typlcelfy associated with each geologic environment (e.g .. tidal channels and flood deltas typically appear in the shallowe£t water). Experienced interpreters thus expect certain formations more than othora in a givan environment. We are still determining the amount of guidance thia can supply.
A second consequence is the obvious importance of ~eveloping a good understanding of the forces and phenomena Involved. We are not unique in attempting this: Dendra!, for example, has a theory of how molecular bonds break in a mass spectrum device. But it uses this theory as a guide and constraint for the generator. We, on the other hand, are using this information as the central source of interpretive power. (If Dendra! were forced to do the same, it would have to produce its entire analysis by reasoning about every peak in the mass spectrum as the result of molecular fragmentation.) This clearly puts a strong emphasis on developing a good model and understanding of the forces.
In this undertaking we are attempting to use knowledge ~bout. geology to provide the model and to provide a way of mvertmg the sequence of events. In reality, geologic processes produce characteristic patterns of bedding planes, which may then be distorted by various forces and events, resulting finally in the patterns recorded by the dipmeter. We wish to go in the other direction, using an understanding of geology to proceed backward from the pattern on the log to the processes and formations which produced them.
4.4 Shallow Knowledge
We have emphasized the importance of knowledge about geologic processes as a basis for interpretation and alluded to the early stage of development in which this knowledge currently exists. One important way in which the knowledge is still underdeveloped is its "shallowness". Rules of the form shown in Section 2.2 are useful for embodying a summary of the expert's reasoning process, but they do not capture the more basic phenomena responsible for the events on which that reasoning is based. Even where far more complex models of geology have been assembled (e.g. , Prospector (4]), the result has still been a distillation that omits a great deal of the more fundamental knowledge.
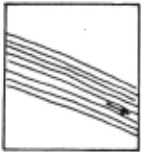
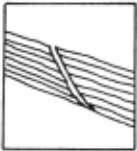
To illustrate the character of the knowledge missing from our rules, consider the rule in Section 2.2, which suggests that fault regions associated with long red patterns are growth faults . Thi.s is a useful rule of thumb that captures some part of interpretation skill. But why is it true? The sequence of idealized drawings in Figure 4 suggests one mechanism.
From [1] we learn that "Growth faults are characteristic of a rapidly growing delta where thick sand/shale deposits overlie a layer of mobile clay... It appears that high fluid pressure in the underlying clays forms a low friction glide plane. (Fig. 4a· the initial conditions and forces at work]. Under the force of gr~vity, parts of the sand/shale block move toward the lowest point of the basin by incremental creep. (Fig: 4b; the fault appears]. Due to the minimal overburden pressure .. . formation blocks slump into the fault plane under the force of gravity." (Fig. 4c].
If the fault were buried, overlying layers of rock would keep the two faces of the fault firmly in contact, and the rock layers would be distorted in the direction of the frictional drag (Fig. 4e, a "drag fault"]. Since the fault is on the surface, frictional force is minimal and instead the top layers tend to roll over into the fault plane [Fig 4c]. Since deposition continues during and after fault movement, additional layers subsequently deposited on top will conform to this bending less and less as time goes on, as
4a
411
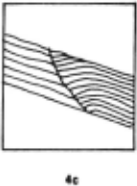
deposition " fills in" the fault. The sum total of all of these processes produces the characteristic pattern of Fig. 4d.
Note that the rule in Section 2.2 is thus only a summary (the characteristic pattern) of a fairly complex process. Understanding that process requires knowledge of geology, knowledge about the sequence of events, and the ability to reason about the process of rock movement over time.
The collection and formalization of this more detailed knowledge about the task domain will be a central focus for much of the future work on the program. II is, we believe, one important key to both more powerful expert systems and to systems that will have a more thorough understanding of their domains.
5. FUTURE DIRECTIONS
Future development of this early prototype system will focus on four main items:
Knowledge acquisition. A major part of our effort will be devoted to working on additional logs in order to build and refine the knowledge base. We estimate that a few hundred rules of the sort we now have will produce a system strong enough for use in the field.
More general control strategy. Logs are currently processed In the sequence of steps given earlier. It appears useful to have a more general strategy that allows results of later phases to trigger re-evaluation of actions in earlier phases.
Other sources of information. Often, there is available other information about a well in addition to the dipmeter logs. We will be studying ways to integrate this information into our framework to aid in the analysis.
More detailed modeling of geology. Finally, as noted earlier, a second major focus will be on developing more detailed symbolic models of geologic forces and phenomena, to provide a more complete body of knowledge than that contained in the rules.
ACKNOWLEDGMENTS
- Baker, head of Systems Science at SDR, provided management support and encouragement. The staff of Computers Services at SDR provided assistance and technical support. H. Cannon ancJ J. Callan installed the Chaosnet. Coding and other assistance with system development was provided by D. Barstow, H. Cannon , M. Forlastro, and K. Lerman. Comments
from Barstow, R. Engelmore, A. Gershman and C. Rich improved the presentation in this paper.
@inproceedings{ijcai1981p161,
  title     = {The DIPMETER ADVISOR: Interpretation of Geologic Signals},
  author    = {Davis, Randall and Austin, Howard and Carlbom, Ingrid and Frawley, Bud and Pruchnik, Paul and Sneiderman, Rich and Gilreath, J. A.},
  booktitle = {Proceedings of the Seventh International Joint Conference on
               Artificial Intelligence, {IJCAI-81}},
  publisher = {International Joint Conferences on Artificial Intelligence},
  editor    = {Patrick J. Hayes},
  pages     = {846--848},
  year      = {1981},
  month     = {8},
  note      = {Expert Systems},
  url       = {https://ijcai.org/proceedings/1981/161},
}
TY - CPAPER TI - The DIPMETER ADVISOR: Interpretation of Geologic Signals AU - Davis, Randall AU - Austin, Howard AU - Carlbom, Ingrid AU - Frawley, Bud AU - Pruchnik, Paul AU - Sneiderman, Rich AU - Gilreath, J. A. T2 - Proceedings of the Seventh International Joint Conference on Artificial Intelligence, IJCAI-81 PB - International Joint Conferences on Artificial Intelligence PY - 1981 SP - 846 EP - 848 UR - https://ijcai.org/proceedings/1981/161 ER -Copied
Machine-readable versions of this paper, for tools and AI agents:





