Automatic Detection Of Rib Contours in Chest Radiographs
Proceedings of the Fourth International Joint Conference on Artificial Intelligence. Visual Information Processing. Pages 688-693.
© 1975 International Joint Conferences on Artificial Intelligence
Abstract
We have constructed a computer algorithm that finds the contours of the dorsal and ventral portions of the images of ribs in chest radiographs. The fo llowing are a few of the expected uses for the automatic detection of rib contours: 1. Rib images contribute false positives in l·umor-Jetection algorithms. Hence, detecting the r I h co ntours should f ac il i. tate removal of these false positives. 2. The ribs provide a frame of reference for the description and location of lesions within the thoracic cavity. 3. The envelope of the ribs provides a more'accu r ate b as is for computing the boundary of the ch est cavity (referred to as the "lung boundary" in othe r papers) than other known techniques. Our algorithm consists of a) high-pass filtering of the digitized picture, b) local "edge" detection hy a combination of thresholding, Laplacian, and gradient operators, c) selection of edge elements in accordance with their angular orientation, d) matching straight l;ine segments and coni c sections to the selected edge elements, e) constructing strips centered on the straight line seg me nts and conic sections, and f) heuristic search within these strips.
- Toriwaki, J., Suenaga, Y., Negoro, R., Fukumura, T., "Pattern Recognition of Chest X-ray Images," Computer Graphics and Image Processing, Vol. 2, No. 3/4, December 1973.
- Kruger, R. P, "Computer Processing of Radio- graphic Images," Ph.D. Dissertation, Engi- neering Department, University of Missouri, Columbia, 1971. 692
- Tenenbaum, J. M., "On Locating Objects by Their Distinguishing Features in Multisensory Images," A. I. Center, Technical Note 84, SRI Project.
- Duds, R. 0., Hart, P. E., "Use of the Hough Transformation to Detect Lines and Curves in Pictures," Comm. of ACM, January 1972, Vol. 15, No. 1.
- Rosenfeld, A., Picture Processing by Compu- ~• Academic Press, New York, 1968.
- Sacerdoti, E. n., "Planning in a Hierarchy of Abstraction Spaces," IJCAI 1973 Proceed- ings. IJCAI
- Dijkstra, E. W., "The Structure of the "THE" MultiprograllDIIing System," C011111. of the ACM, May 1968.
- Nilsson, N. J., Problem Solving in Artificial Intelligence, McGraw-Hill, 1971.
- Freeman, H., "On the Encoding of Arbitrary Geometric Configurations," IRE Transactions, EC-10, Vol. 2, pp. 260-268, June 1961.
- ll. Martelli, A., "Edge Detection Using Heuristic Search Methods," Computer Graphics and Imase Processing, Vol, 1, No. 2, August 1972.
- Ballard, D. H., Sklansky, J., "A Ladder- Structured Decision Tree for Rec~nizing Tumors in Chest Radiographs," TP-74-8, University of California. Irvine, 1974.
References were extracted automatically from the PDF and may contain errors.
Full text extracted automatically from the PDF; figures, tables and equations may differ. The PDF is the version of record.
1. Introduction
ThL· detection of the contours of ribs in a radiograph hy computer is particularly difficult for a number of reasons.
The optical density changes significantly as one progresses along a contour , and in some in stances, parts of a contour disappear. In a chest radiograph, additional problems are imposed by the intersection of the images of ribs, as well as the presence of the images of other objects, such as blood vessel~ or tumors, which may he superimposed in a disturbing way over the sought after images of ribs.
The system of algorithms we use for over coming the above difficulties consists of four major steps, as shown in Figure 1.

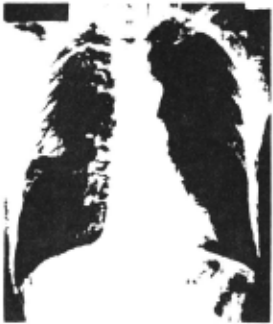
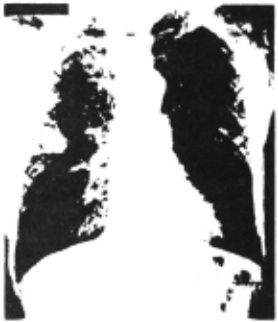
Step 1 digitizes the input picture by an op ti ca l scanner and filters the digitized picture by a high-pass digital filter [2, 3]. We refer to this step as a "preprocessor." The input and out put pictures of Step 1 are illustrated in Figures 2 and 3, respectively. In these figures the dor sal portions of the ribs are concave downward, and the ventral portions are concave upward. It can be observed in Figures 2 and 3 that the dorsal portions of the ribs are more distinct than the ventral portions. This is a result of the· attenua tion of X-rays by the lung tissue lying between the dorsal and ventral portions of the ribs.
Step 2 is a loca l edge detector consisting of a gradient, a Laplacian and a threshold operation .
Step 3 finds boundaries on a globa l basis by matching conic sections to the contours of the dorsal portions of the ribs and straight line seg ment s to the contours of the ventral portions of the ribs.
Step 4, the last step, uses the conic sectlons and the straight line segments of Step 3 as a plan for obtaining refined contours. The final r esult i s shown in Figures 8 and 9.
Earlier work on automatic rib detection has been reported by Toriwaki et al [1]. Their tech nique, however, a) is restricted to a central strip in each half of the thoracic cage and, within tha t strip, is effective mainly in the middle subset of ribs, b) seems to be seriously degraded by tumors and lesions that overlap the rib images, and c) the lower contours of the ventral portions of the ribs are not det ec ted. Our algorithm seems to have none of thes<' weaknesses. Tn part1 cuL,r, our algorithm has successfully detected ri.hs thrit arc partially obscured by a larRe tumor.
2. Preprocessing
In our image analysis laboratory the chest radiograph is reduced photographically from 350 mm x 430 mm to 100 mm x 125 mm. The reduced picture is digitized by a rotating-drum scanner into a rec tangular array of 1024 by 896 8-hit pl xe l s , spaced 0.1 1 mm apart. Each pixel is an R-h1t digitization of _! , where T. ls the incident I 1 light intensity aE a circular spot, and It is the transmitted light intensity at the spot. The dia met e r of the spot is 0.1 mm. To conserve storage space for data and to eliminate some of the noi se introduced by the scanner, a consolidation oper a tion is performed. The consolidation operation replaces every 4-hy-4 square array of pixe l s in the digitized picture by the average of the pictur e function in that array, thereby reducing the size of the digital picture to 256 by 224 pixels. Fi gure 2 displays the digitized picture after scan
ning and consolidation,
To enhance the edges, a high-pass filtering in the spatial fre~uency domain is carried out , using the Fast Fourier Transform [3] and a trans form function suggested by Kruger [2].
Let w denote the modulus of the two dimensional vector of angular spatial frequencies in the Fourier transform of p(~). Let we and wT
denote the angular frequencies below which lie 0.99 and 0.9995, respectively, of the spectral energy of p(~). Let f 0 denote the sampling fre-
quency- i.e., the reciprocal of the spacing be tween adjacent pixels. (In our case f is 2.5
lines/mm.) Let
In terms of these quantities, the transfer func tion H(w) of our high-pass filter is
The rationale behind this high-pass filtering is that high spatial frequencies are due primarily to sharp changes in gray-level densities, i,e,, to the edges present in the picture.
The digitized chest radiograph obtained by the high-pass filtering operation is illustrated
in Figure 3.
3. Local Edge Detection
The rib contours are smoothed, low-curvature curves and hence may be approximated by a chain code [10]. We refer to each element of this chain as a local edge element. The detection of local edge elements is a major task in the detection of rib contours because the vascular tissue deterio rates the sharpness of the local edges. As a re sult, only edge elements that satisfy several criteria simultaneously are selected by our al
gorithm.
Our local edge detector, described below in detail, consists of a) the modulus and the direc tion of a digital approximation of the spatial gr adient, b) a digital approximation of the Lapla c i an, and c) thresholds applied to the results of the gradient and the Laplacian operations.
3 .1 Computation of the Gradient
The picture of the modulus of computed by Eqs. 3-1 through 3-3. notes the digitized measurement of the gradient is Here p(i,j) de y log (I/It)
at pixel (i,j), G(i,j) denotes the modulus of the digital approximation of the gradient at (i,j), and y is a constant.
0
The variable n specifies how far apart on the picture grid the differences are taken. The quan tity 2n+l is referred to as the span of the gra dient, We found that n = 1 is best for our data. The gradient modulus picture provides us with knowledge about the existence of edges, but it does not take account of their direction. This direc tional information plays an important role in sub sequent parts of our system. The direction is information from which we can infer connectivity. Thus two adjacent edge elements are very likely to lie on the same continuous curve (i.e., rib contour) if they have almost the same~ection. The direction at pixel (i,j) is defined as:
where 6. (;I.,J}, fl (i,j) were defined by Eqs. 3-1 X y and 3-2, respectively,
We quantize this direction to one of the four Cartesian quadrants, Q(i,j). Specifically,
Thus the gradient operation provides us with the following information at each pixel (i,j) of the grid: G(i,j), D(i,j), and Q(i,j).
~ Computation of the Laplacian
Many digital approximations of the Laplacian have been proposed [6]. We computed the magni tude of the Laplacian by F.q, (3-6). Here L(i,j) denotes the Laplacian calculated at pixel (i,j) :
~ Thresholding and Directional Maps
After we performed the operations described in sections 3.1 and 3.2, we have for each pixel (i,j) the following information: G(i,j}, Q(i,j), and L(i,j).
The thresholding portion of the local edge detector uses two thresholds 0G and 0L to produce a binary picture M(i,j) defined by
The reasons why both the gradient and the Laplacian are needed are as follows:
- the gradient does not take account of the gray-level at the pixel itself, whereas the Lapla~ cian does;
- the edges of the picture function depend primarily on the first two derivatives of the pic ture function; and
- it has been shown that the eye can detect only lo~~rder derivatives,
The picture M(i,j) contains information about where reliable edges exist in the given picture, A direction picture R(i,j) is built from the bi nary picture M (i .j) by replacin~ each 1 in M (.i. j) (i.e., each edge element) · by its quadrant O(i,J). Thus,
Figure 4 shows the output of Step 3 1 where OG ~ 150 and 0L · 30. Here we display only the
lower boundaries of the ribs in the right and left lung, ~. those pixels where the gradient modulus and Laplacian are bigger than prespecified thre sholds. The directional picture R(i,j) is repre sented in our figure by fish-shaped edge elements "swimming" in the direction of the boundaries. As the "fish swims" it sees on its left a region of greater light intensity than on its right.
The edge elements of the lower boundaries in the right lung are characterized by quadrant Q = 3, whereas the edge elements corresponding to the lower boundaries in the left lung are characteri zed by quadrant Q = 2. Figure 5 displays a window taken from the right lung, showing images of dor sal and ventral ribs intersecting.
4. Global Boundary Detector
The edge elements produced by Step 3 have three principal shortcomings as respresentatives of the rib contours: l) some portions of the contours are represented hy overly thick "roads," 2) some portions of the contours are not repre sented at all, i.e., there are gaps in the con tour estimates, and 3) a few edge elements are not true edge elements and thus constitute noise .
The function of the global boundary detec tor is to overcome all three of these shortcomings : 1) it thins the thick portions, 2) it fills the gaps, and 3) it eliminates the noise.
The global boundary detector is a curve fitting procedure similar in concept to the Hough line detector [5]. Each pixel in M(i,j} is trans formed into a curve in a new parameter space, p . Every point on this curve in p-space uniquely re presents a specific curve passing through (i,j) in the original (i,j}-space. We call this pro cedure an accumulator array procedure, because we can think about the p-space as a d-dimensional array and each cell Tn this array accumulates the number of pixels where M(i,j) = 1 and which lie on the same curve in (i,j)-space.
We applied the Hough technique of detecting straight lines to the images of the ventral ribs . In the picture shown by Figure 3, we can distin guish seven ventral ribs (fourteen contours ) in the right lung and six ventral ribs (twelve con tours) in the left lung. From the total of twenty-six contours, twenty-one were found direc t ly from the Hough detector, two ambiguities were solved based upon the thickness of the surroun ding ventral ribs, one correction was made based upon the approximate thickness of a ventral rib, and two contours which were missed by the Hough detector due to the absence of enough relevant points were found by an extrapolation from the thickness and the location of the neighboring
ventral ribs,
To find the contours of the dorsal portions, we extended the Hough concept to the detection of c~nic sections (parabolas and ellipses). We assumed that t~e i~ges of the dorsal rib con tours can be approximated by conic sections, and that each of these conic sections has a maximum ordinate with a zero derivative. We applied an accumulator array procedure which detects small regions within the rib cage which are most likely to contain the foci of the conic sections . Thi s algorithm uses the relationship between the point s on the conic sections and the parameters of t hese curves. From the gradient direction at a given pixel (i,j), we compute a small range of admiss i ble directions for the conic sections passing through that pixel. We use the range of direc tions rather than the single computed direction of the gradient in order to overcome the effect s of noise and quantization. Consider the pixe ls obtained by Step 2 and having the configur ation (Q,6} z (1,1) or (3,1) where Q = quadrant and 6 = 1 for the right lung and 6 = 2 for the left lung. For each of these pixels, our system com putes the foci of conic sections passing through the pixel and having the directions in the r ange defined above. I.e., our system computes those conic sections whose D(i,j} belongs to the com puted range.
The array of accumulators is initialized at the value zero. Each elementary computation find s a possible focus (a,b) and increases the contents of the corresponding accumulator by 1. Eventually the algorithm provides us with high-valued accumu
lator cells. These cells are the foci of the most likely conic sections lying on the boundaries. These conic sections are then constructed by our system of algorithms.
Exploiting symmetry along the sternum (breast bone), we use the same program for both the right and the left lung. The maximum ordinates were found by using accumulator array techniques to de tect short horizontal line segments. Ambiguities due to the hilar region were solved based upon the surrounding dorsal ribs.
5. Refinement of Rib Boundaries
In a session dedicated to Robot Problem Sol ving at the 1973 IJCAI, Sacerdoti pointed out that a problem domain can be represented as a hierarchy of abstraction spaces in which successively finer levels of details are introduced [9]. The ration ale behind this hierarchy of abstraction spaces is that in order to be efficient, our problem solvers need to make extensive use of different heuristics at different stages of our problem-solving process [5]. Examples of implementations of this concept are the top-down programming approach as well as the "THE" operating-system of Dijkstra [8]. Our system of algorithms exploits such a rationale.
Step 3 approximates the rib contours by conic sections and straight line segments. In Step 4 small strips are centered around the curve segments found by Step 3. These strips constitute a "plan" in the sense of Ballard-Sklansky [12]. By using a heuristic function h, with a small look-ahead, we fit the best curve to the rib contours. Subse quently, a smoothing algorithm provides us with a smoothed curve. In this way we find a rough appro ximation of the rib contours at a higher level and we introduce the details at a lower one,
Now we will describe Step 4 in detail. In particular, we will answer the following question. Prom a pixel (i,j) on the rib boundary, how does Step 4 choose the next pixel by using the heuristic function h?
Step 4 operates as follows, A small tree with a look-ahead of three is built having the pixel (i,j) at its root and all the paths through this tree are evaluated.
We then choose as the next pixel on the curve that successor of (i,j) such that a maximum accu mulation of h is achieved for a path passing through (i,j).
h(i,j) is defined as follows:
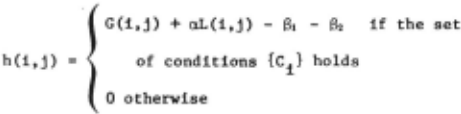
In the above definition G(i,j) and L(i,j) are the magnitude of the gradient and of the Laplacian respectively, a being constant (usually 3). 81 is a penalizing constant which is zero for points located in the middle of the strip and is increasing as we approach the border of the strip. The use of 81 forces the path to lie within the desired strip. As we go along the refined rib contour, new information is gained and a new and improved plan could be built. Based upon the last pixel added to the rib contour and the location along the same contour, a next pixel can be predicted. The effect of B, is to keep us as close as possi ble to this next predicted pixel.
{Ci} is a set of conditions which assures us that the .pixel (i,j) can be located on the curve we are looking for. The conditions {Ci} are the following:
r.l: (i ,j) belongs to the configuration (Q, o) we are looking for,
c 2 : by choosing (i,j) the connectivity cri terion is satisfied,
c 1 : the curve which is going to pass through (i,j) Is going to be a monotonically nondecreasing function up to the maximum location of the dorsal rib and afterwards a monotonically nonincreasing function until it reaches the lung boundary, and this should hold for the image of a dorsal rib contour, and
C · the curve which is going to pass through (i,j) i~ going to be a monotonically nonincreasing function for the images of the ventral ribs.
Termination conditions as boundary pixels are provided. In the case of the images of the ven tral ribs, we stop going along the contour when there is a lack of pixels showing the triplet corresponding to the ventral contours and where supposedly the costal cartilages are starting.
Figure 7 shows the effect of this processor on the image of a ventral rib contour.
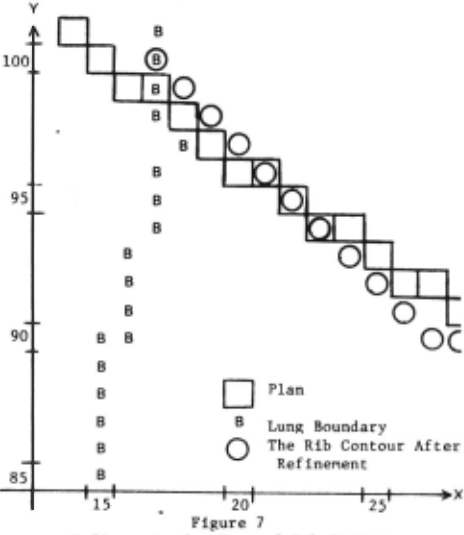
Figure 6a, b, c displays the effect of Step 4 on two intersecting rib contours (a dorsal and a ventral one). We can distinguish the plan obtained by the third step, the rib contours, after refine ment using h, and finally the same rib contours after smoothing. The pictures have been recorded at a magnification of 2 in order to display the results more clearly (i.e., each pixel is shown as a 2 x 2 matrix). Figures 8 and 9 show the result of applying Step 4 to the output of Step 3. This is also the final output for the input shown in Figure 2.
Earlier use of heuristic curve following has been reported by Martelli [11] and Ballard Sklansky {12], but to our best knowledge, this is the first use of look-ahead in heuristic curve following.
6. Summary and Concluding Remarks
The automatic detection of rib images in a chest radiograph requires a sophisticated system of algorithms. In this paper we describe such a system. One of the special attractions of our sys tem is that it can be implemented effectively.on a small computer (a "minicomputer") having only eight thousand 16-bit words of core memory and 2.5 mil lion 16-bit words of disc memory. This paper also shows how several concepts of artificial intelli gence have contributed to establishing the feasi bility of a system of algorithms for a difficult task in machine vision. (One must recognize that "difficulty" depends on the sophistication of the problem solver. A "difficult" problem often be comes "easy" after one becomes familiar with its solution.}
The rib contours detected by our system agree closely with our perception of these contours.
Improvements in our technique for rib detec tion may· lie along the following dtrectionsa 1) texture analysis of lung tissue and the bone struc~ ture of ribs, 2) building an explicit world-model representation of the rib cage, and 3) computer radiologist interaction.
7. Acknowledsments
This research was supported by the National Institute of General Medical Sciences of the U.S. Public Health Service under Grant No. GM-17632.
We are grateful to Dr. B. J. O'Loughlin of the University of California, Irvine, College of Medicine for his comments and discussions.
8. References
- Toriwaki, J., Suenaga, Y., Negoro, R., Fukumura, T., "Pattern Recognition of Chest X-ray Images," Computer Graphics and Image Processing, Vol. 2, No. 3/4, December 1973.
- Kruger, R. P, "Computer Processing of Radio graphic Images," Ph.D. Dissertation, Engi neering Department, University of Missouri, Columbia, 1971.
- IEEE Transactions on Audio and Electroacous !!£! (1967), AU-15, No. 2, June 1967.
- Tenenbaum, J. M., "On Locating Objects by Their Distinguishing Features in Multisensory Images," A. I. Center, Technical Note 84, SRI Project.
- Duds, R. 0., Hart, P. E., "Use of the Hough Transformation to Detect Lines and Curves in Pictures," Comm. of ACM, January 1972, Vol. 15, No. 1.
- Rosenfeld, A., Picture Processing by Compu ~· Academic Press, New York, 1968.
- Sacerdoti, E. n., "Planning in a Hierarchy of Abstraction Spaces," IJCAI 1973 Proceed ings.
- Dijkstra, E. W., "The Structure of the "THE" MultiprograllDIIing System," C011111. of the ACM, May 1968.
- Nilsson, N. J., Problem Solving in Artificial Intelligence, McGraw-Hill, 1971.
- Freeman, H., "On the Encoding of Arbitrary Geometric Configurations," IRE Transactions, EC-10, Vol. 2, pp. 260-268, June 1961.
- Martelli, A., "Edge Detection Using Heuristic Search Methods," Computer Graphics and Imase Processing, Vol, 1, No. 2, August 1972.
- Ballard, D. H., Sklansky, J., "A Ladder Structured Decision Tree for Rec~nizing Tumors in Chest Radiographs," TP-74-8, University of California. Irvine, 1974.
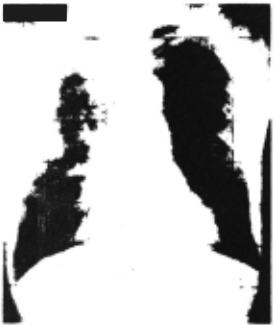
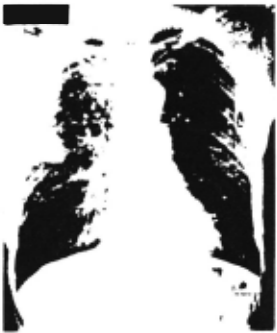
Figure 4 Direction Map Displaying the Lower Boundaries of the Ribs in the Right and Left Lung.
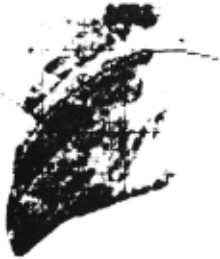
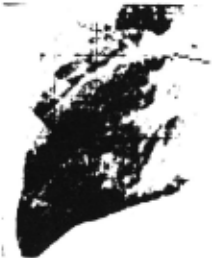
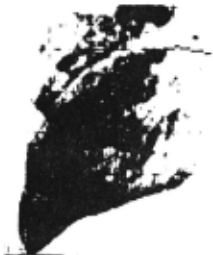
Figure be After Smoothing
Figure 6 Dorsal and Ventral Rib Contours Before and After Using Heur istic Search
@inproceedings{ijcai1975p109,
  title     = {Automatic Detection Of Rib Contours in Chest Radiographs},
  author    = {Wechsler, Harry and Sklansky, Jack},
  booktitle = {Proceedings of the Fourth International Joint Conference on
               Artificial Intelligence, {IJCAI-75}},
  publisher = {International Joint Conferences on Artificial Intelligence},
  editor    = {Patrick Winston and Carl Hewitt},
  pages     = {688--693},
  year      = {1975},
  note      = {Visual Information Processing},
  url       = {https://ijcai.org/proceedings/1975/109},
}
TY - CPAPER TI - Automatic Detection Of Rib Contours in Chest Radiographs AU - Wechsler, Harry AU - Sklansky, Jack T2 - Proceedings of the Fourth International Joint Conference on Artificial Intelligence, IJCAI-75 PB - International Joint Conferences on Artificial Intelligence PY - 1975 SP - 688 EP - 693 UR - https://ijcai.org/proceedings/1975/109 ER -Copied
Machine-readable versions of this paper, for tools and AI agents: