
A Recognition System Using Probabilistic Decisions Based on Extracted Features
Proceedings of the First International Joint Conference on Artificial Intelligence. Pictorial Pattern Recognition. Pages 171-182.
© 1969 International Joint Conferences on Artificial Intelligence
Abstract
The paper describes a pattern recognition system that has been simulated using a computer with an on-line camera input. The system is adaptive, using a training set of pictures together with the names or classes to which each picture belongs. The system uses an edge following technique for extracting features from the multilevel inputs. During the training mode, some of the descriptors derived from the extracted features are stored. Also, the system builds up statistics of the likelihood of a picture belonging to a given class given the presence of each incoming feature. During the test mode, a previously unseen set of pictures is used and features are extracted and compared with the stored descriptors. A sequential decision mechanism uses these comparisons and the likelihood statistics to produce responses corresponding to the assessed class of the input. Some preliminary experimental results are given.
- R.s. Ledley and F.H. Ruddle "Automatic Analysis of Chromosome Karyograms" Mathematics and Computer Science in Biology and Medicine. Medical Research Council (London) 1965.
- R.S. Ladley and F.H. Ruddle "Chromosome Analysis by Computer" Scientific American Vol.214, No.4, April 1966.
- C.T. Zahn "Two Dimensional Pattern Description and Recognition via Curvature points" SLAC-70, December 1966.
- B.J. Vieri and M.J. Gollifer "An On-Line Television Camera" IEE Conference Publication No.43 June 1968. Industrial Measurement Techniques for On-Line Computers.
- A. Wald "Sequential Analysis" Wiley, New York,1947.
- A. Wald "Statistical Decision Functions" \o/iley, New York, 1950.
References were extracted automatically from the PDF and may contain errors.
Full text extracted automatically from the PDF; figures, tables and equations may differ. The PDF is the version of record.
1. Introduction
The paper discusses the organisation of a Pattern Recognition System using feature descrip tors stored from a training set of inputs. The system is adaptive when working with the training set and is subsequently tested with a different
set of inputs for recognition.
Although most of the experimental tests have been performed on numerical characters (fixed font and handwritten) the system was designed as a fairly general device in order to cover a wider range of visual pattern problems. Initially, therefore, it will give a poorer performance than a special purpose character recogniser; however it should have greater potential as a fairly gen eral pattern recogniser.
It was proposed that the system should deter mine the best feature sizes and shapes for the pattern recognition task being performed and would be capable of adapting its hierarchical structure. The aim of the present research is to gain an un derstanding of how to design such systems. If this can be achieved the knowledge could be app lied to designing specific systems for specific tasks.
The system chooses its own f eatures, that is to say useful extracts from the input image, since man does not always know which parts are likely to prove useful in recognition. Thus, features are not extracted from fixed positions on a picture but are determined by the system according to the
requirements of the task.
The system
- evaluates its own features from the training set of pictures,
- (ii) builds up its own hierarchy by listing seq uences of these features into groups,
- (iii) builds up associations between fea tures and between groups of features to predict use ful areas of search within an input picture,
- (iv) adapts parameters used by the decision mech anism to improve the performance of the de cision mechanism.
The system being studied uses edge following techniques as one means of processing the input picture for the purpose of extracting features. The term 11 edge following" is used deliberately rather than "contour following". Contour follow ing traces points of equal light intensity as in the techniques of Ledley and Ruddle 1.2 and 7,ahn 3, whereas edge following traces a path of points of high intensity gradient. If a locus of high in tensity differential passes from a bright part of a picture to a dark part, the edge follower will continue to track along the locus. Edge following is a useful and flexible techni que for data sath ering and is well suited to the more flexible de cision system to be studied. Although edge fol lowing on its own has some severe limitations, the usual problems of gaps or multilation of the edges of the input shape are overcome in associat ion with the proposed learning system by directing the edge follower to new areas of search. Storing features from the edges of an object does incur loss of information but it is expected tha t for many applications the most useful information lies at the edges.
An alternative method of processing the in put picture by a clustering technique has also been considered. Briefly, this method used an iterative process with a metric that was a func tion of both Euclidean distance and intensity difference between picture points, to cluster the points into a number of subsets such that the sub sets were maximally dense with respect to the met ric. However, details of this alternative method will not be presented in this paper.
The basic philosophy behind the system being developed is described. together with a more de tailed explanation of a simplified non-hierarch ical model that has been simulated on a computer as part of the research. There are, in fact, variants of this simple model and the model it self is being continually modified during the
course of the work.
2. Description of the Non-Hierarchical or Single Level Model
As part of the development of the system, a simplified non-hierarchical version has been sim ulated on a dieital computer, using Fortran as the programming language. This model extracts fea tures from the input pattern and lists these fea tures. The model then issues a name response from analysis of the combination of features in this list. This model can be regarded as the basis of the first level of the full hierarchical system.
The input patterns are 40 x 40 matrices of picture points, each point taking one of 64 in tensity levels (integral values of 0 to 63). The sources of the input patterns are objects or phot ographs viewed by a television camera aqd conver ted into coded form by a special device\ The pictures can be input by the computer either dir ectly to the simple model or to magnetic tape.
Fig.1 shows a block schematic of the Simple Model with an Edge Following technique incorpor ated for the purpose of extracting features. The model is adaptive, using a training set and a different recognition test set of input pictures. Connections which are energised only during the learning phase are shown in Fig.1 by the letter L in parenthesis. Other connections may be made during both learning and recognition.
The matrix of intensity levels is input and the Edge Detector scans the matrix to find an edge of high intensity gradient. The Edge Follower then traces the edge until a feature is detected by the Feature Extractor.
The coded feature information from the Feature Extractor is transferred to the Comparator where it is compared with previously stored information from the Feature Store. The Comparator issues a measure of the degree of fit, known as the Score, and the Feature Store produces the name of the stored feature having the largest Score. These Feature Names are purely arbitrary and are allo cated in sequence down the Feature Store. In the current version of the Simple Model, the Feature Store is filled during an initial period of the learning phase. During this period, when the largest Score is below a certain threshold, then the extracted feature is added to the Feature Store as a further feature type and the next seq uential Feature Name is allocated to it.
During the learning phase the True Class Name is input from tape, in the case of tape con verted pictures, or from manually operated buttons in the case of direct camera input. In this phase, the True Class Name is fed together with the issuro Feature Name to a block which builds up statistics of likelihoods of each class for each given feat ure.
During both learning and recognition phases the Feature Name is added to a Feature List (initially clear when a fresh picture is input) to form a current list of features extracted from the input picture.
The Decision Mechanism uses the likelihood statistics to produce a sequence of Class Name Responses from the growing number of features in the Feature List.
During the learning phase, the features in the Feature List are fed together with their positions in the input picture to a Positional Matrix within the Next Feature Predicator. The Positional Matrix computes the relative distances between the various combinations of features. Over a number of input pictures, the Positional Matrix produces a number of mean values of the relative distances.
During recognition, when a sequential Class Name Response is produced, the Decision Mechanism uses information from the Likelihood Block to predict the most likely occurring feature, not yet found, for the expected class. The name of this predicted feature is fed to the Next Feature Predictor, which examines ·the current Feature List and the Positional Matrix, in order to direct the Feature Extractor to a new area of . search. If the predicted feature is found, it is added to the current Feature List and further predictions may take place. However, if the pre dicted feature is not found, the system returns to the Edge Follower and the next adjacent fea ture is extracted.
In addition to producing a Class Name Res ponse, the Decision Mechanism produces a measure of confidence of its ~esponse and in general this confidence level increases as the number of fea tures in the Feature List increases. The system can stop its examination of the input picture either when the confidence level exceeds a cer tain threshold or when all edges in the picture have been traced. A final Class Name Response is then produced and the system is ready for the next picture.
During both learning and recognition phases, more than one edge can be followed. Furthermore, it is not necessary to linearise the input pat tern; thus solid objects can be used as data as well as line objects.
The following sections 3 to 7 explain the operation of the various mechanisms in further detail.
3. Edge Tracing and Feature Extraction
3.1 Edge Detection
The first operation is to scan the 40 x 40 picture point matrix for an intensity gradient which might correspond to the edge of some shape in the picture. Initially 200 random picture points out of the total population of 1600 are sampled to obtain an estimate of the standard deviation of the intensity of the points.
The picture is then examined by a window which consists of a horizontal slit, six elements long and one element wide, which scans the pic ture in horizontal sweeps similar to a T.V. line scan. Successive positions of the window over lap so that the central cell of the window moves through the entire set of picture points except those at the extreme edge. At each position of the slit the right-most element is tested to determine whether it differs by a significant amount from the local mean of the six. This amount is set by the value of a quantity c.s, where s is the standard deviation and c is a con stant; the latter value determined by trial and error in this instance, but ideally adjustable in the complete system as a function of the perfor mance. When a significant element is found an additional test is made. One of the three ele ments immediately below this first point must also be found significant by the same test before the point may be accepted. Figure 2 illustrates this process with slit A failing to find an edge and slit B finding an edge at element with value 42.
As soon as such a significant point is foun~ its co-ordinates are stored together with an in dication as to whether the point is brighter or darker than the local mean of the elements.
3.2 Edge Following
When the Edge Detector finds a significant point a 3 x 3 window and a 5 x 5 window are cen tred on the point (Fig.3). The mean of the 25 points of the large window is calculated and then an auxiliary 3 x 3 matrix is formed, each cell of which has the value 1 or 0 (Fig.4a). If the sig nifi cant point found by the Edge Detector had been brighter than the local mean then 1 1 s are placed in those cells of the auxiliary matrix corresponding to cells in the small window whose i ntensities are greater than the mean of the 25. The remaining cells are filled with O·s. If the significant point had been dark the 1 1 s are placed in positions corresponding to intensities less than the mean.
The next stage is to move the small window by one cell in one of the eight possible hori zontal, vertical or diagonal directions along the edge of the shape and to repeat this process of binary quantisation. The movement consists of centralising the window on the first 1 1 1 encoun tered by an imaginary anti-clockwise rotating vector, centred on the auxiliary matrix and look ing at the outer cells of this matrix in turn. The vector starts from that cell, in the auxi liary matrix, corresponding to the picture ele ment that just preceded (in the anticlockwise sense) the one selected previously by the vector as containing the first 1 1 1 ·
A new 5 x 5 window and a new 3 x 3 auxiliary matrix are formed around the new centralised pos ition and the process is repeated as shown in Fig. 4. A new localised mean is derived from the 5 x 5 window to quantise the picture points of the auxiliary matrix into 1's and O·s.
3.3 Feature Extraction
The Edge Follower outputs a string of co ordinates representing successive points on the edge of the shape being traced. The Feature Extractor measures the mean curvature of all strings of Y consecutive picture points (Y is related to the resolution of the picture). The curvature is signed according to the direction of movement of the Edge Follower. Hence, a list of curvatures of overlapping strings is produced. \fuenever a string is found whose curvature differs from that of the previous fea ture by an amount greater than another parameter d, a feature is said to have been completed. This feature is output in terms of the co-ordinates of the first point in the first string of the feature, the last point in the last string, and the average value of the centre points of all the strings in the feature.
Two methods of encoding the extracted feature are being investigated. The encoded descriptor in one case takes the form of a sub-array or "snapshot" of K x K elements (each element taking one of the 64 possible intensity values) centred on the average value of the centre points of the feature found while Edge Following. In the sec ond case (line segment form), the encoded descr~ tor contains the start and finish picture point co-ordinates of the fea ture found by Edge Follow ing together with the mean curvature of the Edge.
4. Comparison of Features
When features are extracted from the input image, each fea ture in encoded descriptor form is fed to the Comparator, where the extracted descriptor is compared with each of a number of previously stored feature descriptors. The Com parator produces a measure of t he degree of fit, known as the Score, between an incoming descriptor and a stored descriptor.
During an initial part (Mode O) of the learn ing phase, if all the scores S are below a certai n value (either a preset amount or an adaptable quantity), then the incoming descriptor is added to the Feature Store as a new descriptor and a sequential feature name is allocated to it.
During the subsequent part (Mode 1) of the learning phase and during the recognition phase (Mode 2), the Scoring Mechanism issues the assoc iated feature name of the stored descriptor having the largest score value S. The issued feature name is fed to a list L (initially empty at the start of examination of each input picture) during Modes 1 and 2.
Each of the two methods of encoding extracted features demands a different method of scoring. With the K x K "snapshot" descriptor

where Iw(a) and Is(a) are the respective inten sities at coresponding array points (a) for the extracted and stored features. (The power law n equal to 3 appears to give the best results).
With the line segment descriptor various functions of the Euclidean distance 6B between the start points of the extracted and stored features, the Euclidean distance 6F between the finish points and the difference 6C in curvatures are being examined. An example function is
s = <1 +6rf +6i + Q.,6cl )- 1
where Q is a weighting factor
5. The Decision Mechanism
5.1 Likelihoods of Classes for a Given Feature
The system contains an array of items V ex, the likelihood of class c given the feature named x. During the learning phase (Mode 1) of the Simple Hodel, the Vex for all classes are updated such that
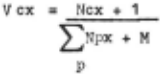
where M is the number of different classes and Ncx is the number of times feature name x has been issued over all presentations of class c as the input picture. Thus ~ Npx, the summation p
over all classes, is equal to the total number of times that feature name x has been issued.
Therefore, if feature name x is issued when class t, for example, ie the input picture during learning, then both Ntx and ~Npx are increased p by 1 while all Ncx (where c ~ t) remain constant. Thus, since Ntx + 1 is less than ~Npx + M, Vtx p is increased in value while all other Vex (c ~ t) are decreased.
Thus Bayes' type likelihoods are built up during the learning phase.
detected for a particular class during the learn ing phase, is subsequently extracted during the recognition phase, then the likelihood is taken as a near chance value rather than zero. Thus the formula effectively includes a weighting for frequency of occurrence of features; it should be noted that the formula assumes equal a priori probabilities of classes in that initially all vex = 1/M.
5.2 The Sequential Decision Response
As each Feature Name is issued from the Scor ing or Comparison Mechanism, it is added to a list for the current input picture under examination. Thus a current list L of the input feature names f(1), f(2), f(3) ··· f(r) is bu~lt up, where f(r) is the feature name x of the rth feature from the input picture.
The Decision Mechanism extracts the corres ponding values Vpx from the array of likelihoods for all classes p and each feature name x in the list L. From these values the sequential prod ucts Rp are formed for each class p where
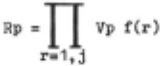
where there are j features currently in the list L.
A Sequential Class Name Response is issued in favour of the class currently having the highest value of Rp.
The Rp values are, in fact, normalised; that is to say each Rp is expressed as a percentage of the sum of the Rp values. Thus, as the number j of features in the list L increases, the non normalised values of Rp decrease since the terms Vp f(r) are all less than or equal to 1. However, in general, the normalised highest percentage value of Rp increases as the list L lengthens. Thus it is possible to regard the percentage val ues of Rp as confidence levels and these values may be used as part of a Stopping Rule (see section 7).
It can be seen that if rare features had been allowed to produce a zero valued Vex, a single poor or rare feature would have destroyed the effect of all strong features in the list L, since the decision is produced by a product of the Vex terms.
6. Prediction of the Next Feature
Edge following and feature extraction may take place continuously around a complete edge of a shape. However, it is possible for the Next Feature Predictor to extract non-adjacent features. At present, prediction has been used only with the "snapshoV' type feature descriptor.
During the learning phase, features are ex tracted by Edge Following and no prediction takes place. Nevertheless, statistical information is gathered for use by prediction in the later re cognition phase. This information consists of the names of the extracted features together with the positions of their feature centres. At the end of processing each input picture, the relative distances between all combinations of features ex tracted from the picture are computed and in a number of positional arrays (one for each class) the mean distances and the standard deviations of the distances between combinations of features occurring in each class are built up.
During the recognition phase, initially three features are extracted by the Edge Following tech nique. The quantity three may be increased by changing a parameter on a data card associated with the Computer program. The initial three features are used to produce a Class Decision as previously explained.
Now the likelihood array does not store the values of Vex directly but stores the values Ncx, and the Vex are computed when required. Thus the Ncx can be used to indicate the frequency of occurrence of each feature for any given class. Therefore, when the Class Decision is produced from the first three features, the likelihood array is used to predict the most likely feature not already extracted for the decided class of the current input picture.
The Positional Array is then inspected for the mean relative distances (and stored deviations of these distances) between the predicted feature and the three extracted features for the decided class. The expected position of the predicted feature is computed by a standard geometrical triangulation method from the three relative dis tances. A search area is produced about the ex pected position in both horizontal and vertical directions of the input picture; the size of the search area being a function of the stored dev iations. The search area is further restricted to be contained within the 4o x 4o frame. A series of over-lapping sub-arrays or "snapshot~· is then extracted centred on all possible pos itions within the search area.
The extracted "snapshot~· are compared in turn with the descriptors in the Feature Store. If the predicted feature is not found, the system returns to the Edge Follower to find the next adjacent feature by the method of section 3. If the predicted feature is found, it is added to the list L and using the Decision Mechanism of section 5, the confidence level of the Class Decision in creases.
As the list L increases using the Edge Foll owed or predicted features, further predictions are made using the last three features in the list for locating the search area.
The predicted sequence is equivalent in some ways to the formal syntax (e.g. sharp clockwise curve followed by fairly straight segment followed by, etc.) as used by Ledley and Ruddle 1,2 and others. However, allowing the system to generate its own sequences, of not necessarily adjacent features, preserves generality and requires no foreknowledge of the syntactic formation.
?. The Stopping Rules
During the learning phases, when no predic tion is taking place, the process of feature ex traction and decision making continues until all edges have been followed and then a new picture is read in. There is, however, a deliberate res triction that prevents more than 30 features being extracted from any one picture. In the experi ments this limit has never yet been reached.
During recognition, when prediction of fea tures may take place, the process of feature ex traction and decision making continues until either all edges have been followed, or 30 fea tures have been extracted, or the confidence level of the Decision Mechanism exceeds 90%,.whichever is the sooner.
In general, using printed or handwritten nu merals as input, the 90% confidence level comes into play only when a correct decision is being made in recognition whereas, in general, incorrect decisions rarely exceed 60% confidence and are often considerably lower. However, a significant number of correct decisions lie in the 50% to 90% confidence range.
Thus if the system were allowed only to make decisions if a 90% confidence had been reached then wrong decisions would be rarely made. How ever, decisions would be made on a minority of occasions only. Ideally, in generalised pattern recognition, a cost function should be introduced and the use of sequential decision theory (Wald5.6) could be used.
During the computer simulations, for each picture, the full list of sequential decisions was printed out together with the corresponding confidence levels. If non-decision is counted as being equally as wrong as incorrect decision, then roughly 60% confidence as a decision threshold appears to give the best overall results. Improved stopping rules are being examined.
8. Experimental Studies
EXperiments have been performed mainly with numerals 0 to 9 as test patterns. These were ex tracted from two sources. The first source was from 35mm negative photographs of telephone ex change meter dials. Although these were fixed font, the mutilation was often very high, as shown in ~~g.5 which shows a "Computer's eye view" of an input. The "view" was produced on a Graph Plotter peripheral of the Computer by varying the amount of ink in each of the 4o x 40 picture point posi tions. Although the Computer receives intensit ies of one of 64 levels, for simplification the Graph Plotter output has been requantised more coarsely into one of 6 levels.
The other source of numerals was derived from handwritten samples from 15 people. Numerals were written in ink, biro, pencil or red crayon.
In all tests the recognition set was made up from examples that had never been seen during the learning period.
With the sub-array or "snapshot" type feature descriptor it was found that enlarging the array dimensions improved the results. However, com puter storage limitations restricted the array to 7 x 7 in size and thus the largest feature size used in the present tests was 7 x 7.
The beet preliminary results achieved with the single level model using the numerals from the telephone meter photographs were 821% correct. The simple model then had a stored total of 77 sub-array features which it had extracted from one example of each of the ten classes of numerals. Four examples of each class were used for updating t he likelihood statistics and four examples of each class were used for updating the likelihood statistics and four examples of each class were used in the recognition set.
The recognition set included the example of Fig.5 which the system did not identify correctly. (But since the 11 correct" answer had been ruled to be a 1, it is debatable whether this can be coun ted as a true failure). No attempt, however, was made to select or remove any of the scanned ex amples from the input tape and thus the results may appear to be unfairly low.
With handwritten numerals, again one example of each numeral was used for feature storage giv ing a total of 83 stored features. Ten examples of each numeral were used for updating statistics. Using a r ecognition set of numerals from people who had not had examples of their handwriting used during the learning phase gave only a 30% success rate. However, when examples not previously used by the model, but nevertheless from people who had supplied examples for the learning set, were then used as the recognition set of the success rate rose to 70%. These results are not unexpected and indicate the requirement for much further teaching of the complete system to provide the increased generalising ability needed for more difficult tasks.
\o/ith the Line Segment type feature, instead of the sub-array or "snapshot" type descriptor, and using the telephone meter photographs, the best results achieved were 70% correct recognitions.
9. The Hierarchical System
A block schematic is shown in Fig.6 which indicates how the simplified model may be extended into an hierarchical system.
At the first level, features are extracted from the input picture. The coded representation of the input fea ture is compared with all repre sentations from the Feature Store which have been previously stored during a training phase. A Feature Name is issued as in the simplified model. During the training mode the Next Feature Predic tor builds up the probabilities of any particular feature being present in an input picture when another fea ture is known to be present. The Overall Decision Mechanism can use the information from the Next Feature Predictor in order to direct the Edge Detector, with the Feature Extractor, to new useful areas of search.
Also during the training mode, the Feature Decision Mechanism counts the number of times each feature occurs for each Class Name of the input pictures and from this builds up probabili ties of each class given a particular input fea ture. Thus, when a Feature Name is issued, the Feature Decision Mechanism predicts the most like ly Class Name of the input picture. This predic tion is fed in turn to the Overall Decision Mech anism. Alternatively, a number of Class Names is issued, with the Feature Decision Mechanism pre dicting all names with probabilities above some preset (or adaptable) value. In this latter case, the Overall Decision Mechanism receives the values of the probabilities as well as the predicted names.
As the system examines various edges of the input shape, a sequence of features is produced. This causes a sequence of Feature Names to be issued to the Group detector where a current list of features from the Input Picture is built up to gether with the absolute or relative positions of these features. The Hierarchical System uses the coded Group in a manner similar to that used with the coded input feature. The coded Group is com pared with codes from a Group Decision Mechanism in order to locate new areas of search in the in put picture, in order to find further Group Shapes. This examination of Group information is the sec ond level of the hierarchy.
Similarly, there can be a third level of the hierarchy listing the Group Names for an Associa tion Store. A Decision Mechanism, as before, pre dicta a Class Name when the Association is identi fied.
Thus as the input picture is examined, a seq uence of Class Name predictions is made at various levels in the hierarchy together with a list of Feature Names, Group Names and Association Names. When the Decision Mechanism has received suffic ient information to produce a decision above a certain level of confidence a Name Response is produced. During learning, the Name Response can be compared with the true Class Name of the input picture and the threshold of confidence may be adapted. The Overall Decision Mechanism can either build and use a sequential decision tree or use the information from the three hierarchical
Acknowledgements
Acknowledgement is made to the Ministry of Technology (U.K.) and E.M.I. Electronics Ltd. who jointly supported the work. The authors also wish to thank M.K. Inglis for his work on the Edge Detector/Follower and Messrs. J.A. Wiseman and R.W. Moth for programming assistance.
@inproceedings{ijcai1969p17,
  title     = {A Recognition System Using Probabilistic Decisions Based on Extracted Features},
  author    = {Murden, P. and Symons, M.},
  booktitle = {Proceedings of the First International Joint Conference on
               Artificial Intelligence, {IJCAI-69}},
  publisher = {International Joint Conferences on Artificial Intelligence},
  editor    = {Donald E. Walker and Lewis M. Norton},
  pages     = {171--182},
  year      = {1969},
  month     = {5},
  note      = {Pictorial Pattern Recognition},
  url       = {https://ijcai.org/proceedings/1969/17},
}
TY - CPAPER TI - A Recognition System Using Probabilistic Decisions Based on Extracted Features AU - Murden, P. AU - Symons, M. T2 - Proceedings of the First International Joint Conference on Artificial Intelligence, IJCAI-69 PB - International Joint Conferences on Artificial Intelligence PY - 1969 SP - 171 EP - 182 UR - https://ijcai.org/proceedings/1969/17 ER -Copied
Machine-readable versions of this paper, for tools and AI agents:





